Week-11 Challenge: Braking
PROJECT: BRAKING
OBJECTIVES:
- For a defined driving cycle, calculate the energy required for braking.
- Why electric motor can’t develop braking torque at high speed similar to starting? How electric and mechanical brakes are coordinated?
- Make a MATLAB program which plots contour of given motor speed, torque and efficiency values. Attach the code as a .m file attach a screenshot of all the plots.
SOLUTION 1: For a defined driving cycle, calculate the energy required for braking.
Driving Cycle: To determine a vehicle's fuel consumption, a driving cycle with a set of speed & time is employed, which is then used to compare the fuel consumption of other vehicles. The following are the driving cycle's primary uses:
- to evaluate a vehicle's performance (fuel economy, emission tests)
- to examine the battery's condition and energy usage in electric vehicles
- to practice car model development before really doing it
Braking: When a road vehicle brakes, kinetic energy is transformed into thermal energy (heat). When applying the brakes, the driver commands a stopping force that is several times stronger than the force that propels the vehicle forward and releases the kinetic energy in the form of heat.
The law of conservation of energy, which states that energy cannot be generated or destroyed but only transformed into another form, is followed during the braking process.
Kinetic's equation is 1/2*m*v2.
where,
m = the vehicle's mass in kilograms
v = the vehicle's speed in m/s
E(kinetic) = Kinetic energy in KJ
In our situation, the velocity will be (V-Vi), where V is the vehicle's speed and Vi is the speed of the vehicle that is being slowed down or brought to a stop.
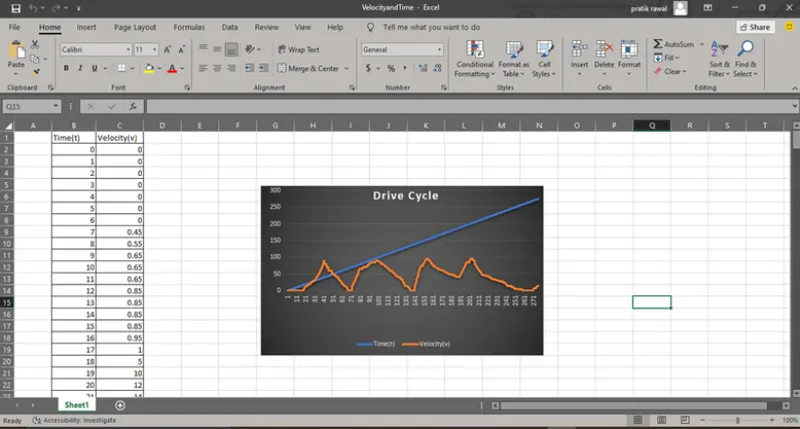
For Driving cycle an Excel sheet(.xls) is imported,
MATLAB CODE:
Energy required for Braking

clear all
close all
clc

%Read the Drive Cycle data from excel file
DC=xlsread('VelocityandTime.xlsx');
T=DC(:,1); %Time in seconds
S=DC(:,2); %Speed in Kmph

%vehicle data
m = 1000; %mass in Kg
V=S./3.6; %Speed in m/s

%Create an Array to store values for Deceleration & Braking Energy
Z=length(T);
deceleration=zeros(1,Z);
acceleration=zeros(1,Z);
BE=zeros(1,Z);
AE=zeros(1,Z);

for i=1:(length(T)-1)
if V(i)>V(i+1)
BE(i)=0.5*(V(i)-V(i+1))^2; %Braking Energy in Joules

%since Time Delta is 1sec Acc or dec, a=V/T=V..m/s^2, where T=1
speed_decrease(i)=V(i)-V(i+1);
deceleration(i)=speed_decrease(i);

end

if V(i)<V(i+1)
AE(i)=0.5*m*(V(i+1)-V(i))^2; %Accelerating Energy in Joules

speed_increase(i)=V(i+1)-V(i);
acceleration(i)=speed_increase(i);
end

end

%Total Braking Energy in KJ
B_E=(sum(BE)/1000);
%Total Acceleration Energy in KJ
A_E=(sum(AE)/1000);

%Plotting Curves
figure(1)

subplot(2,1,1)
plot(T,S,'color','b')
xlabel('Time(s)')
ylabel('Speed(Kmph)')
title('Drive Cycle')

subplot(2,1,2)
plot(T,deceleration,'color','r')
hold on
plot(T,acceleration,'color','g')
xlabel('Time(s)')
ylabel('Acc/Dec(m/s^2)')
title('Acceleration-Deceleration')

figure(2)
plot(T,BE)
hold on
plot(T,AE)
xlabel('Time(s)')
ylabel('Energy(J)')
title('Energy consumed during Braking & required for acelerating throughout Drive Cycle')
legend('Braking Energy','Accelerating Energy')

fprintf('Total Energy consumed during Braking is %f KJ',B_E)
disp(' ')
fprintf('Total Energy consumed during Acceleration is %f KJ',A_E)
Explanation of Code:
- The Time and Velocity values are added to the Arrary after importing the xls file, "VelocityandTime" into the Matlab workspace.
- The code defines all of the numbers, including mass and velocity, before converting the velocity value to meters per second.
- The length of time value has been constructed in a for loop.
- The length of the variable name has been specified.
- A 'for' loop is used to calculate the values for acceleration and deceleration.
- Energy in its whole is calculated.
- All the input needed to plot graphs has been mentioned.
RESULTS:
CONCLUSION:
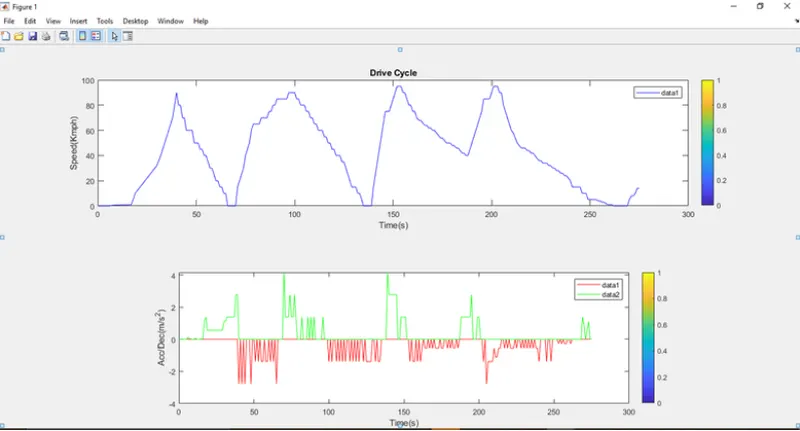
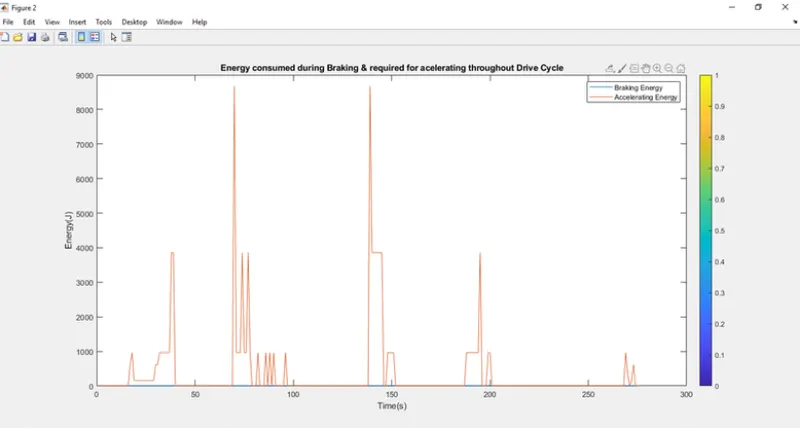
After the simulation is finished, we can see the two values ; Total energy used for acceleration is 95.342400 KJ, whereas total energy used for braking is 0.066975 KJ. We can see that the driving cycle matches the imported excel file exactly. Also visible is the energy used for acceleration and deceleration, with red denoting acceleration and blue denoting deceleration.
SOLUTION. 2:
Why electric motor can’t develop braking torque at high speed similar to starting? How electric and mechanical brakes are coordinated?
Regenerative Braking:
These systems convert kinetic energy from an object into potential or stored energy in order to slow down the vehicle and, as a result, improve fuel efficiency.
The regenerative braking system uses a variety of energy conversion techniques, including electromagnetic, hydraulic, flywheel, and spring. A hybrid electromagnetic flywheel was developed more recently.
They are connected to a vehicle's drive wheels or mounted along the drive system, where they use magnetic fields or mechanical torque to prevent the wheels from turning. Unlike friction brakes, which simply waste energy by converting the kinetic energy of the vehicle into thermal energy to slow it down, these motion inhibition techniques allow energy to be created during braking.
Regenerative braking systems can reduce brake pad wear and improve fuel efficiency by lowering the overall braking load placed on the vehicle's friction brakes. When the driver applies the brakes in a HEV or an EV, the transmission is configured so that the electric motor reverses and applies resistance to the wheels rather than power. This resistance is then passed through the electric motor and utilized to replenish the batteries.
Limitations:
The braking force from an electromagnetic field is always constrained by the maximum charging rate of the circuit and the battery capacity.
Why electric motor can’t develop braking torque at high speed similar to starting?
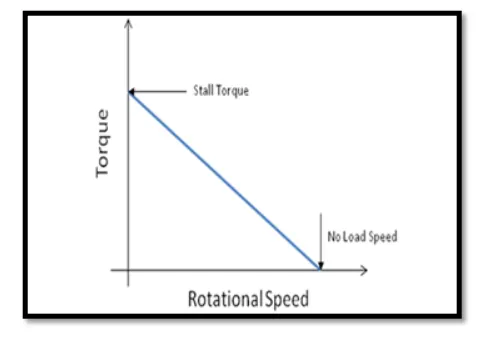
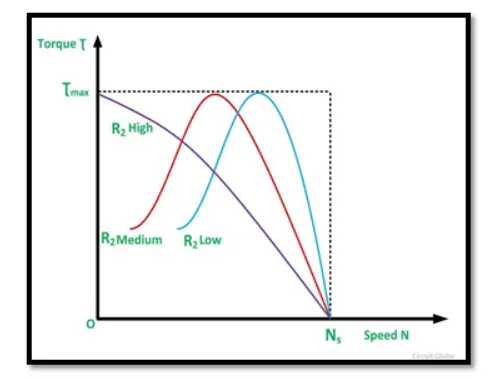
DC motor Torque vs Speed Characteristic
In an electric vehicle, a motor-generator and battery pack are used to generate power. As electricity flows through the motor under a magnetic field, it produces force. The motor will spin faster the more current is applied.
For regenerative braking, a motor will function as a generator, meaning that the flow of electricity is reversed; instead of drawing current to spin the armature, the armature is spun via the field by the vehicle's deceleration. The motor can switch between driving the vehicle and generating electricity as quickly as the driver can accelerate and deccelerate. The electricity generated is used to recharge the battery.
"Back electromotive force," sometimes known as "back EMF," is produced as the motor's rpm rise. The motor might give less effective voltage the faster it rotates because more back EMF is produced. However, at zero RPM, the motor produces zero back EMF, thus all of the electricity it generates from the moment electric power is applied becomes instant torque. The back EMF increases with rpm, hence the instantaneous torque effect decreases.
The cause of this is that the Vmotor is too close to the Vbemf, thus current can't increase further even though the current loop wants to increase current (proportional to torque) by raising the PWM duty cycle of the power stage.
- The load remains in balance whenever friction torque plus additional loads equal motor torque (constant speed)
- The load accelerates if the the motor torque exceeds the sum of the friction torque and the additional loads (Motor torque - Friction torque - Additional loads = Acceleration torque > 0).
- The appropriate motor torque is, however, constrained at high speeds because the BEMF is so close to Vbus; the larger the friction torque with additional load, the smaller the acceleration torque.
— Because the majority of the torque is used to raise the kinetic energy of the load, this scenario does not arise at the start of an acceleration (and motor). However, it is impossible to increase the torque while the speed is already high and no additional load is being added.
This can be avoided by,
— Boost the voltage on the DC bus.
— System acceleration is not limited.
— Use a motor with lower back EMF percentage and less resistance.
How electric and mechanical brakes are coordinated?
A regenerative braking system uses a motor that, when turned around, functions as a generator to transform waste energy (heat) into useable energy (stored in a battery). There are some restrictions with RBS, one of which is that the electric motor can't deliver all the brake torque required for significant decelerations. If only one axle receives the braking torque during braking, stability and maneuverability problems may result. Regenerative braking is therefore used in conjunction with a friction (mechanical) brake system to prevent such a predicament.
Brake Control Strategy, which refers to the strategic application of RBS and mechanical brakes.
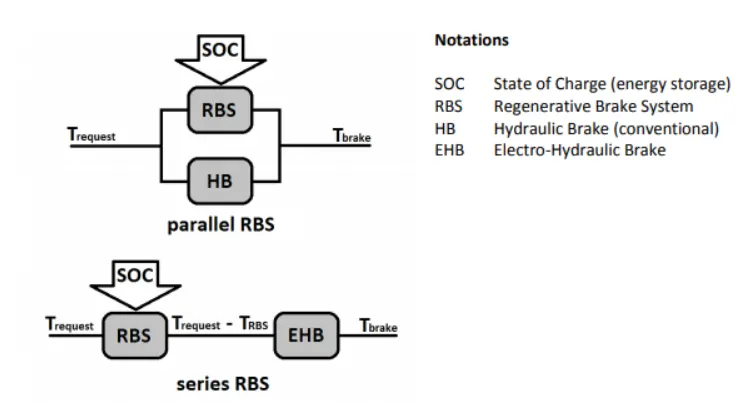
1. Series RBS or Series Brake Control
The mechanical and regenerative (electric) brakes are applied successively in this type of control system. Only one brake system—either RBS or mechanical brakes—can be used at once.
The series brake system is additionally divided into:
a. Driving comfort
b. Applying brakes in accordance with energy efficiency
2. Parallel RBS or Parallel Brake Control
Both the mechanical brakes and RBS are deployed concurrently in this type of brake control system.
SOLUTION. 3:
Make a MATLAB program which plots contour of given motor speed, torque and efficiency values. Attach the code as a .m file attach a screenshot of all the plots
Losses that happen in all electric motors:
1. Copper Loss: I^2.R, where R is the Armature resistance and torque and current are inversely related. This copper loss is denoted by Kc.T^2, Kc is the resistance of the brushes, the flux, and its impact in time T.
Losses from Copper = Kc.^T2
2. Iron Losses: Due to magnetic losses, iron losses occur and are indicated by Ki.ω, where Ki is the factor based on the magnetic field impact The iron losses for permanent magnets, which have a constant magnetic field, are based on the value of Ki, which is always changing owing to variations in speed.
Ki.ω = Iron Losses
3. Windage Losses: The amount of windage losses that the motor will endure depends on the size, shape, and design of the motor.
Windage Losses = Kw.ω^3
4. Constant Losses: These losses, which are represented by the letter C, are always present in the motor.
Total Losses: The Total Losses are determined by adding all four losses together and are indicated as follows:
Total Losses = Kc.T^2 + Ki.ω + Kw.ω^3 + C
MATLAB Code:
Matlab Code for Motor Efficiency

%Efficiency Mapping for Electric Motors
clear all
close all
clc
x = linspace(1,1000); % Speed in rad/s
y = linspace(1,250); % Torque in Nm

%Motor loss constants
Kc = 0.2; %Copper Loss
Ki = 0.008; %Iron Loss
Kw = 0.00001; %Winding Losses
C = 20; %Constant Motor Losses

[X,Y] = meshgrid(x,y);
Output_Power = (X.*Y);

C_1 = (Y.^2)*Kc; %Copper Loss
I_1 = (X*Ki); %Iron Loss
W_1 = (X.^3)*Kw; %Winding Loss
Input_Power = Output_Power+C_1+I_1+W_1+C;

Z = Output_Power./Input_Power;

V = [0.70,0.80,0.85,0.90,0.91,0.92,0.925,0.93];

box off
grid off

[c,h] = contour(X,Y,Z,V);
xlabel('Speed(rad/s)');
ylabel('Torque(N/m)');
clabel(c,h);
Code Explanation
— The linspace command is used to insert each Speed and Torque value as an array.
— The meshgrid command is used to arrange the arrays into a 2D grid.
The definition and storage of various motor losses and their coefficients.
— How motor losses are determined
Copper Losses = Kc.T^2
Iron Losses = Ki.W
Windage Losses = Kw.W^3
— Input and Output Power are computed.
— The torque speed curves are plotted with a contour, and the clabel command is used to map efficiency.
Conclusion:
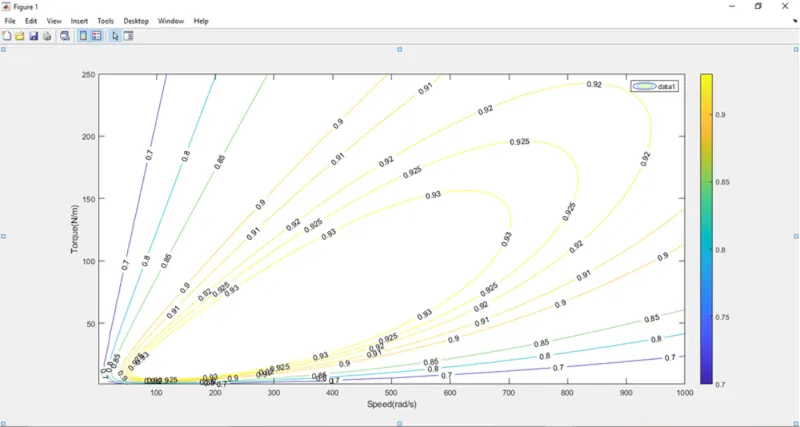
Contour Plot: In a two-dimensional (2-D) plane, contour plots are used to depict a three-dimensional (3-D) surface. It plots a response variable Z as contours together with two predictor variables X and Y on the y-axis.
The X-axis in our simulation represents speed (rad/s), and the Y-axis represents torque (N-m).
Results:
— Efficiency charting for various efficiency values that were given in the matlab code may be seen in the output results.