Week-11 Challenge: Braking
Question 1: For a defined driving cycle, calculate the energy required for braking.
Solution:Calculating the energy required for braking of UDDS Drive Cycle-
Braking: Braking is a condition to slow down or stops a moving vehicle as required. There are several techniques to apply brakes, which can be mechanical or electrical. The most commonly used technique is by applying friction. It consumes energy .The consumed kinetic Energy can be derived as following equation-
Braking Energy = (1/2)*m*v^2
Where, Braking Energy is the kinetic energy in unit of Joule.
m= Total Mass of the Vehicle (Vehicle Mass + Pay Load) in unit of Kg.
v= (Initial Velocity-final Velocity) in unit m/s.
For Example if Initial speed of a vehicle is 20m/s and final speed is 10m/s. The mass of the vehicle is 500kg. Then the required kinetic energy for Braking is
(1/2)*500*(20-10)^2 = 25000 J =25KJ
Here for a Drive cycle the required braking energy is calculated for each second of time to slow down or stop the vehicle- Braking Energy Calculation for UDDS Driving Cycle
At first, the drive cycle is determined in a Table and a plot is made. Using the plot, the values from the braking regions of the vehicle are taken. The plot of the drive cycle is given below.
At first i creating a drive cycle in excel sheet see the below like this
| Time in Sec | Speed in Kmph |
| 0 | 0 |
| 1 | 1 |
| 2 | 3 |
| 3 | 6 |
| 4 | 9 |
| 5 | 12 |
| 6 | 15 |
| 7 | 18 |
| 8 | 25 |
| 9 | 35 |
| 10 | 50 |
| 11 | 55 |
| 12 | 60 |
| 13 | 50 |
| 14 | 40 |
| 15 | 40 |
| 16 | 41 |
| 17 | 42 |
| 18 | 43 |
| 19 | 44 |
| 20 | 45 |
| 21 | 46 |
| 22 | 47 |
| 23 | 48 |
| 24 | 49 |
| 25 | 50 |
| 26 | 40 |
| 27 | 35 |
| 28 | 30 |
| 29 | 35 |
| 30 | 36 |
| 31 | 37 |
| 32 | 40 |
| 33 | 43 |
| 34 | 47 |
| 35 | 55 |
| 36 | 60 |
| 37 | 63 |
| 38 | 66 |
| 39 | 69 |
| 40 | 70 |
| 41 | 71 |
| 42 | 72 |
| 43 | 73 |
| 44 | 75 |
| 45 | 77 |
| 46 | 78 |
| 47 | 80 |
| 48 | 80 |
| 49 | 79 |
| 50 | 75 |
| 51 | 70 |
| 52 | 65 |
| 53 | 60 |
| 54 | 55 |
| 55 | 50 |
| 56 | 45 |
| 57 | 40 |
| 58 | 30 |
| 59 | 20 |
| 60 | 35 |
| 61 | 50 |
| 62 | 55 |
| 63 | 60 |
| 64 | 50 |
| 65 | 40 |
| 66 | 40 |
| 67 | 41 |
| 68 | 42 |
| 69 | 43 |
| 70 | 44 |
| 71 | 45 |
| 72 | 46 |
| 73 | 47 |
| 74 | 48 |
| 75 | 49 |
| 76 | 50 |
| 77 | 40 |
| 78 | 35 |
| 79 | 30 |
| 80 | 35 |
| 81 | 36 |
| 82 | 37 |
| 83 | 40 |
| 84 | 43 |
| 85 | 47 |
| 86 | 55 |
| 87 | 60 |
| 88 | 63 |
| 89 | 66 |
| 90 | 69 |
| 91 | 72 |
| 92 | 75 |
| 93 | 80 |
| 94 | 60 |
| 95 | 50 |
| 96 | 40 |
| 97 | 30 |
| 98 | 20 |
| 99 | 10 |
| 100 | 0 |
shown in below after seeing plot the graph below like this
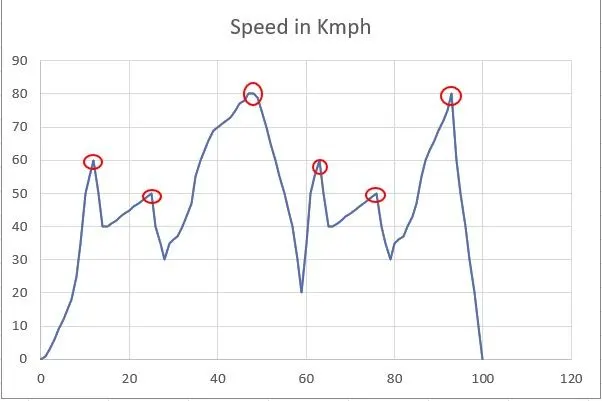
figuare shows the plotted graph of drive cycle. from the graph we can see that braking instances as highlighted.
here we showing the vehicle weight configurations see that
| Vehicle weight - 1000kg | |||||||||
| No. of Braking | Initial velocity (kmph) | Initial Velocity (m/s) | Final velocity (kmph) | Final Velocity (m/s) | Time required (s) | Deceleration (m/s^2) | Energy required (J) | ||
| 1 | 60 | 16.68 | 40 | 11.12 | 3 | 1.853 | 15456.8 | ||
| 2 | 50 | 13.9 | 30 | 8.34 | 3 | 1.853 | 15456.8 | ||
| 3 | 80 | 22.24 | 20 | 5.56 | 11 | 1.516 | 139111.2 | ||
| 4 | 60 | 16.68 | 40 | 11.12 | 3 | 1.853 | 15456.8 | ||
| 5 | 50 | 13.9 | 30 | 8.34 | 3 | 1.853 | 15456.8 | ||
| 6 | 80 | 22.24 | 0 | 0 | 7 | 3.177 | 247308.8 | ||
| 448247.2 | 448.25 | Energy required in KJ |
xxxxxxxxxxxxxxxxxxxxxxxxxxxxxxxxxxxxxxxxxxxxxxxxxxxxxxxxxxxxxxxxxxxxxxxxxxxxxxxxxxxxxxxxxxxxxxxxxxxxxxxxxxxxxxxxxxxxxxxxx
Question 2: Why electric motor can’t develop braking torque at high speed similar to starting? How electric and mechanical brakes are coordinated?
Solution:
- The speed-torque curves obtained by the reversal of the phase sequence of the motor terminal voltages are also shown by dotted lines. With a positive sequence voltage across the motor terminals, the operation above synchronous speed gives the regenerative braking operation (portion BAE). Similarly, with a negative sequence voltage across the motor terminals, regenerative braking is obtained for speeds above the synchronous speed in the reverse direction (portion bae). In regenerative braking, the motor works as an induction generator, converting mechanical energy supplied by the load to electrical energy, which is fed to the source. Thus the generated energy is usefully employed.
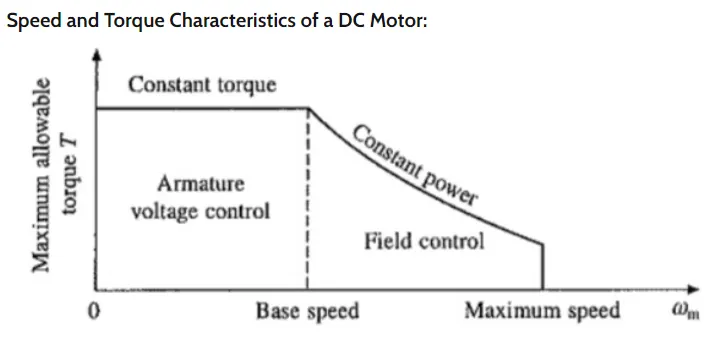
- When we press the brake pedal, we cut off the power supply to the motor and now the motor will be in the rotation due to it inertia. As this rotation is happening inside the magnetic field a Back Emf is generated which produces a negative Torque and that used as the brakes to reduce the vehicle speed. Also the current flows in the reverse direction, Using a Bi-directional Inverter we can store the current back into the battery.
- During the initial low speed, the Torque is high which is the constant Torque region. As speed builds up, after the Critical spee point the torque gradually decreases which is known as the constant Power region.So during high speeds, the motor will be at constant power region, and while braking, due to the high speed of the motor the negative Torque produced will be less.
- But while starting the motor, the speed will be very less and at this stage, the motor will be operating in a constant Torque region and most of the torque is used to increase the kinetical energy of the load (and motor). But when the speed is already high and no extra load is applied it is not possible to increase the torque.
- There are other reasons like Battery Limitations due to which we cannot get High braking torque also the rate of discharge is always higher than the rate of charging due to the battery's chemical compositions.
Electric and mechanical brakes co-ordination :
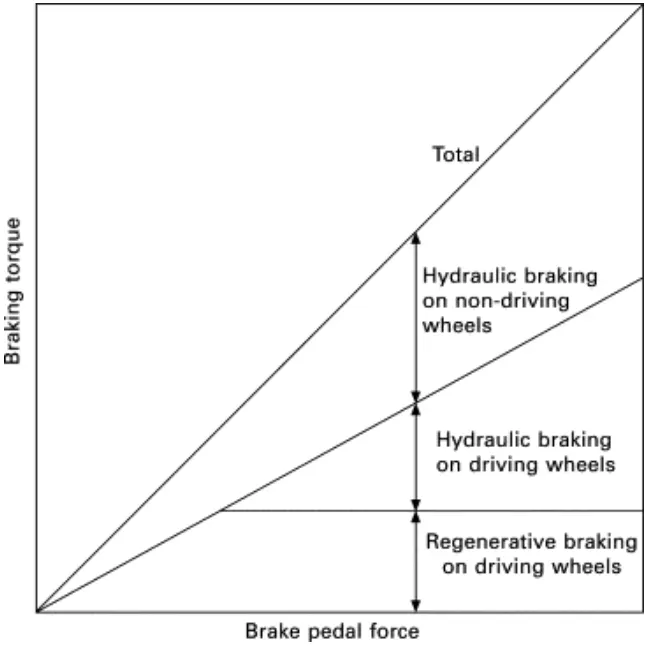
The braking stability of electric vehicles with electro-hydraulic hybrid braking systems can be influenced by braking force distribution between hydraulic braking force and regenerative braking force
Electric cars have regenerative braking and this does substantially reduce the need for hydraulic braking. But there are some limitations like the maximum deceleration with the engine alone is far smaller than with brake assistance So you still need an ordinary Fractional brake system to make the car stop instantly if required. * When the regenerative capacity is less than the actual braking required, mechanical brakes are applied at those times.
- During low brake pedal force, only the regenerative braking torque is applied on the driving wheels and is proportional to the pedal pressing force. The braking torque on the non-driving wheels is always due to hydraulic braking which is also proportional to the pedal pressing force.
- When the pedal force is beyond a certain limit, the maximum regenerative braking torque is applied on the driving wheels, and the hydraulic braking torque is simultaneously applied on the driving wheels to top up the desired braking torque. Meanwhile, the maximum regenerative braking torque is kept constant to fully recover the kinetic energy
There are two ways of applying the combination of brakes and they are classified as,
- Series - Regenerative braking and Frictional braking are applied one after another
Serial regenerative braking is basically based on the combination of friction-based adjustable braking system that transfers energ to the electric motors and batteries under an integrated control strategy. The overall design of serial regenerative braking is to estimate the deceleration required and distribute the required braking force between the regenerative braking system and the mechanical braking system. The serial braking system requires brake by wire system and has a more consistent pedal feel due to good torque blending capability. It can increase the efficiency by 15-30%.
2. Parallell - Regenerative braking and Frictional braking are applied at the same time . A parallel braking system is basically based on the combination of a friction-based system and the regenerative braking system operated in tandem without an integrated control. The regenerative braking force is calculated from the brake control unit b comparing the requested brake torque and the motor torque available. A parallel regenerative braking system requires more work in achieving good torque blending. This system can increase the efficiency by 9-18%.
One of the classic examples of coordination of these two brakes in the EDIIB, which is Electric Driven Intelligent Braking develop for the NISSAN leaf
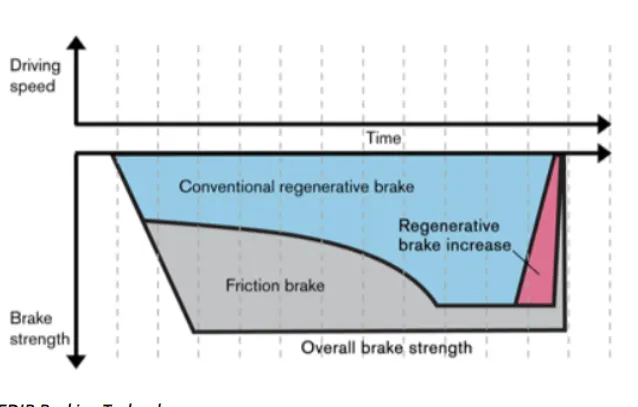
We see that both the Regenerative Brakes and the Frictional brakes are applied at the same time. After braking the speed reduces from higher speed values and at this moment the % of the composition of the combined braking changes. So after brake application, the speed is reduced to low speeds. Here Torque will be high and the motor will be operating in a constant Torque region. Now at this point, the % of Frictional brake application is reduced and Regenerative Braking is Increased because at this point more Negative Torque can be generated and thus higher electric power generated out of this braking can also be fed back to the battery. Thus using this technology in Braking an electric driven vehicle certainly increases the stopping power and also contributes to higher efficiency figures.
xxxxxxxxxxxxxxxxxxxxxxxxxxxxxxxxxxxxxxxxxxxxxxxxxxxxxxxxxxxxxxxxxxxxxxxxxxxxxxxxxxxxxxxxxxxxxxxxxxxxxxxxxxxxx
Question 3: Make a MATLAB program which plots contour of given motor speed, torque and efficiency values. Attach the code as a .m file attach a screenshot of all the plots.
Solutions:
Copper loss-:I^2.Rwhere R is Armature resistance and torque is proportional to current, the copper loss can be considered as Kc*T^2 where Kc is to take care of resistance of brushes and also take care of flux and its effect.
Cu losses = Kc*T^2
Iron loss: Iron losses are nothing but magnetic losses, which is denoted by ki*w, where Ki factor is based in the magnetic field effect. For permanent magnets have constant magnetic field and this iron losses is based on the value of Ki and this are going to change according to the speed. At Various speed have different value of back EMF and that is going to affect the iron losses
Iron losses= Ki*w
Windage losses: This is mechanical or friction of windage losses. This is based on size of shape of motor and the amount of windage losses that the motor is going to experience.
Windage losses = kw*T^3
Total losses : The Total losse are considering the above four losses and denoted as,
Total losses= kc*T^2+Ki*w+kw*T^3
All motors are model as per the above equation of losses.
Conduction losses are assumed to be 20J
Matlab Code:
%motor charactersistcs
%speed_vs_torque_vs eficciency

clear all
close all
clc

w = linspace(0,1000);   %speed of the motor
t= linspace(0,250);     %torque

%Motor Losses
%for copper loss
k_c = 0.2;
%for iron loss
k_i = 0.008;
%for winding loss
k_w = 0.00001;
% constant loss
cl = 20;

% Making 2d matrix
[W,T] = meshgrid(w,t);

% Output power = torque*Speed
Out_power = (T.*W);
% Copper Loss
b = (T.^2)*k_c;
% Winding Loss
c = (W.^3)*k_w;
% Iron Loss
d = W*k_i;

%  Input Power
In_power = Out_power +b +c +d +cl;
% Efficiency
E= Out_power./In_power;
%Efiiciency levels for contour
e=[0.70,0.75,0.80,0.82,0.87,0.89,0.90,0.92];

%plotting the graph
%Creating Contour
[C,h]=contourf(T,W,E,e);
clabel(C,h,'labelspacing',300); % plotting the effeciency values and its scpacing
xlabel('Speed');
ylabel('Torque');
title('Motor speed,Torque and Efficiencies')
PLOT:
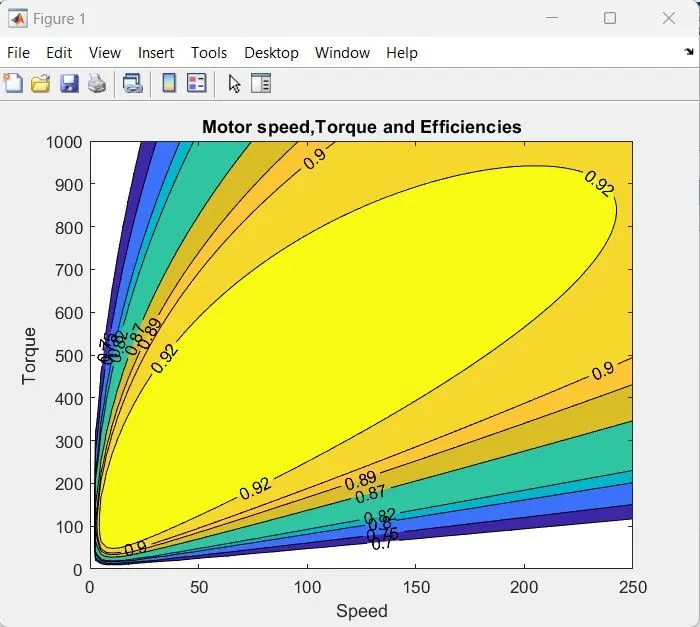
Finally we plot the contour with the 'contour' command. In addition, an array for the efficiency values we want to plot for is created called 'W' and is assigned for values ranging from an efficiency level of 0.75 to 0.95. This array is used in the creation of the contour. Axis labels and a title is also made for better readability.
From this contour plot, we can see that the highest level of efficiency arises in the innermost contour plot and this efficiency decreases as the contours increase in size from the innermost contour.
xxxxxxxxxxxxxxxxxxxxxxxxxxxxxxxxxxxxxxxxxxxxxxxxxxxxxxxxxxxxxxxxxxxxxxxxxxxxxxxxxxxxxxxxxxxxxxxxxxxxxxxxxxxxxxxxxxxxxxxxxxxxxxxxxxxxxx