Week-11 Challenge: Braking
1) For a defined driving cycle, calculate the energy required for braking.
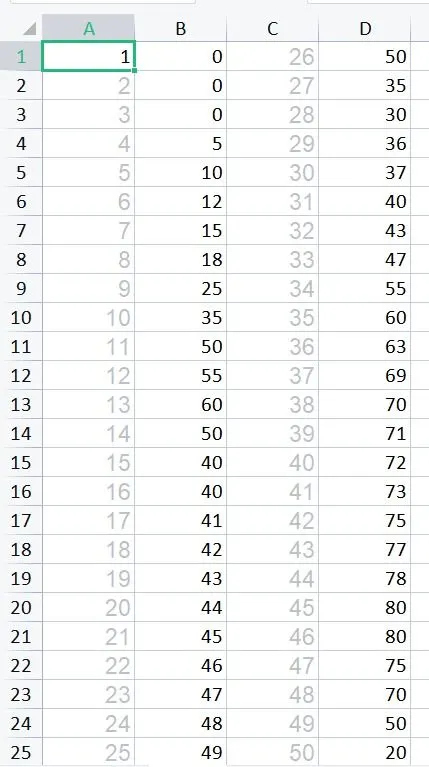
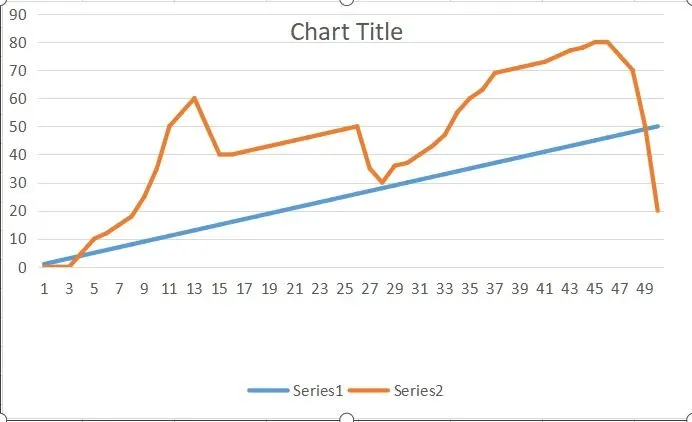
Driving Cycle: A driving cycle are a set of vehicle speed points versus time, it is used to calculate the fuel consumption of a vehicle, which is later on is compared with different vehicles. Main use of driving cycle are as follows:
- To assess the performance of a vehicle (fuel economy, emission tests)
- To analyze battery state and energy consumption in Electric Vehicles
- To simulate vehicle model prior to the actual development
Braking: Road vehicles involves the conversion of kinetic energy into thermal energy (heat). When stepping on the brakes, the driver commands a stopping force several times as powerful as the force that puts the car in motion and dissipates the associated kinetic energy as heat.
The process of braking follows the law of conservation of energy i.e. Energy cannot be created or destroyed it can only be converted into another form.
E(kinectic) = 1/2*m*v^2...
m = mass of the vehicle in Kg
v = velocity of the vehicle in m/s
E(kinectic) = Kinectic energy in KJ
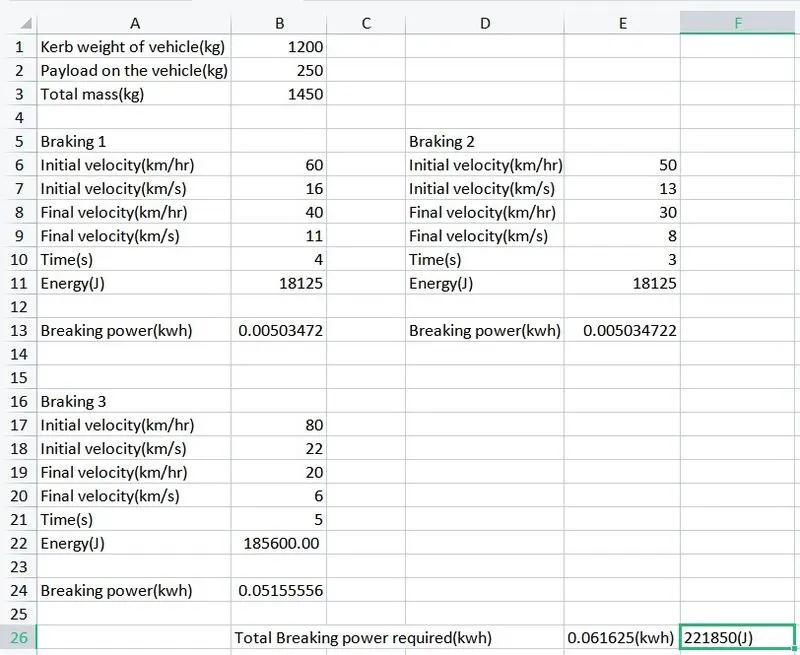
Breaking power calculation attached excel file for the calculation
2) Why electric motor can’t develop braking torque at high speed similar to starting? How electric and mechanical brakes are coordinated?
An electric motor requires a high current at starting to make a motor run which produces the high torque at the time of starting. The speed-torque characteristics of an electric motor show us that the torque of a motor will be high and constant for speed below critical speed whereas the torque starts reducing once it reaches the critical speed and maintains the constant power at high speeds, hence EV motors can't develop braking torque at high speeds.
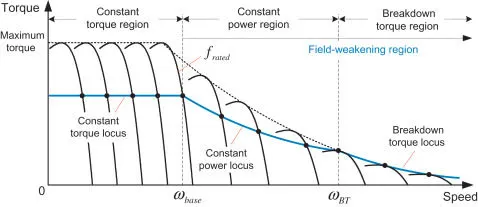
This situation occurs only when the vehicle is at high speeds because the motor will be running at the constant power region. In the constant power region, the torque of the motor reduces and so the motor cannot develop the braking torque which is equal to the torque that occurred during low speed at the constant torque range.
(i)Mechanical Braking: Mechanical brakes all act by generating frictional forces as two surfaces rub against each other. The stopping power or capacity of a brake depends largely on the surface area of frictional surfaces as well as on the actuation force applied. Mechanical brakes are assemblies consisting of mechanical elements for the slowing or stopping of shafts in equipment drives. They use levers or linkages to transmit force from one point to another. Braking slows or stops the movement of the coupled shafts. There are several types of mechanical brakes.
- Band brakes
- Drum brakes
- Disc brakes
(ii) Electrical Braking: Electric brakes are devices that use an electrical current or magnetic actuating force to slow or stop the motion of a rotating component. They are used in industrial and vehicular braking applications that require fast response times and precise tension control. The magnet in the backing plate has 2 conductor wires which tap directly into the wiring. When electricity is on, it magnetizes the brake magnet. The magnet is attracted to the drum face. When it contacts this area, the friction causes it to rotate, which moves the actuating arm, and pushes the shoes out against the drum. Those shoe have a special brake pad material on them that resists the heat caused by that friction. When the shoes press against the inside of the drum, they prevent the hub, and consequently the wheel that's touching the ground.
Two types of brake control strategies are used to organise the electrical brake and mechanical brake they are,
- Series control strategy
- Parallel control strategy
Electric driven intelligent brake (EDIB)
EDIB is a brake control strategy which is developed by NISSAN. It is a type of parallel braking which can be seen in the below image.
At low speed the torque of the motor is high and so the regenerative brake has a higher braking part than the frictional brakes.
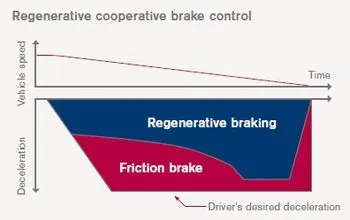
A very beautiful electric braking scheme called Regenerative Braking is now being employed for electric braking. Here during the braking action, the motor is operated as generator. As we know that during generating action, a counter torque is produced. So this counter torque opposes the motion of motor and motor comes to halt. Moreover, the brake energy is converted to electrical energy which can be fed back to the source using power converters.
3) Make a MATLAB program which plots contour of given motor speed, torque and efficiency values. Attach the code as a .m file attach a screenshot of all the plots.
Efficiency contour plot
Losses that occur in all types of Electric Motor:
1- copper loss - I^2 *R = Kc T^2
2- Iron loss = Kiw - mag.field
3- windage = KwW^3
4- constant = c
total
= Kct^2 + Kiw = KwW^3 + c
Matlab code for contour development
% A program for plotting efficiency contours for Elcteic motors
% The x axis corresponding to motor speed (w) and the y axis to torque T
%the x axis correspond to motor speed(w), and the y axis to torque T.
%irst , set up arrays for range

x = linspace(1,1000); %speed
y = linspace(1,300); %torque
%Allocate motor loss constant
kc = 0.2;
ki = 0.008;
kw = 0.00001;
ConL = 20; %for constant motor loss

[X,Y] = meshgrid(x,y);
outputpower = (X.*Y); %power=torque*speed
B = (Y.^2)*kc; %copper loss
C = X*ki; %iron loss
D = (X.^3)*kw; %windage loss

inputpower = outputpower+B+C+D+ConL;
Z = outputpower./inputpower; %efficiency
V = linspace(0.70,0.95,10);

%plotting
box off
grid off
contour(X,Y,Z,V);
title('Speed vs Torque');
xlabel('Speed(rad/s)');
ylabel('Torque(N.m)');
Code Explanation
-- All the values of Speed and Torque are inserted using linspace command in the form of array.
-- A 2D grid of the arrays are created using meshgrid command.
-- Various Motor losses and their coefficient are defined and stored.
-- Motor Losses are calculated:
- Copper Losses = Kc.T^2
- Iron Losses = Ki.W
- Windage Losses = Kw.W^3
-- Input and Output Power are calculated.
-- A contour is plot for the Torque Speed curves, efficiency is mapped using clabel command.
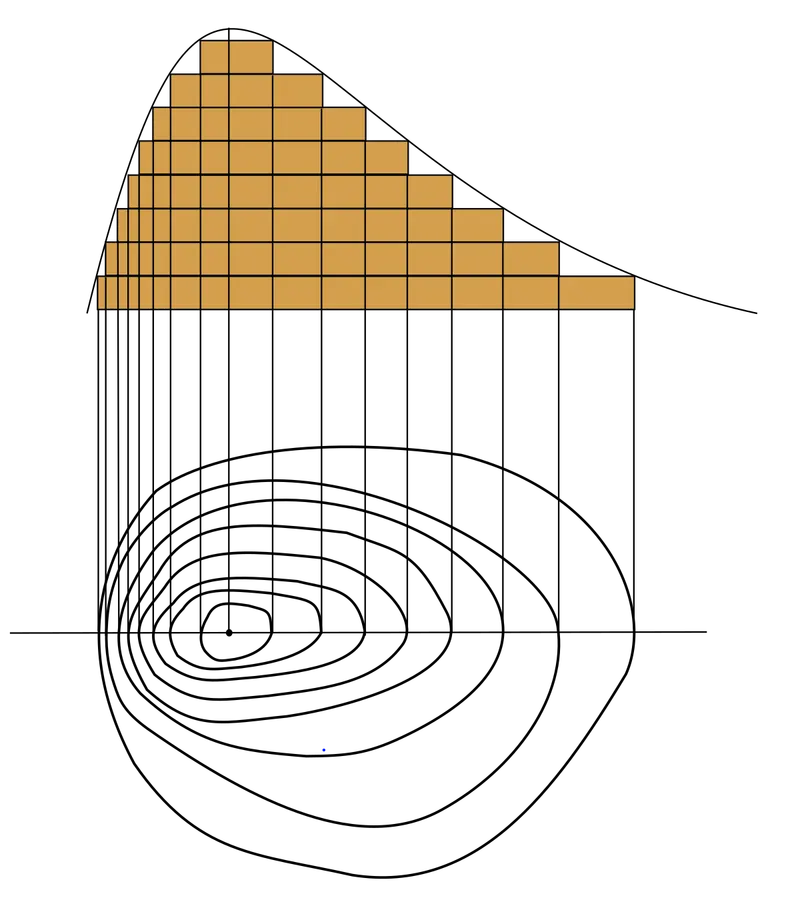
Output
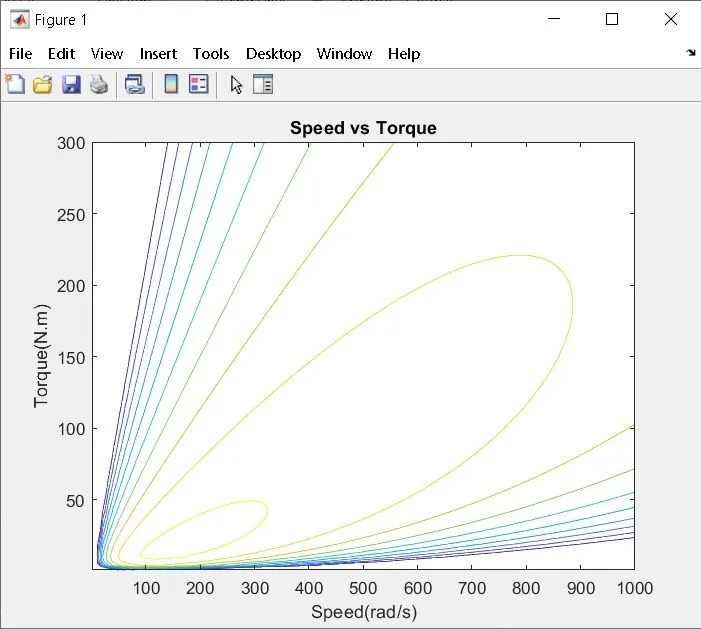
We can observe in the output results efficiency plotting for various efficiency values which where mentioned in the matlab code.