Week-11 Challenge: Braking
1. For a defined driving cycle, calculate the energy required for braking.
Ans:- Drive Cycle:-
- Drive cycle gives a plot between the speed of the vehicle & time.
- by using the drive cycle we can determine various information like as follows:-
- (A) We can determine the highest speed & lowest speed of the vehicle at some perticular time period.
- (B) We can determine the fuel economy or fuel consumption of the vehicle which is compared with other vehicles later on.
- (C) We can determine the carbon emmission rate of the vehicle.
Braking Energy:-
- We all know that we required some energy during acceleration of the vehicle.
- Like wise, we also required some amount of energy for braking operation.
- when the driver applies the brake padels, then a stopping force is applied to the tires which is several times more than the acceleration force.
- As we know, Law of conversation of energy states that Energy can neither created nor destroyed, it can only transferred fron one form to another.
- During braking operation,kinetic energy transferred as heat or thermal energy which helps to deaccelerate the vehicle.
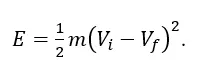
- The equation for braking energy is:-
 -----------------------(1)
Where,
- E is the braking energy
- m is the total mass of the vehicle.
- Vi is the initial velicity of vehicle in m/s
- Vf is the final velocity of vehicle in m/s
Simulink Model:-
- Create a drive cycle sheet in the Excel sheet.
- Now choose the correct directory path for the drive cycle.
- then double click on that excel sheet & choose all velocity w.r.t time.
- then choose the data type as Numeric Matrix.
- Then click on Import selection.
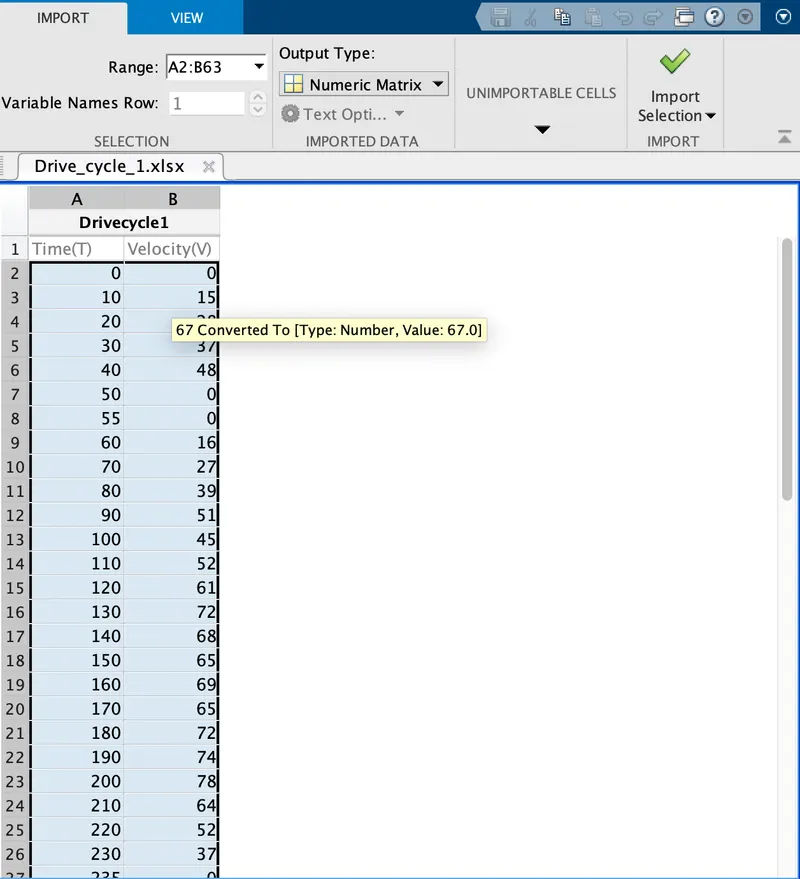
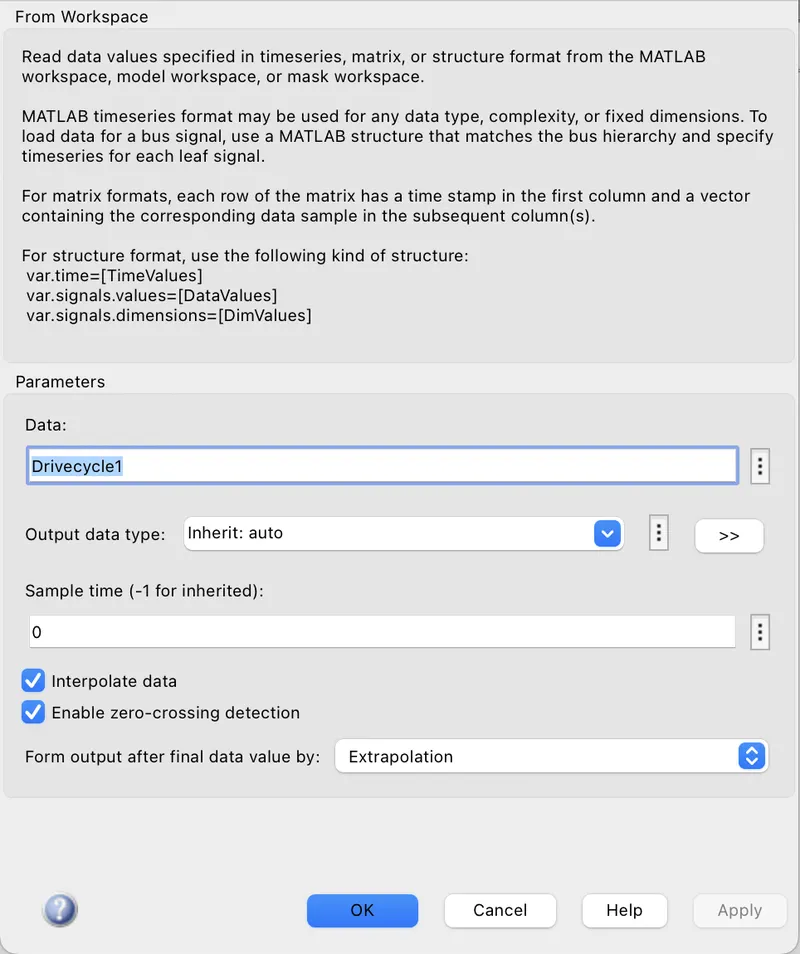
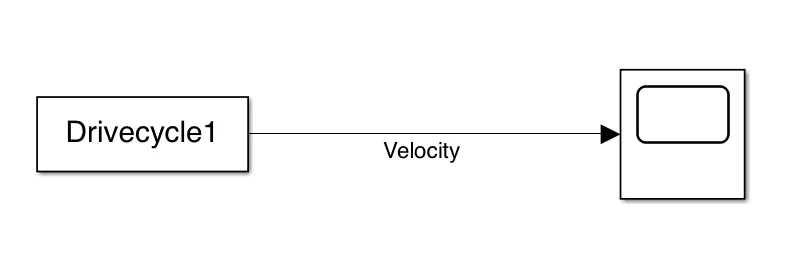
- Then create a new simulink page & take one "From Workspace" & one "Scope" block.
- Then double click on the from work space & choose the correct drive cycle data as available in the base workspace.
- Then connect these two blocks.
- then give the stop time as 600 sec & Run the model.
- Then we will get the following plot.
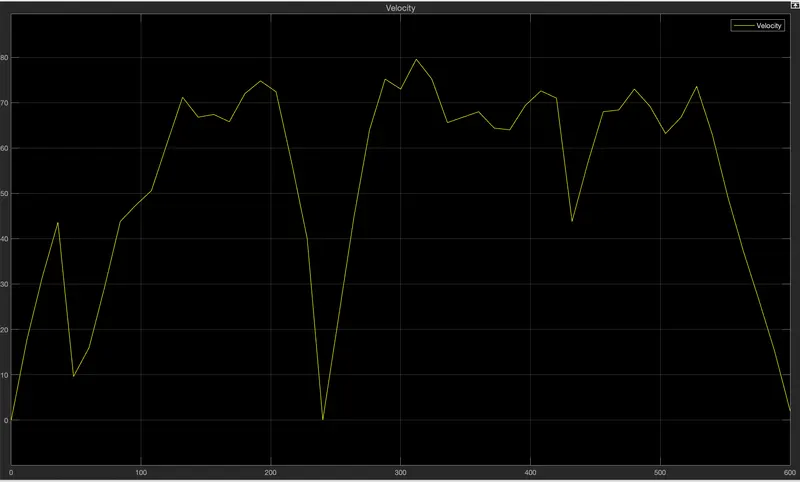
- From the above drive cycle graph, we can say that there are 27 no.of braking points, at where we have to calculate the braking energy by using the equation-1.
- so we have created an excel sheet for the calculation of braking energy at 27 braking points.
- Let's consider the Mass of the vehicle is 1600 kg (including pay load weight).
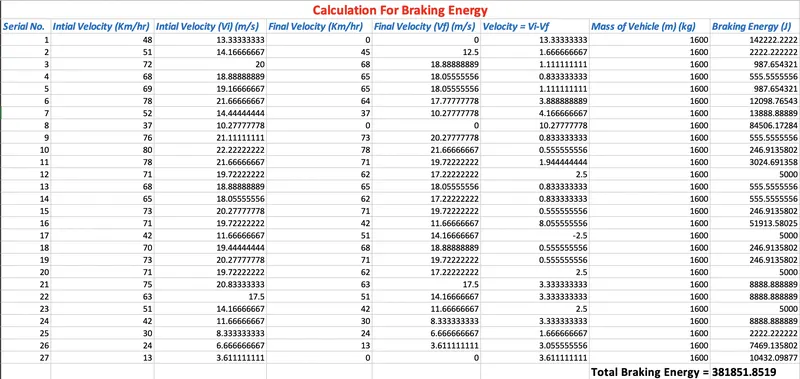
- Here the Total Braking energy required by the vehicle is 381851.8519 Joule or 381.851 kJ.
- For the given drive cycle, we have required 381.851 kJ of energy for braking operation.
2. Why electric motor can’t develop braking torque at high speed similar to starting? How electric and mechanical brakes are coordinated?
Ans:- If we analyse the Torque-speed characterstics of a motor which is shown in below.
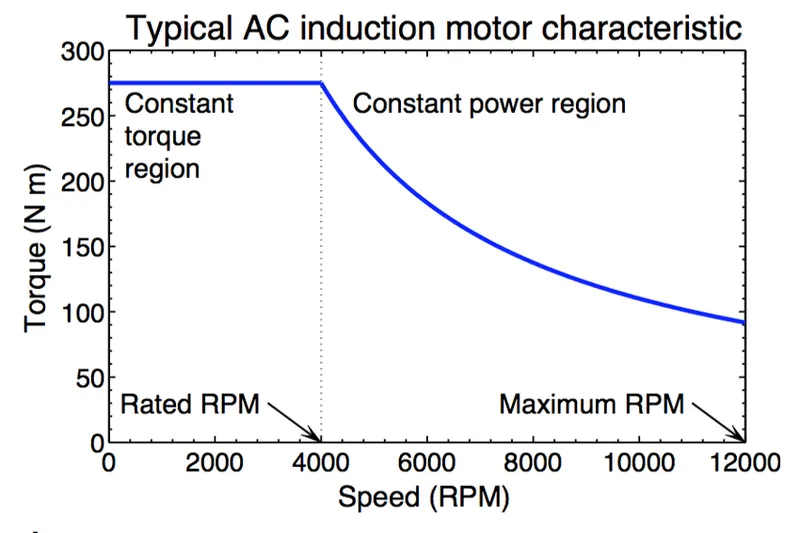
- From the above graph, we can clearly see that, during the starting of a vehicle means the vehicle is at low speed then the motor torque is very high till the motor speed reaches at critical speed (Rated RPM).this region is called as Constant torque region.
- then when the motor increases the speed after critical speed, then the Torque of motor starts decreasing. then after that power will be constant & torque decreases gradually.this region is called as Constant power region.
- so we can simply say that, Starting torque (Low speed) comes under Constant torque region & Braking torque (During higher speed) comes under Constant power region.
- So during higher speed of vehicle which comes under Constant power region, the torque of the motor is very very low as compared to Torque during the starting means the accelerating torque which comes under Constant torque region.
Braking Strategies:-
- There are two types of brakes are used in Electric vehicle domain such as Mechanical Braking & Electical Brakes.
- Electrical brakes are nothing but the Regenerative braking system which is used to convert the waste energy into electical energy (For storing purpose) by reversing the direction of current to motor which act as generator during RBS (Regenerative Braking System).
- There are certain limitation with RBS i.e. the electric motor is unable to provide all the brake torque necessary for large decelerations.
- Mechanical brake commonly uses the friction between two two surfaces (one is tyre & another is ground) by coverting the kinetic energy into heat which helps to slow down the vehicle speed & coming to rest.
- The friction between the surfaces is performed using pressurized air or pressurized oil which are commonly known as an air brake and hydraulic brake respectively.
There are two types of Braking strategies are used in Electrical vehicle such as:-
- Series Braking System
- Parallel Braking System
(A) Series Braking System:-
- In series braking system, Mechanical brakes are applied first during higher speed of the vehicle & then Regenerative braking system is applied when the speed of the vehicle will low.
- in these type of braking system, we have to apply one brake after another.
- Series Startegy could give an increase of 15-30% in fuel efficiency and has more consistent braking due to good torque blending capability.
(B) Parallel Braking System:-
- In parallel braking system, we have to apply both mechanical brakes & Regenerative brakes simulteneously at same time.
- The regenerative braking force is added with mechanical braking force which cann't be controlled.
- The regenerative braking force is calculated from the brake control unit by comparing the demanded brake torque and the motor torque available.
3. Make a MATLAB program which plots contour of given motor speed, torque and efficiency values. Attach the code as a .m file attach a screenshot of all the plots.
Ans:- According to the question, we have to make a MATLAB programme which plots contour of given motor speed, torque & efficiency values.
Programme:-
clear all;
clc
% SPEED ARRAY
w = linspace(0,1000);
% TORQUE ARRAY
T = linspace(0,300);
% LOSS COEFFICIENTS
kc = 0.18; % COPPER LOSSES
ki = 0.006; % IRON LOSSES
kw = 0.000015; % WINDAGE LOSSES
% MESHGRID
[X,Y] = meshgrid(w,T);
copper_loss = (Y.^2)*kc;
iron_loss = X*ki;
windage_loss = (X.^3)*kw;
K = 20;
output_power = X.*Y;
input_power = (copper_loss)+(iron_loss)+(windage_loss)+(output_power)+K;
Eff = (output_power)./(input_power);
n = linspace(0.7,0.95,10);
contourf(X,Y,Eff,n);
title('SPEED TORQUE CHARACTERISTICS')
xlabel('SPEED rad/s')
ylabel('TORQUE N-m')
Results:-
- When we run the above MATLAB code, then we will get a plot as follows:-
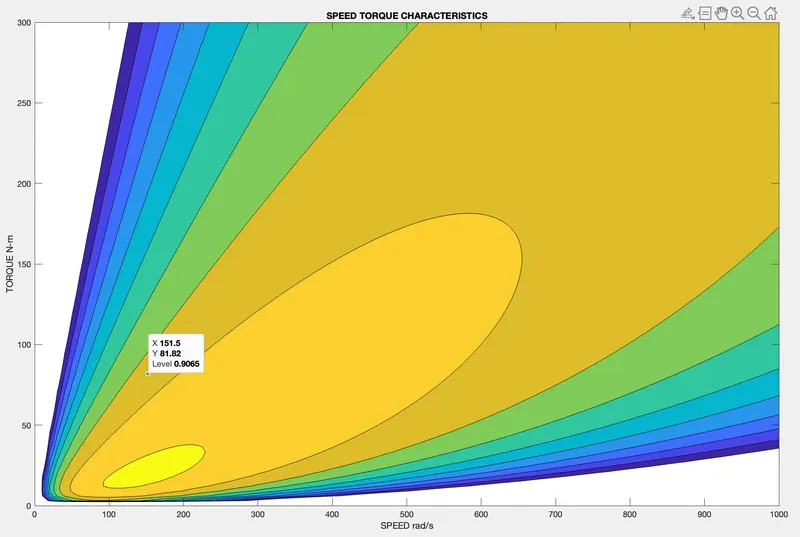

- The above plot gives information about Motor Speed, Motor Torque & Motor efficiency.
- X-axis represents the Speed of motor in Rad/sec & Y-axis represents the Torque of Motor in Nm respectively.
- from the plot we can say that when the speed of the vehicle increases then efficiency of motor decreases & vice-versa.
- At a perticular Motor torque (21.21 Nm) & Motor speed (161.6 Rad/sec), the efficiency of motor is very high about 98% (Dark Yellow) approximately.
- Motor efficiency reaches at 70% (Dark Blue) when the motor reaches at either maximum speed or maximum torque.
- So to get better Motor efficiency, Motor speed & Motor toruqe should be in some limit range.