Week-11 Challenge: Braking
OBJECTIVES
- For a defined driving cycle, calculate the energy required for braking.
- Why electric motor can’t develop braking torque at high speed similar to starting? How electric and mechanical brakes are coordinated?
- Make a MATLAB program which plots contour of given motor speed, torque and efficiency values?
AIM
1) Calculating the energy required for braking of UDDS Drive Cycle-
Driving Cycle: A driving cycle are a set of vehicle speed points versus time, it is used to calculate the fuel consumption of a vehicle, which is later on is compared with different vehicles. Main use of driving cycle are as follows:
- To assess the performance of a vehicle (fuel economy, emission tests)
- To analyze battery state and energy consumption in Electric Vehicles
- To simulate vehicle model prior to the actual development
Braking: Road vehicles involves the conversion of kinetic energy into thermal energy (heat). When stepping on the brakes, the driver commands a stopping force several times as powerful as the force that puts the car in motion and dissipates the associated kinetic energy as heat.
The process of braking follows the law of conservation of energy i.e. Energy cannot be created or destroyed it can only be converted into another form.
E(kinetic) = 1/2*m*v^2
where,
m = mass of the vehicle in Kg
v = velocity of the vehicle in m/s
E(kinetic) = Kinetic energy in KJ
In our case, velocity will be (V-Vi) where, V is the speed of the vehicle, Vi the speed of the vehicle which is slow down or brought down to rest.
Braking: Braking is a condition to slow down or stops a moving vehicle as required. There are several techniques to apply brakes, which can be mechanical or electrical. The most commonly used technique is by applying friction. It consumes energy. The consumed kinetic Energy can be derived as following equation-
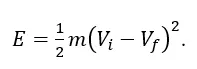
Where, Braking Energy is the kinetic energy in unit of Joule.
m= Total Mass of the Vehicle (Vehicle Mass + Pay Load) in unit of Kg.
v= (Initial Velocity-final Velocity) in unit m/s.
For Example, if Initial speed of a vehicle is 20m/s and final speed is 10m/s. The mass of the vehicle is 500kg. Then the required kinetic energy for Braking is (1/2) *500*(20-10) ^2 = 25000 J =25KJ
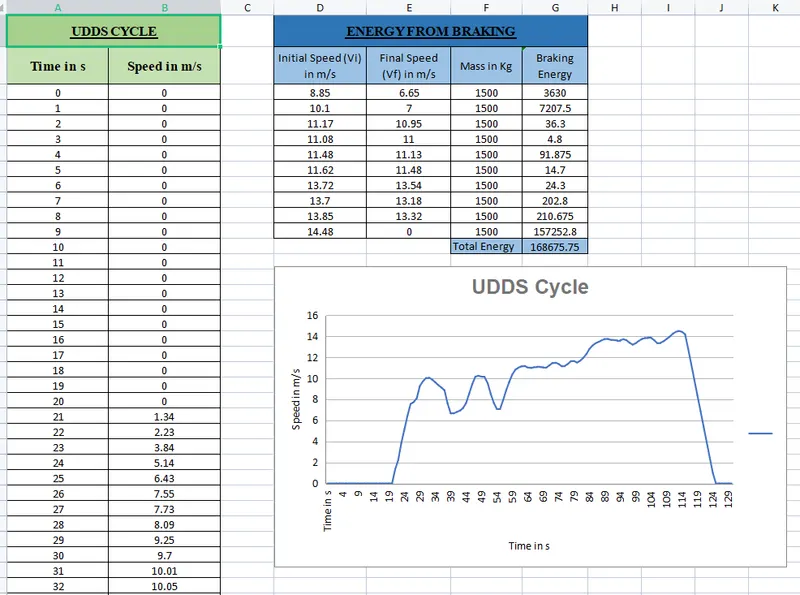
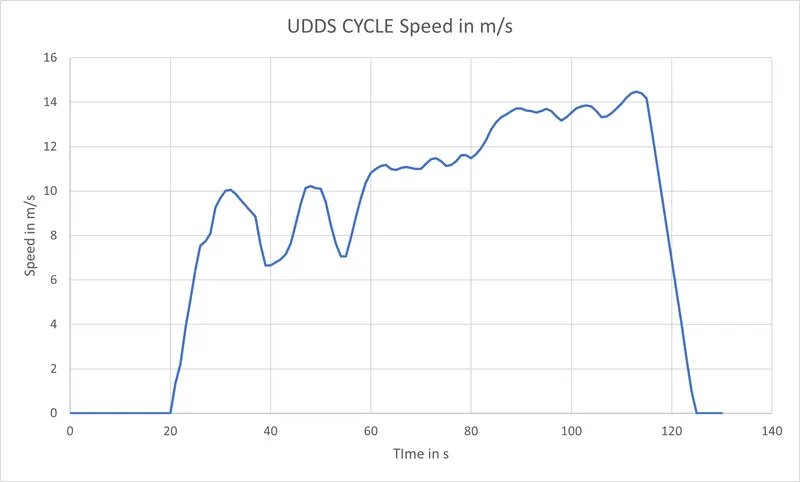
Here for a Drive cycle the required braking energy is calculated for each second of time to slow down or stop the vehicle- Braking Energy Calculation for UDDS Driving Cycle
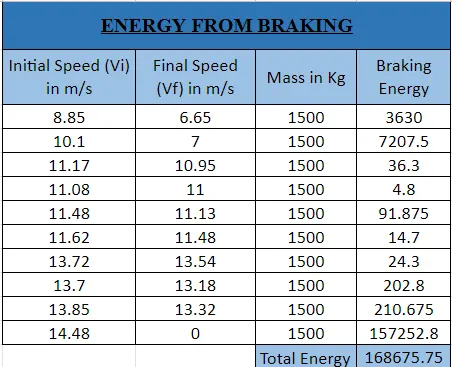
LINK SHOWS THE EXCEL SHEEET
https://docs.google.com/spreadsheets/d/1GRL3EbKjw2ZEqSRhGD8shqhbSIyW2EK5p_sTP7Dz-g4/edit?usp=sharing
2. WHY ELECTRIC MOTORS CANNOT DEVELOP BRAKING TORQUE AT HIGH SPEEDS. HOW ARE ELECTRIC AND MECHANICAL BRAKES CO-ORDINATED: -
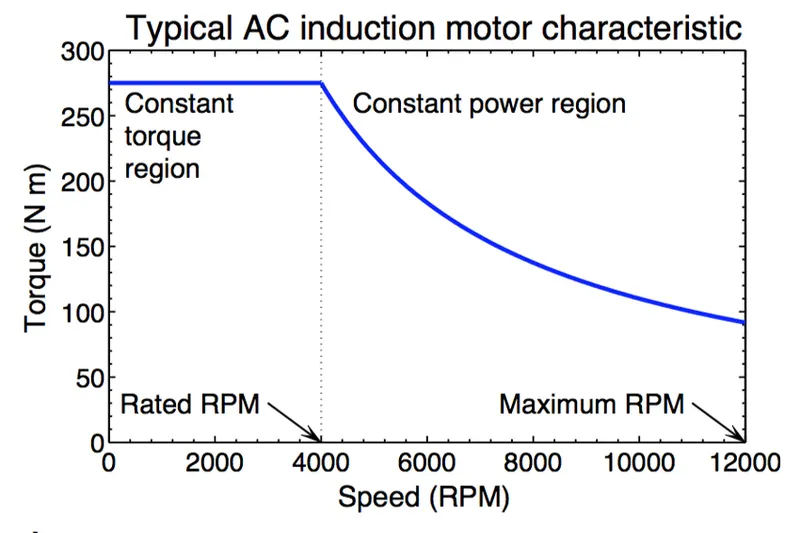
Let us consider the torque speed characteristics.
Why electric motor can’t develop braking torque at a high speed similar to starting? How electric and mechanical brakes are coordinated?
This situation occurs only when the vehicle is at high speeds because the motor will be running at the constant power region. In the constant power region, the torque of the motor reduces and so the motor cannot develop the braking torque which is equal to the torque that occurred during low speed at the constant torque range.
The torque vs speed plot of a vector control induction motor is given below.
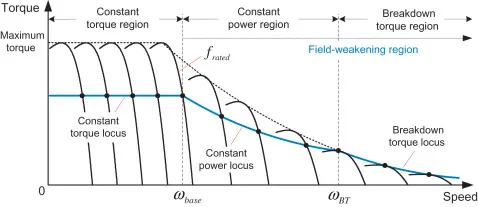
From the above characteristic curves of the motor. that is seen that the torque of the motor remains high at low speeds and reduces as the speed increases.
Since the electric motor cannot develop braking torque at a high speed similar to starting.
Electrical brake and mechanical brake.
Electrical braking
Electrical braking can be done by many methods such as,
- Unbalancing the input points of current to the motor.
- Using transistors in H-bridge arrangement to reverse the motor direction in order to reduce speed.
- Implementing a regenerative braking system by using bi-directional power converters.
- Regenerative braking converts much of the energy to electrical energy, which may be collected for later use.
Mechanical braking
Mechanical brakes commonly use friction between two surfaces pressed together to convert the kinetic energy of the moving object into heat, though other methods of energy conversion may be employed. The friction between the surfaces is performed using pressurized air or pressurized oil which are commonly known as an air brake and hydraulic brake respectively.
Coordination of electrical and mechanical braking in EV's
Two types of brake control strategies are used to organise the electrical brake and mechanical brake they are,
- Series control strategy
- Parallel control strategy
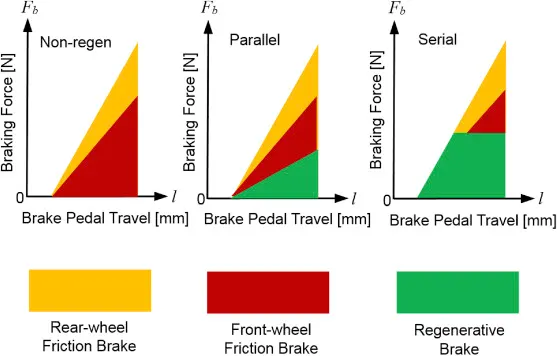
The comparison of the control strategies is shown in the below figure.
In the figure, it is seen that, according to the amount of brake pedal travel of the vehicle,
the mechanical brakes and regenerative brake are employed.
Parallel control strategy
When the brake is applied according to the brake pedal travel the front wheel friction brake, the rear wheel friction brakes and the regenerative brakes are employed simultaneously. The higher the travel of the brake pedal the higher the amount of braking will be done.
The braking energy is distributed in the following practice,
Rear-wheel friction brake ----> Front-wheel friction brake ----> Regenerative brake
Series control strategy
When the brake is applied according to the brake pedal travel the front wheel friction brake, the rear wheel friction brakes and the regenerative brakes are applied one after another. As the braking requirement increases the frictional brakes are used subsequently.
For low speeds of the vehicle, regenerative braking is used but it may be limited according to the SOC (state of charge) of the battery.
As the speed of the vehicle increases the rear wheel frictional brake will be employed if the braking requirement is not done but then the front wheel frictional brake is also used.
The coordination of the series control braking can be done with the choice to the comfort of braking (or) energy storage.
Electric driven intelligent brake (EDIB)
EDIB is a brake control strategy which is developed by NISSAN. It is a type of parallel braking which can be seen in the below image.
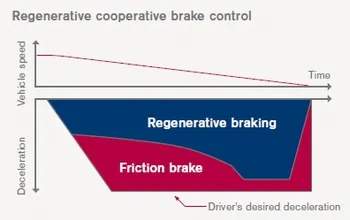
The above image shows that the frictional brake and the regenerative brake are used simultaneously at higher speeds of the vehicle.
At low speed the torque of the motor is high and so the regenerative brake has a higher braking part than the frictional brakes.
Brief working of EDIB
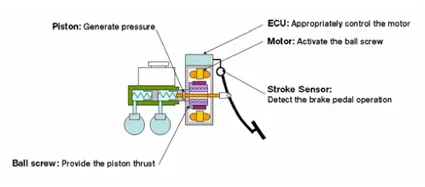
When the driver steps on the brake pedal, the stroke sensor detects the operation of the brake. That report is communicated to the ECU and controls the motor. The motor engages the piston through the ball screw and increases the friction brake's pressure (hydraulic pressure). Through optimum control of the friction brake's hydraulic pressure, the energy regeneration result is maximized.
From this curve we have two region, constant torque and constant power region. At the start the motor achieves peak torque till it reaches a certain motor speed range from where it will rapidly drop. The reason due to the drop in torque is due to the motor shaft reaching critical speed and the area where the peak torque is constant is known as the constant torque region of the motor. The region where the torque decreases is known as the constant power region as the power generated by the motor will be at its peak.
Since the torque produced at the constant power region is very low, it is not possible to develop enough braking torque in this region. The braking torque produced increases as the speed decreases.
The electric braking system used in EVs and HEVs is regenerative braking. This method uses the motor as a generator during braking, developing a retarding torque, which acts on the running motor and halts it. The kinetic energy and potential energy, minus the losses of the motor are returned to the mains and the motor runs at a constant speed. Thus, regenerative braking eliminates the tendency of the load to accelerate the motor.
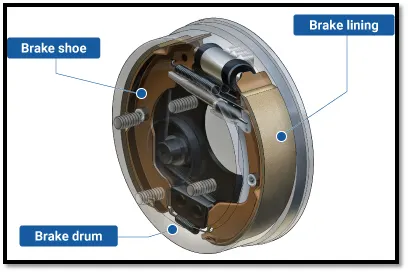
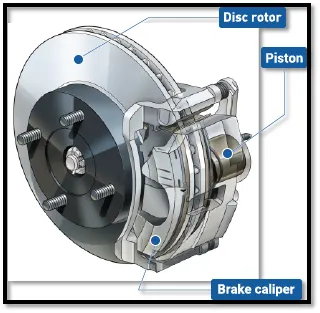
Mechanical braking systems used can be either disc or drum brake system. Where in case of a disc brake system friction pads rub against a disc when the brake pedal is applied and the kinetic energy is converted to heat and slows the vehicle down. In a drum brake system, a set of brake shoes which are the friction materials press against a drum.
Since the braking torque is very less at high speeds, mechanical brakes are applied to slow down the vehicle. As the motor reaches the constant torque region the regenerative braking system takes effect where the motor acts as a generator and the negative torque produced charges the battery pack. .. ...
DC motor Torque vs Speed Characteristic
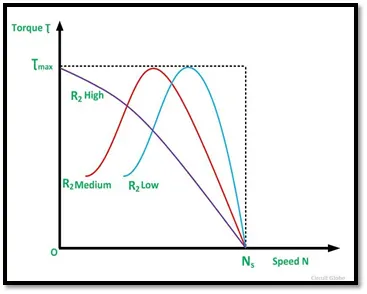
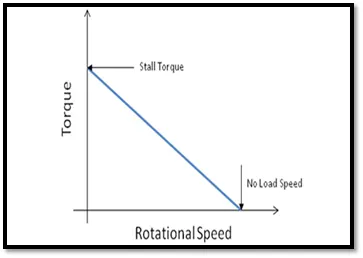
Here for both in case of AC or DC there is no torque at maximum speed, gradually the torque decreases at high speed as the speed tends to be maximum speed. This situation does not occur at the beginning of acceleration because most of the torque is used to increase the kinetic energy of the load (and motor). But when the speed is already high and no extra load is applied it is not possible to increase the torque as well as to develop braking torque. The braking operation happens in the motion which is been distributed as per proportion in the Brake Energy and the regenerative braking.
There are two types of braking:
(i)Mechanical Braking: Mechanical brakes all act by generating frictional forces as two surfaces rub against each other. The stopping power or capacity of a brake depends largely on the surface area of frictional surfaces as well as on the actuation force applied. Mechanical brakes are assemblies consisting of mechanical elements for the slowing or stopping of shafts in equipment drives. They use levers or linkages to transmit force from one point to another. Braking slows or stops the movement of the coupled shafts. There are several types of mechanical brakes.
1) Band brakes: These are the simplest brake configuration, have a metal band lined with heat and wear resistant friction material.
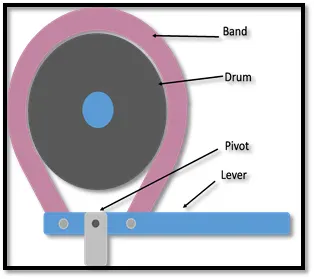
2) Drum brakes: These are commonly used on automobile rear wheels, work when shoes press against a spinning surface called a drum.
3) Disc brakes: These are constructed of brake pads, a calliper, and a rotor. During operation, the brake pads are squeezed against the rotor.
(ii) Electrical Braking: Electric brakes are devices that use an electrical current or magnetic actuating force to slow or stop the motion of a rotating component. They are used in industrial and vehicular braking applications that require fast response times and precise tension control. The magnet in the backing plate has 2 conductor wires which tap directly into the wiring. When electricity is on, it magnetizes the brake magnet. The magnet is attracted to the drum face. When it contacts this area, the friction causes it to rotate, which moves the actuating arm, and pushes the shoes out against the drum. Those shoes have a special brake pad material on them that resists the heat caused by that friction. When the shoes press against the inside of the drum, they prevent the hub, and consequently the wheel that's touching the ground.
A very beautiful electric braking scheme called Regenerative Braking is now being employed for electric braking. Here during the braking action, the motor is operated as generator. As we know that during generating action, a counter torque is produced. So this counter torque opposes the motion of motor and motor comes to halt. Moreover, the brake energy is converted to electrical energy which can be fed back to the source using power converters.
Electric and Mechanical brake coordination:
There are mainly 2 ways by which the Electric Vehicles could be braked:
- Series- Regenerative braking and mechanical braking both are applied one after another.
- Parallel- Regenerative braking and mechanical braking both are applied simultaneously.
When brake pedal is pressed the hydraulic fluid reaches the brake pistons and created the braking pressure on the wheels and the same kinetic energy is been used by the Regenerative Braking for generating more power using the Bi-directional motor which operates as a generator while braking.
3) Make a MATLAB program that plots the contour of given motor speed, torque and efficiency values. Attach the code as a .m file attach a screenshot of all the plots.
An efficiency map of an electric motor is a contour plot of torque and speed. It is used to describe the speed and torque combinations required at different efficiency ranges. In order to model the efficiency, contour we must consider the losses that occur in electric motors and these losses are,
- Iron or Core Losses: Iron losses are made of two components which are hysteresis and eddy currents. Hysteresis losses occur as we switch the electromagnets in our motor on and off, and depends on the magnetic properties of the iron material used in the motor. Eddy current losses depend on many variables, including the thickness of the laminations in the stator, the frequency at which the motor operates, the flux density and the material's resistivity. The iron losses are proportional to the square of the lamination thickness.
- Copper or Variable Losses: Copper losses are due to the resistance of the copper conductors and the current that we ask them to carry, and they lead to heating of the conductors. Of course, because copper is heavy, we want to use as little of it as possible, minimising cross-sectional area. This increases resistance and therefore increases losses and heating.
- Windage Losses: The loss caused by air friction between rotor and surrounding air is called windage losses. It occurs due to air resistance to the armature. Higher the speed of the motor more will be the windage losses.
Matlab Code:
clear all
close all
clc
% speed Array
omega= linspace(0,300,100);
% Torque Array
T = linspace(0,2000,100);
% meshgrid
[X,Y] = meshgrid(T, omega);

% Loss coefficients
cu = 0.17;                   % Copper coefficient
fe = 0.006;                  % Iron coefficient
win = 0.000015;              % Windage coefficient

% Losses
cu_loss = cu*(Y.^2);         % Copper Losses
fe_loss = fe*(X.^2);         % Iron Losses
win_loss = win*(X.^3);       % Windage Losses
cond_loss = 18;              % Conduction losses

% output power
p_out = (X.*Y);
% Input power
p_in = p_out +(cu_loss) +  ( fe_loss) + (win_loss) + (cond_loss);
% Efficiency
n = ((p_out)./(p_in));

% Efficiency Values for contour
W = linspace(0.75, 0.95,  10);
% Contour Plot
contour(X,Y,n,W)
xlabel('Angular Speed,rad/s')
ylabel('Torque,Nm')
title('Speed, Torque and Efficiency characteristics of motor') 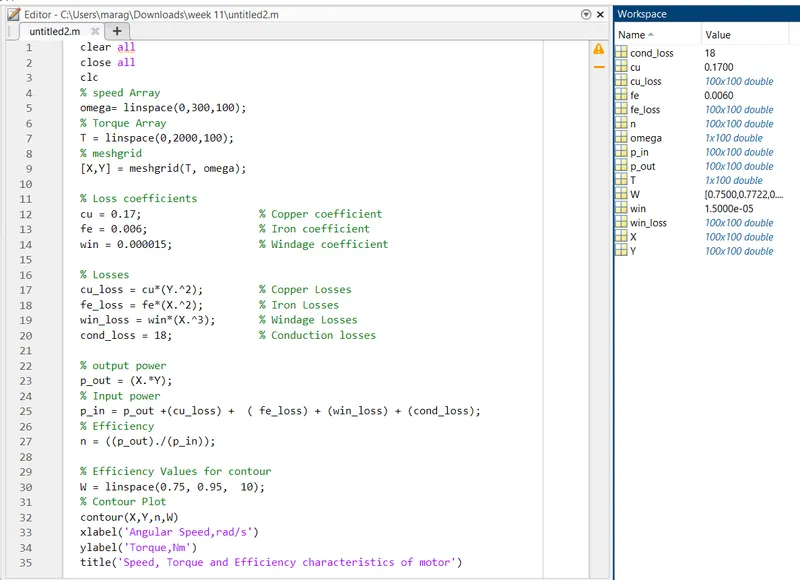
Explanation:
In this MATLAB script, we create arrays for the speed and the torque of the motor using the ‘Lin space’ command. For the speed, consider a range of values from 0 to 2000 radians per second whereas for the torque, consider a range of values from 0 to 300Nm.These arrays are then used to create 2D grid coordinates using the ‘Mesh grid’ command. These coordinates will help in the creation of the contour plot. In order to find the efficiency of the motor, we need to consider the various losses that occur in the motor’s operation. These are:
Copper losses
Iron losses
Windage losses
Conduction losses
These various losses are dependent on the speed and the torque of the motor. They each also have a characteristic constant of proportionality which are all assumed for the following calculations and represented as 'K'. In each calculation, the speed and the torque are represented respectively as: ω and T.
Copper losses = KCu⋅ω2
Iron losses =KFe⋅T2
Windage losses =Kw⋅T3
The values of coefficients are taken as general values. Conduction losses are assumed to be 18 Joules.
Finally, we plot the contour with the 'contour' command. In addition, an array for the efficiency values we want to plot for is created called 'W' and is assigned for values ranging from an efficiency level of 0.75 to 0.95. This array is used in the creation of the contour. Axis labels and a title is also made for better readability.
Explanation of the code,
- First the clear all, close all and clc commands are written to clear all variables in workspace, to clear all plots and to clear the workspace respectively.
- The speed and torque are defined as 2-Dimensional linearly spaced arrays using the Lin space command.
- The constants of the motor losses are defined.
- The 2-D arrays of the speed and torque are then defined as 3-Dimensional arrays using the Mesh grid command.
- The output power equation is defined as the product of speed and torque.
- The equations of the motor losses based on the speed and torque are defined.
- The input power is defined as the sum of output power plus motor losses.
- The efficiency is then defined as the ratio of output power to input power.
- In order to map the contour for different efficiency ranges an array is defined which consists of the efficiencies from 0.7 to 0.93.
- The graph is plotted using the contour command to plot the speed, torque, and efficiency.
The contour plot of the above MATLAB program is given below,
From the plot it can be observed that the speed and torque vary as the efficiency increases. This is due to the motor losses that occur. The dark blue line represents the contour 70% efficiency and the bright yellow line represents the contour 93% efficiency.
For example, at 70% efficiency, the torque reaches its peak value of 250 N-m when the vehicle is a very low speed but the torque decreases significantly as the speed increases for the same efficiency. And at a motor efficiency of 93% the speed and torque required is much less compared to an efficiency of 70%.
Greater the motor efficiency, lower speed-torque combination is required to overcome the motor losses.
OUTPUT :
https://drive.google.com/file/d/1UfPRwFSDH0du2NATd_wsqiQzg0le1f_J/view?usp=sharing
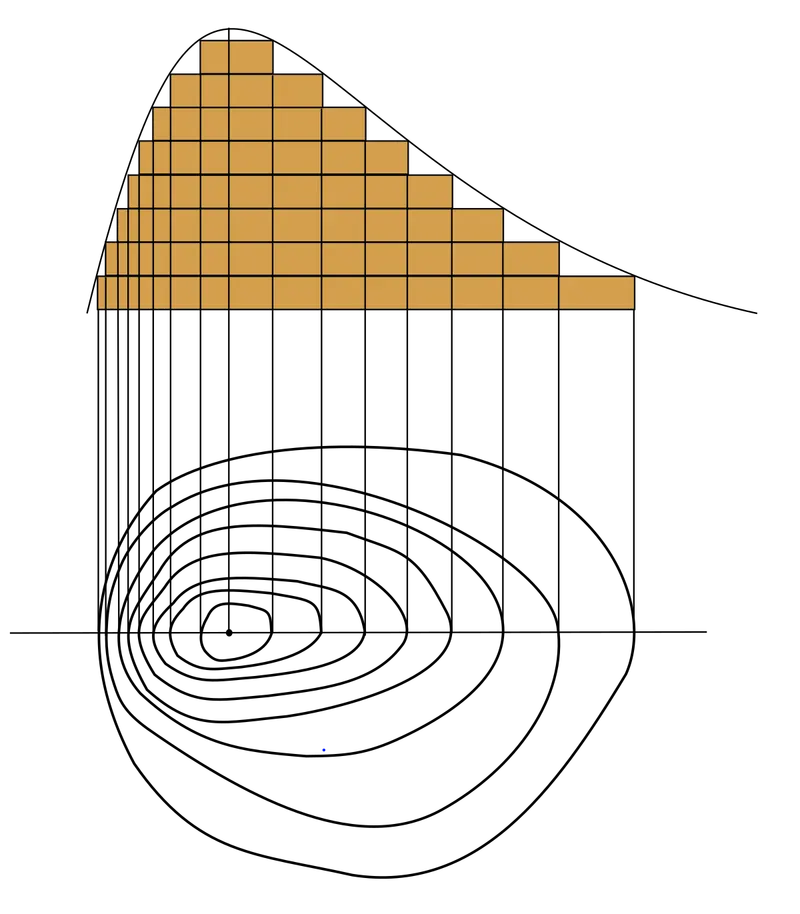
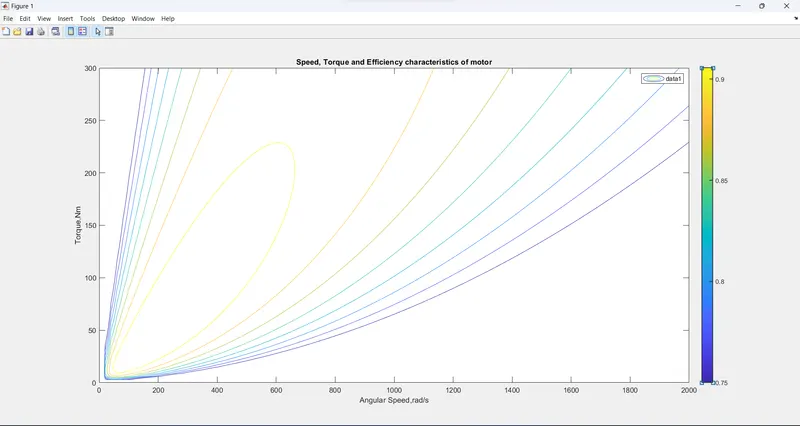
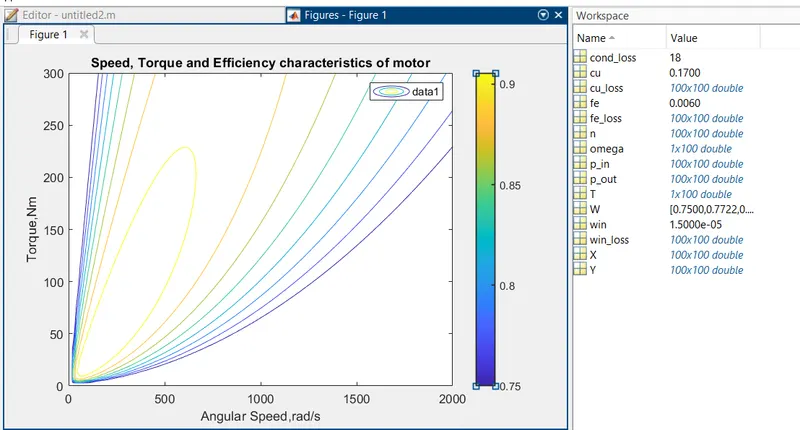
From this contour plot, we can see that the highest level of efficiency arises in the innermost contour plot and this efficiency decreases as the contours increase in size from the innermost contour.
CONCLUSION:-
Contour Plot: Contour plots is the way to show a three-dimensional(3-D) surface in the two-dimensional(2-D) plane. It graphs two predictor variables X Y on the y-axis and a response variable Z as contours.
In our simulation we can observe the X-axis as the Speed(rad/s) and Y-axis as the Torque(N-m).
- The energy required for braking of a vehicle based on a drive cycle is calculated.
- The co-ordination between electric brakes and mechanical brakes and why braking torque is less at high speed are explained.
- The MATLAB program to plot the speed, torque and efficiencies contour is written and the graph is plotted.