Week-11 Challenge: Braking
AIM:
1. For a defined driving cycle, calculate the energy required for braking.
2. Why electric motor can’t develop braking torque at high speed similar to starting? How electric and mechanical brakes are coordinated?
3. Make a MATLAB program which plots contour of given motor speed, torque and efficiency values. Attach the code as a .m file attach a screenshot of all the plots.
1. For a defined driving cycle, calculate the energy required for braking.
Braking:
Braking is a condition to slow down or stops a moving vehicle as required. There are several techniques to apply brakes, which can be mechanical or electrical. The most commonly used technique is by applying friction. It consumes energy .The consumed kinetic Energy can be derived as following equation
Energy = 1/2 m*v^2
Where,
Braking Energy is the kinetic energy in unit of Joule.
m= Total Mass of the Vehicle
v= Velocity.
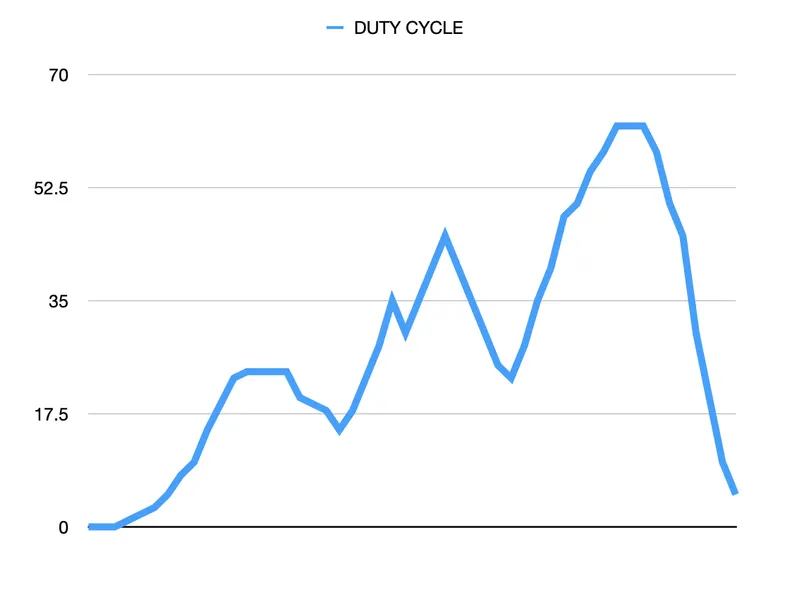
For Example if Initial speed of a vehicle is 20m/s and final speed is 10m/s. The mass of the vehicle is 500kg.
Energy = (1/2)*500*(20-10)^2
= 25000 J
=25KJ
2. Why electric motor can’t develop braking torque at high speed similar to starting? How electric and mechanical brakes are coordinated?
Electric Braking:
Electric brakes are devices that use an electrical current or magnetic actuating force to slow or stop the motion of a rotating component. They are used in industrial and vehicular braking applications that require fast response times and precise tension control. The magnet in the backing plate has 2 conductor wires which tap directly into the wiring. When electricity is on, it magnetizes the brake magnet. The magnet is attracted to the drum face. When it contacts this area, the friction causes it to rotate, which moves the actuating arm, and pushes the shoes out against the drum. Those shoe have a special brake pad material on them that resists the heat caused by that friction. When the shoes press against the inside of the drum, they prevent the hub, and consequently the wheel that's touching the ground.
Machanical Braking:
In mechanical braking, the frictional force between the rotating parts and the brake drums produces the required braking. To achieve this, mechanical equipment, such as brake linings and brake drums, are required. Whether electrical or mechanical, the braking of the drive should stop the motor at the specified point of time and position.
Electric and Mechanical brake coordination:
The electric braking system used in EVs and HEVs is regenerative braking. This method uses the motor as a generator during braking, developing a retarding torque, which acts on the running motor and halts it. The kinetic energy and potential energy, minus the losses of the motor are returned to the mains and the motor runs at a constant speed. Thus, regenerative braking eliminates the tendency of the load to accelerate the motor.
There are mainly 2 ways by which the Electric Vehicles could be braked: Series and Parallel.
Series
Regenerative braking and mechanical braking both are applied one after another.
Parallel
Regenerative braking and mechanical braking both are applied simultaneously.
When brake pedal is pressed the hydraulic fluid reaches the brake pistons and created the braking pressure on the wheels and the same kinetic energy is been used by the Regenerative Braking for generating more power using the Bi-directional motor which operates as a generator while braking.
3. Make a MATLAB program which plots contour of given motor speed, torque and efficiency values. Attach the code as a .m file attach a screenshot of all the plots.
Efficiency map of an electric motor is a contour plot of torque and speed. It is used to describe the speed and torque combinations required at different efficiency ranges. In order to model the efficiency contour we must consider the losses that occur in electric motors and these losses are,
Iron loss
Copper or Variable Losses:
Windage Losses
Based on these 3 losses the MATLAB program to plot the efficiency contour is written below.
x=linspace(1,1000);
y=linspace(1,250);
Kc=0.2;
Ki=0.008;
Kw=0.00001;
ConL=20;
[X,Y]=meshgrid(x,y);
outputpower=(X.*Y);
B=(Y.^2)*Kc;
C=(X.*Ki);
D=((X.^3)*Kw);
inputpower=outputpower+B+C+D+ConL;
Z=outputpower./inputpower;
V=[0.70,0.80,0.85,0.90,0.91,0.92,0.925,0.93];
box off
grid off
contourf(X,Y,Z,V);
colorbar
title('Efficiency contour');
xlabel('Speed in rad/s');
ylabel('Torque Nm');
hold on;
V=[8000,10000];
contour(X,Y,outputpower,V);
OUTPUT
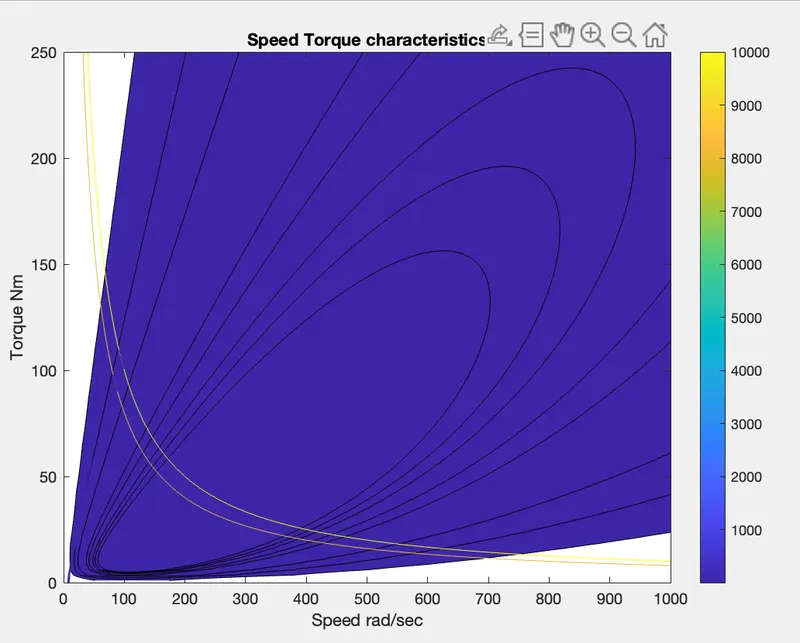
From this contour plot, we can see that the highest level of efficiency arises in the innermost contour plot and this efficiency decreases as the contours increase in size from the innermost contour.