Project
AIM
To prepare a report regarding to the simulation of BAJA ALL terrain vehicle (ATV) under the differnt condition.
OBJECTIVE
Carry out a system-level simulation of an all-terrain vehicle. Prepare a technical report explaining the model properties & comments on the results.
Here we have the 4 cases based on the each simaltion.
1 The cases is defined as with "CVT" and with "CVT using dashboard".
2 The other case is of "CVT with variable lookuptabel" and "CVT with variable lookuptabel and dashboard"
FROM THE FIRST STUDY.
Case1;
Simulation with CVT:
The important component in this model are;
1. Continuosly variable transmittion
2.Engine
3.Variable transmittion ratio
4.Vehicle body
5.Generic engine
6.Engine sensor
7.Simple gear
* Continuosly variable transmittion:
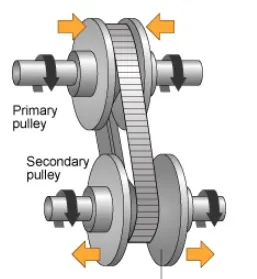
It is an automatic trasnmission that can change seamlessly through a continuous range of gear ratio. This contrasts with other transmissions that provide a limited number of gear ratios in fixed steps. The flexibility of a CVT with suitable control may allow the engine to operate at a constant RPM while the vehicle moves at varying speeds. One pulley in the CVT is connected to the engine and the other directs power to the wheels. The width of these pulleys changes based on the needed power as one gets larger, the other gets smaller. This allow the belt to ride lower and higher along with the wall of the pully depending on the driving condition thereby change the gear ratio.
* Engine:
The generic engine block represent a general internal combustion engine. This block is a suitable generic engine for spark the ignition and diesel. Connection F and B are mechanical rotational conserving ports associated with the engine crankshaft and engine block.
* Variable transmission:
Reprasent a gearbox that dynamically transfer motion and torque between the two connected driveshaft axes the base and the follower. Here connection B is the base anf F is follower.
INPUT SIGNAL
Here we are giving input as Throttle and Brake
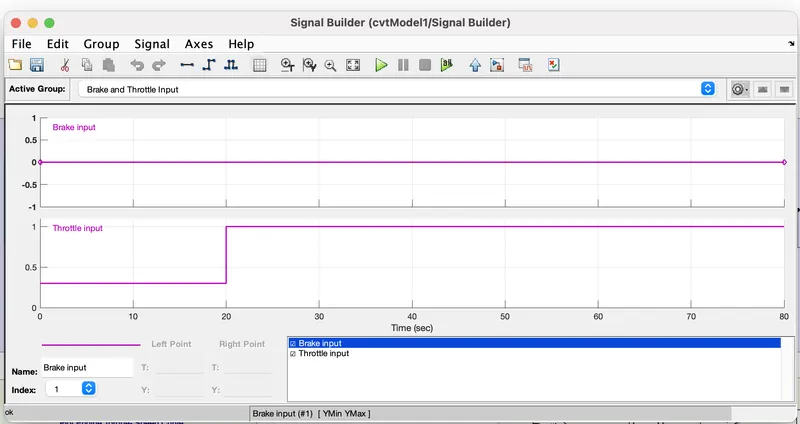
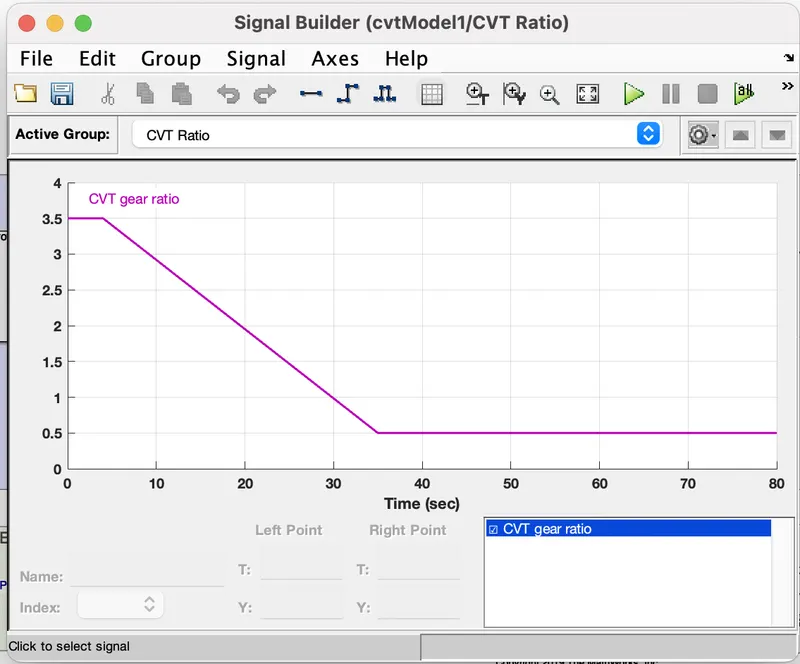
INPUT CVT GEAR RATIO:
RESULT:
Vehicle speed;
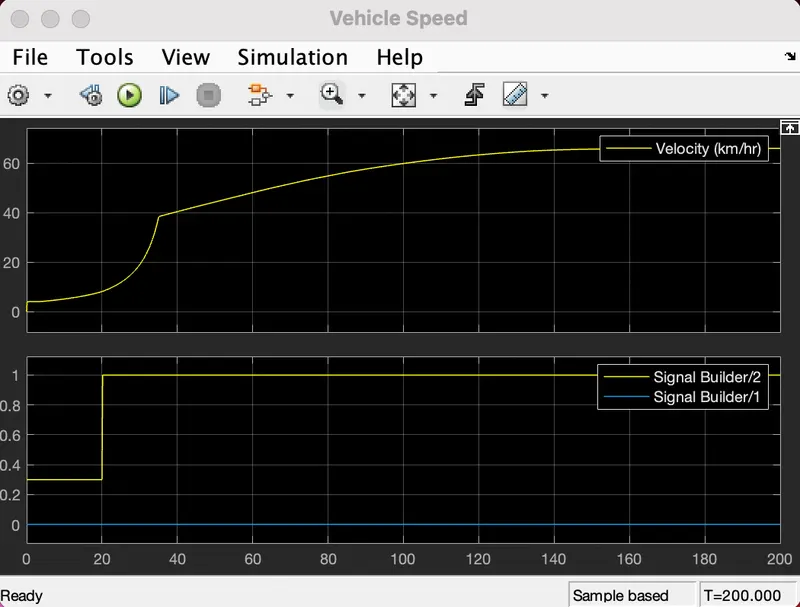
Now its clear that from the graph vehicle attain the maximum speed of 65km/hr at the trottle 1. After 30 sec vehicle speed gradully increasing from 40-65km/hr.
CVT shaft rpm;
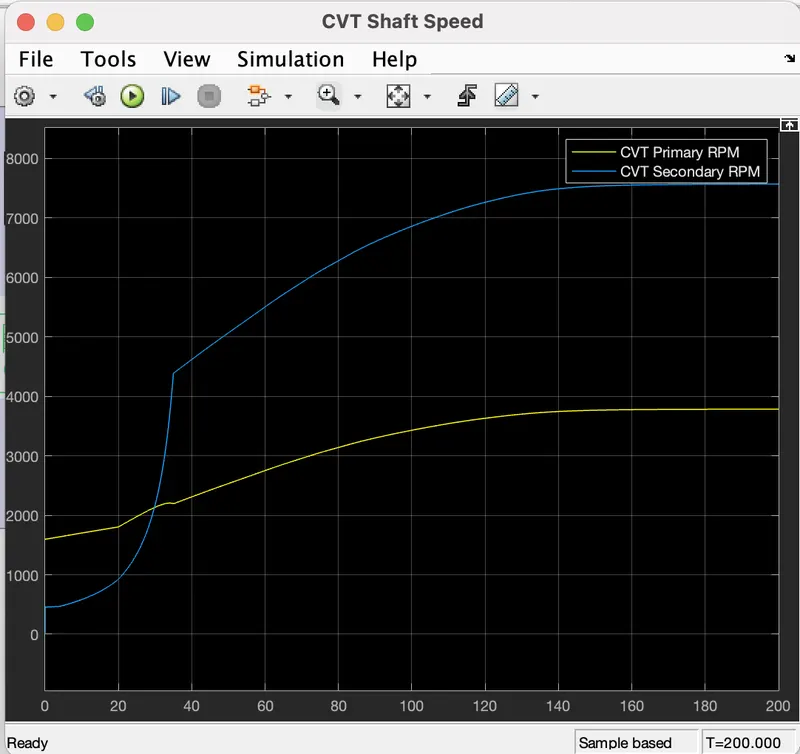
Here by varying the velocity the gear ratio changes with respect to those values.
Case2;
Simulation with CVT using dash board:
In this model dash board is shows the input of throttle and brake
Vehicle speed;
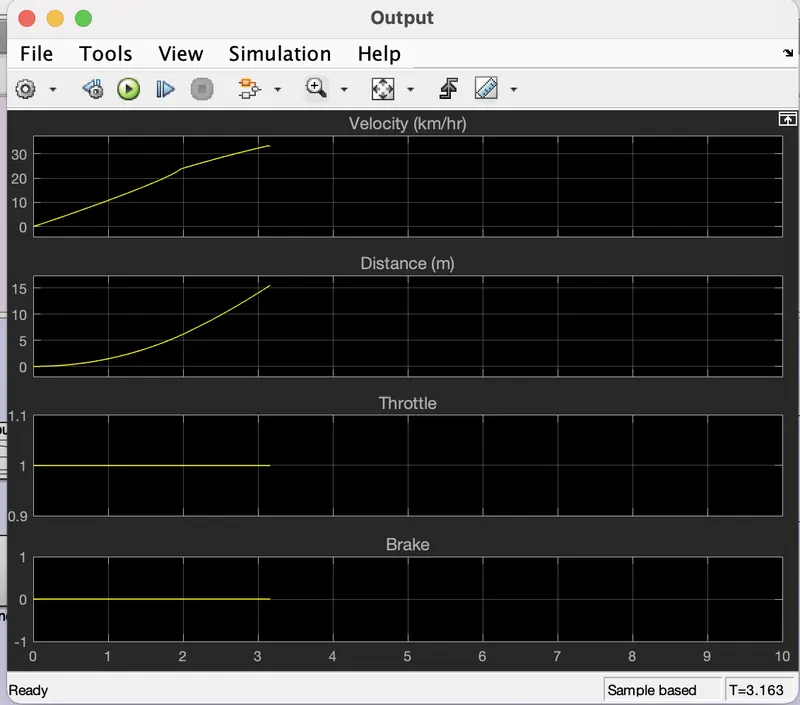
The variation in the velocity can be observed with the change in throttle
CVT shaft rpm;
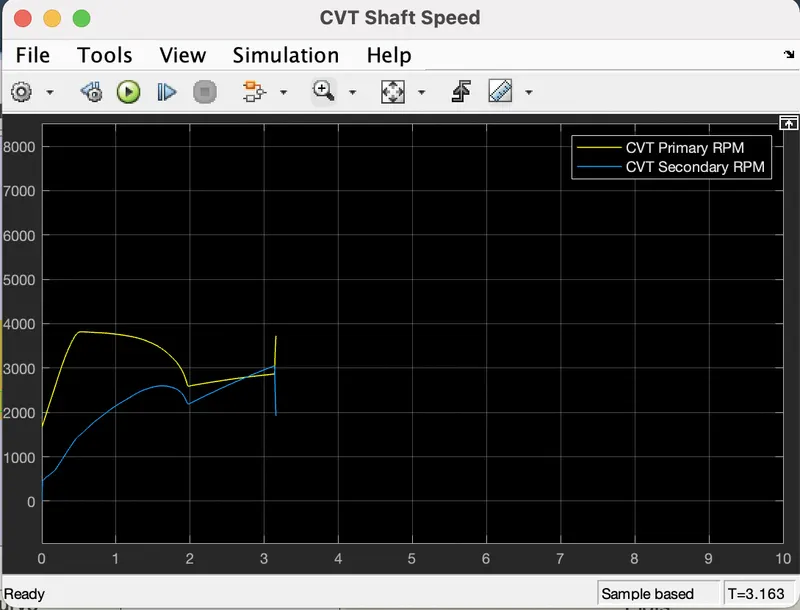
The graph indicate the variation in rpm of primary and secondary shaft with respect to input pararmeter.