Week-11 Challenge: Braking
Note : i am part of live EV batch 13
1 ) For a defined driving cycle, calculate the energy required for braking.
Equation :
energy = `1/2 *m *v^2`
Matlab coading :
- First we have given constant values.
- importdata command is used to get data from file .
- For loop is used to find energy .
- plot command is used for ploting time vs velocity and time vs breaking energy.
clear all
close all
clc

mass = 2000 * 0.5*(2000); % mass
g = 9.8; % gravitational constant
file = importdata ('hwfet.txt'); % importing drive cycle
file1 = file.data ;
f1 = file1(1:end ,1);
f2 = file1(1:end , 2);
time = f1 ; % time
velocity = f2 ; % velocity
time_period = 766;
breaking_energyy = zeros(1,time_period);


for i = 1 : (length(velocity)-1)
    if velocity(i)> velocity(i+1)
        breaking_energyy (i) =  0.5*mass*0.001*((velocity(i))^2-(velocity(i-1))/3600);
    end
end

%plotting
figure(1)
plot(time,velocity)
axis ([ 0 800 0 80])
xlabel('Time(seconds)');
ylabel('Velocity(m/s)');
title(' hwfet drive cycle data')

figure(2)
plot(time, breaking_energyy,'r')
xlabel('Time(seconds)')
ylabel('Breaking energy(Kwh)')
title('Breaking energy values for hwfet drive cycle data')
Outputs :
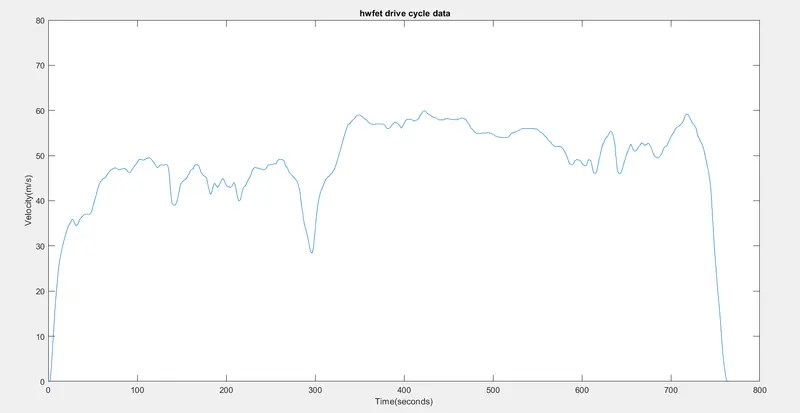
- Above graph shows the time vs velocity of hwfet drive cycle.
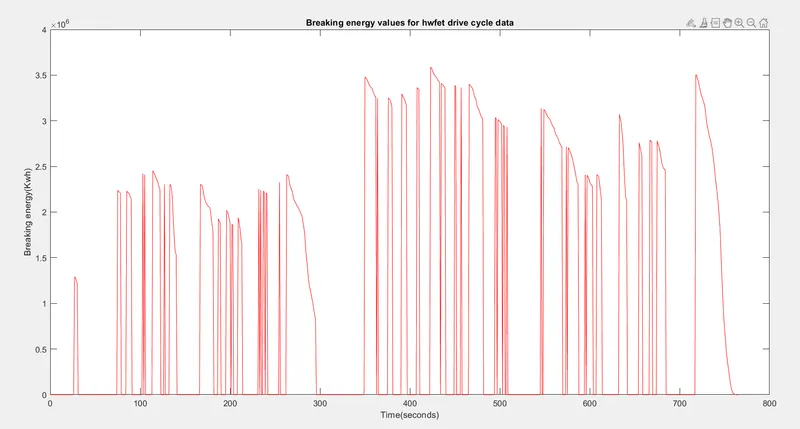
- Above graph shows breaking energy at time period .
Below is the link of matlab ,
https://drive.google.com/file/d/1arYkBG3my0nbnFn493ZGyK2jJGMZ7nWo/view?usp=sharing
2 ) Why electric motor can’t develop braking torque at high speed similar to starting? How electric and mechanical brakes are coordinated?
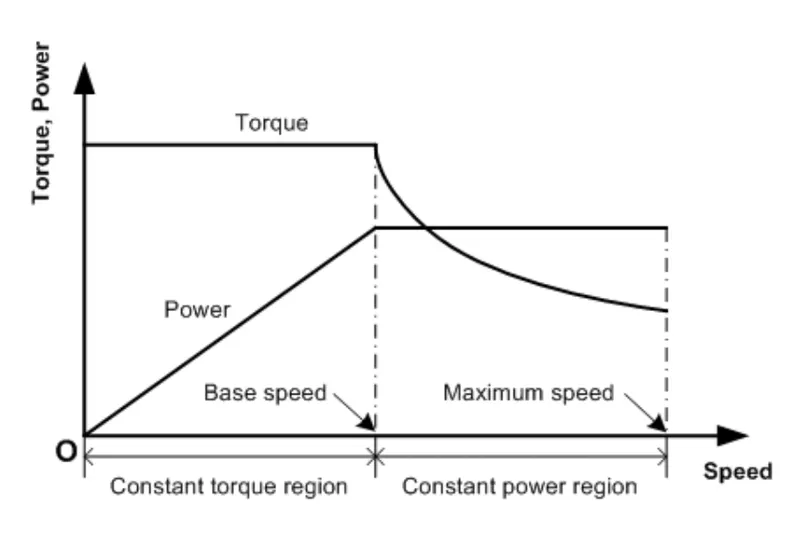
- above graph is speed vs torque graph.
- Torque is maximum and constant upto ratted speed .
- After ratted speed the torque decrease and power become maximum and remain constant.
- So at high speed electric torque generated by electric vehicle is very low and cannot attain the required brake torque demand.
- An electric motor cannot develop braking torque at higher speed because torque is applied in opposite direction .
- As speed increases the torque should be decreses to maintain constant power.
Electric and mechanical breake coordinate :
Regenerative Breaking :
- It turns cars kinetic energy into electricity to charge its battery and boost efficiency .
Mechanical breaking :
- Breakes absorb energy and convert it to heat . Mechanical brakes all act by generating frictional forces as two surfaces rub against each other .The stopping power or capacity of a brake depends largely on the surface area of frictional surface as well as on the actuation force applied .
- There are two ways of breaking control :
- Series : in series we apply mechanical brakes or reenerative breaking one after another .
- Parallel : we apply both mechnical breakes and regenerative breakes simultaneously .
3 ) Make a MATLAB program which plots contour of given motor speed, torque and efficiency values. Attach the code as a .m file attach a screenshot of all the plots.
Equations :
power input = power output + copper power loss + iron power loss +windage power loss + motor contant loss
efficiency = power output/ power input
Copper losses - `I^2R` ,where R is armature resistance and I is curent.
Iron loses are magnetic losses which is Ki * w
Windage losses - This is a mechanical or friction of windage losses .
Matlab coding :
- Linspace command is used create velocity and torque.
- meshgrid command is used to create array of velocity and torque.
- contour plotting is done using contour command .
clear all
close all
clc

%inputs
v = linspace(1,1200) ; % velocity
T = linspace (1,500) ; %torque
Kc = 0.1 ; % copper loss
Ki = 0.006 ; %iron loss
Kw = 0.0001 ; % motor loss
C1 = 20 ; % motor loss constant

[A,B] = meshgrid(v,T); % array of matrix

%power calculatiom
p_out = (A.*B) ; %motor output power
p_c = (B.^2)*Kc; %copper loss power
p_i = A.*Ki ; % iron loss power
p_w = (A.^3)*Kw ; %windage loss power
p_in = p_out +p_c + p_i + p_w +C1 ; % motor input

%efficiency calculation
eff = p_out./p_in ;

%% contour ploting
N = [0.75 ,0.8,0.85,0.86,0.87,0.88,0.89,0.9,0.91,0.92,0.93,0.94,0.95,]; %contour mapping
figure (1)
box off
grid off
contour(A,B,eff,N);
colorbar
title(' Torque - speed- efficiency contour of an induction motor ');
xlabel('Rotor speed in RPM ');
ylabel('Induction torque in N-m');
zlabel('Motor Efficiency');
Output :
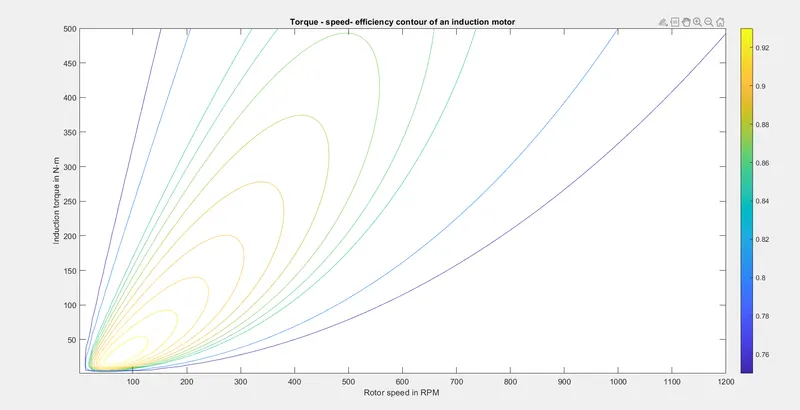
- Above graph shows the torque- speed - efficiency ocontour of an induction motor
Below is the link of the matlab model ;
https://drive.google.com/file/d/1eEQRW_NJIgR9qW0ox_5W0nB2ev2YNJaZ/view?usp=sharing