Week-11 Challenge: Braking
1)For a defined driving cycle, calculate the energy required for braking.
Answer:-
1) Drive cycle :-
A driving cycle is a series of data points representing the speed of a vehicle versus time. Driving cycles are produced by different countries and organizations to assess the performance of vehicles in various ways, as for instance fuel consumption, electric vehicle autonomy and polluting emissions.
From drive cycle, calculating the energy required for braking :-
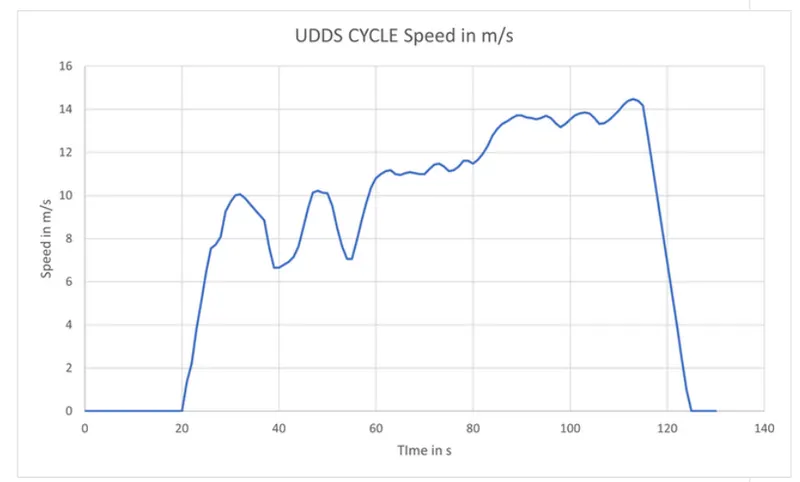
Drive cycle is UDDS cycle which is urban dynamometer drive schedule. The data is taken for 1370s time for our simplicity of calculation we take 150 sec drive cycle time is consider. Speed which is in miles per hour has been converted into meter per second.
Drive cycle is given below :-
The equation for calculating braking energy :- The energy calculate by equation is given as follows ,
E = (1/2) * M * (Vi - Vf) ^2
Where ,
M = Mass of vehicle in Kg
Vi = Initial speed of the vehicle in m/s.
Vf = Final speed of the vehicle
From above drive cycle, we get 10 braking point. The mass of vehicle is constant is about 1500 Kg then the energy required for braking is calculate as follows:-
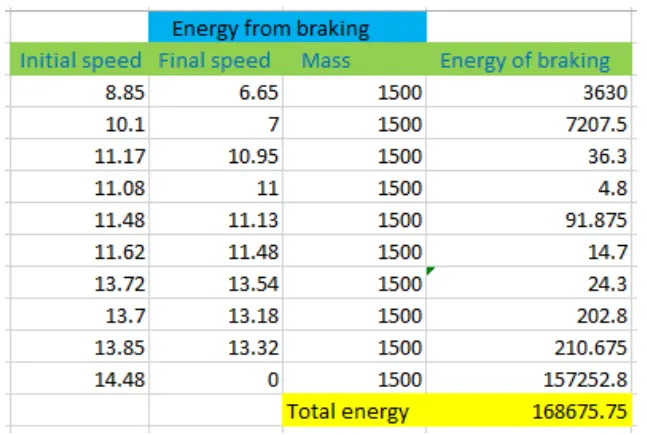
From above calculation the energy required for thr braking is about 16.8 KW
-----------------------------------------------------------------------------------------------------------------------
2)Why electric motor can’t develop braking torque at high speed similar to starting? How electric and mechanical brakes are coordinated?
Answer:-
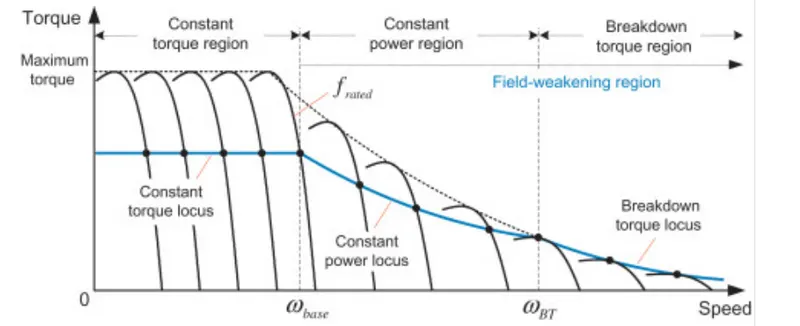
From above curve , we see the three region first one is constant torque region , constant second is power region , third is breakdown torque region. So at start of motor, the motor ahieved the peak torque till the moment at it reaches the certain speed and after that it start rapidly drop. The reason of dropping the torque of motor because the motor shaft reaching the critical speed.The area motor achieve the peak torque and constant is called constant torque region.
The region where the torque reduce is known as constant power regionas the power generated by motor will be its peak.so the torque produced at constant power region is low this is reason where the motor does not produced braking torque in this region.
How electric brake and mechanical brake co-ordianate:-
There are two types of braking is used electric and mechanical braking system are as follows:-
1)Electric braking :-
In electric braking, the winding of the motor is used to produce the braking torque these braking torque developed during braking operation.these opeation opposes the rotation of shaft and it doing by changing the connection of motor.
2)Mechanical braking :-
In mechanical braking , the frictional force produce between rotating part of wheel and brake drum produce require braking. to achieve these braking various mechanical part are use such as brake lining and brake drum.
Both these method co-ordinate in EV application as follows:-
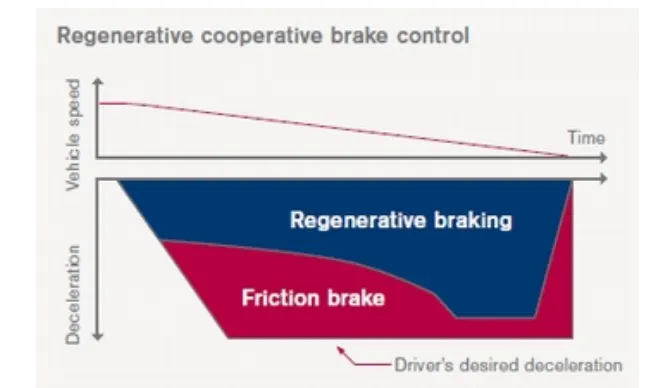
In an Electric vehicle, at start of the vehicle the friction braking gives the 60 % contribution and regenrative braking give 40 % contribution and speed of vehicle start reduce. After some of the braking time the regenrative braking in role and provide the some of power supply back to the source . As we know the raking torque is very low at high speed at start so friction braking apply brake and slow the speed of vehicle and after that the regenrative braking in which motor act as generator and supply toward the source by producing negative torque
-----------------------------------------------------------------------------------------------------------------------
3)Make a MATLAB program which plots contour of given motor speed, torque and efficiency values. Attach the code as a .m file attach a screenshot of all the plots
Answer:-
Matlab Coding:-
|
Explanation:-
- starting the codes using clearing all data codes.
- speed and torque is defined as 2-dimensional linearly spaced arrays using the linspace command.
- constant of motor losses like copper loss, iron loss, windage loss.
- 2-dimensional arrays are defined in 3-dimensionl arrays using meshgrid command.
- equating the equations motor losses based on speed and torque.
- output power is defined using 3_dimensional speed and torque arrays.
- Input power is defined using sum of motor losses and output.
- efficiency is defined ration of output power to input power. mapping efficiency ranges are set.
- plotting the graph.
Plot:-
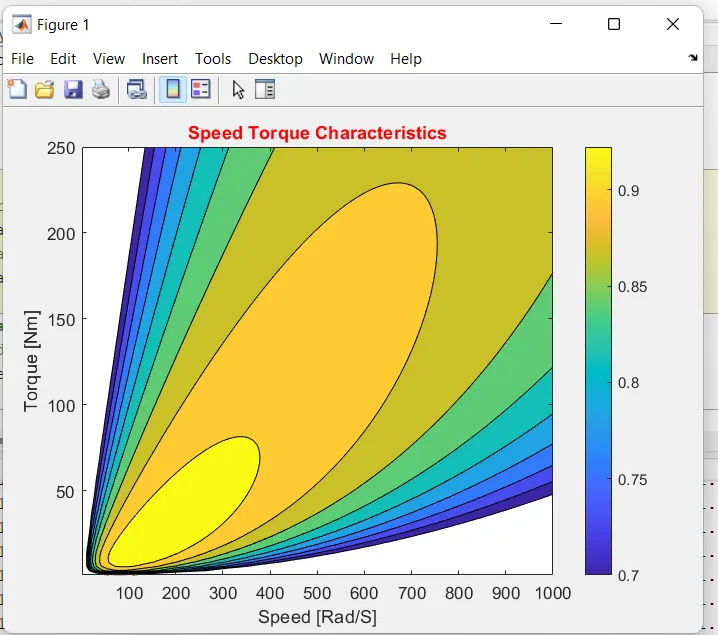
Result :-
From the plot it can be observed that the speed and torque varies as efficiency increase. This is occur due to motor losses. As we see the drak blue region represent the 70% efficiency and the yellow region represnt 93% efficiency. Ex.- when it is at 70 % efficiency the torque reaches its peak value 250 Nm. it means the when the vehicle is at very low spweed the torque decrease as the speed increase for same efficviency. and at 93% efficiency the speed and torque required much less compared to an efficiency 70%. Greater the motor efficiency lower speed torque combination is required to overcome the motor losses.
-----------------------------------------------------------------------------------------------------------------------