Week-11 Challenge: Braking
SOLUTION 1 :-
Braking :
- Braking is the process of controlling the velocity of an object by inhibiting its motion.
- An object in motion possesses kinetic energy and to bring the object to a stop this kinetic energy must be removed. Removing the kinetic energy can be accomplished by dissipating the energy to the atmosphere through friction or by converting it into another form of energy.
- The most common type of braking is a mechanical brake which inhibits motion through friction brake pads.
- A mechanical brake applies a friction force to convert the kinetic energy of the vehicle into thermal energy which then dissipates into the atmosphere.
- Braking systems which don't use friction are referred to as regenerative braking systems (RBSs).
- In RBSs, the kinetic energy is converted into other forms of useful energy, which can be stored for later use, increasing fuel efficiency.
The kinetic energy of a vehicle during braking is given by:
`Ke=(1/2)*(W/g)(U^2-V^2)=(1/2)*M*(U^2-V^2)`
`where W=gross vehicle weight (N); U=initial velocity(m/s); V=final velocity(m/s); M=mass of vehicle(Kg); g=acceleration due to gravity`
- The Kinetic energy doubles as the weight doubles while it increases 4 times if the velocity doubles.
Before calculating the Brake energy of a particular vehicle, we need to create en excel sheet of Drive cycle.
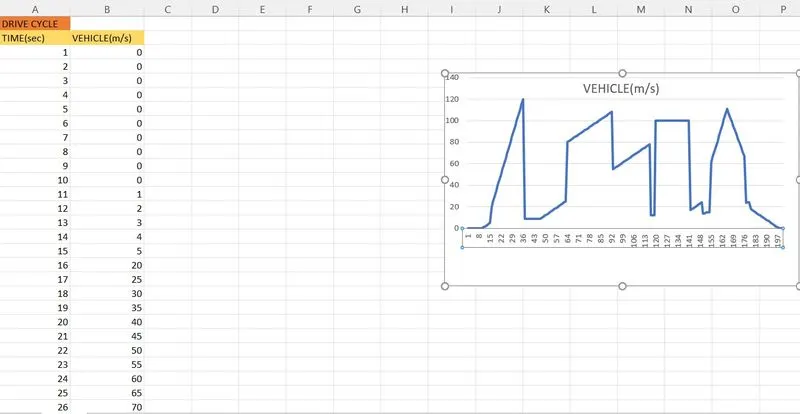
Now we need to import this excel data in the MATLAB and and calculate the braking energy and plot the results by a matlab command.

After importing the Dive Cycle data, we create a program to calcuate the Braking energy as shown below:
%MATLAB program for the calculation of Brake energy
mass=850; % mass of the vehicle in kg
t= Drivecycle(:,1); % timeperiod
v= Drivecycle(:,2); % velocity data in m/s
B=ones(1,200);
Range=height(t)-1;
for i=1:Range
    if v(i)>v(i+1)
        B(i)=0.5*mass*(v(i)-v(i+1))^2; %B stands for brake energy
    end
end
fprintf('Total Brake Energy is %d',sum(B))
fprintf('Average Brake Energy is %d',mean(B))
% plotting the results
figure(1)
subplot(2,1,1)
plot(t,v,'linewidth',2,'color','b')
xlabel('Time(s)')
ylabel('velocity(m/s)')
title('Drivecycle')
subplot(2,1,2)
plot(B,'linewidth',2,'color','r')
xlabel('Time(s)')
ylabel('Braking Energy')
Explanation for above Program:
- Assume mass of the vehicle is 850kg and assume time and velocity value from the Drive Cycle imported data.
- For deceleration initial velocity(v(i)) is greater than final velocity (v(i+1)), for that we use the 'if' condition to check when v(i)>v(i+1). Whenever the conditon satisfies, the brake energy ius calculated using the below formula:-
`B=m*(Vi-Vf)^2/2`
where, m=mass of the Vehicle(Kg)
Vi=Initial velocity of Vehicle(m/s)
Vf=Final velocity of Vehicle(m/s)
B= Braking energy (J)
3. Calculate the braking energy for the length of the Drive Cycle usig 'for' loop condition.
4. After calculating, all the braking energy for the whole Drive Cycle, find Total Braking energy using 'sum(B)' command
and Average Braking energy using 'mean(B)' command.
5. Plot the results using 'Plot' command and mention, 'xlabel', 'ylabel' and 'title' command for proper identification of the plot.
6. Using 'subplot' command get the different plots in the same window.
7. Finally, click the RUN button to display the plots.
The results are as shown below:
FIGURE WINDOW
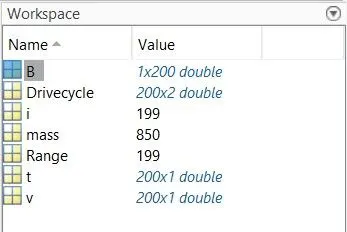
WORKSPACE VARIABLES

COMMAND WINDOW
CONCLUSION :-
- The Total braking energy is 1.215*10^7 Joules;
The average braking energy is 6.07*10^4 Joules
SOLUTION 2 :-
- Electric motor can’t develop braking torque at high speed similar to starting because the braking Torque is applied in the direction opposite to the directio of the motor.
- Also at the time of braking the motor has already achieved its maximum speed which increases the back EMF of the motor after which the flu weakening action occurs and hence no further Torquue can be increased.
- One among the reasons of low braking torque is that at the time of starting the motor is accelerating and hence the energy is used to increases the Kinetic energy while at the time of braking the enrgy is used only to meet the losses.
Regenerative braking of Induction motor:
An induction motor is subjected to regenerative braking, if the motor rotates in the same direction as that of the stator magnetic field, but with a speed greater than the synchronous speed.
Such a state occurs during any one of the following process.
Downward motion of a loaded hoisting mechanism.
During flux weakening mode of operation of IM.
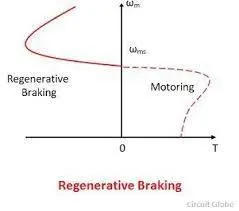
Under regenerative braking mode, the machine acts as an induction generator. The induction generator generates electric power and this power is fed back to the supply. This machine takes only the reactive power for excitation.The speed torque characteristic of the motor for regenerative braking is shown in the figure.
Regenerative Braking for DC motor:
In regenerative braking of dc motor, generated energy is supplied to the source.For this the following condition is to be satisfied.
E > V and Ia should be negative.
- Sometimes after accelerating you can't reach the maximum torque. The reason is that no matter how much the current loop wants to increase current (proportional to torque) by increasing the PWM duty cycle of the power stage, the Vmotor is too close to Vbemf and therefore current can't increase more.
- Whenever Friction torque + Additional loads = Motor Torque, the load remain in equilibrium (does not move, or moves under constant speed). Whenever Friction torque + Additional loads < Motor Torque, the load accelerates (Motor torque - Friction torque - Additional loads = Acceleration torque > 0). Al high speeds, the BEMF is so close to Vbus that the applicable Motor torque gets limited. Then, the bigger the Friction torque + Additional load is, the smaller the Acceleration torque becomes.
This situation does not occur at the beginning of an acceleration because most of the torque is used to increase the kinetical energy of the load (and motor). But when the speed is already high and no extra load is applied it is not possible to increase the torque.
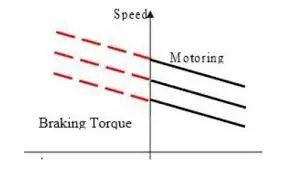
The charcteristics of motor during Forward motoring and Forward braking is shown below:
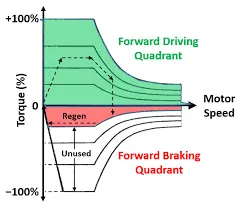
From the above plot we can see that the peak Torque during motoring is higher than that at braking. The simple reason is that during motoring the motor speed is low initially and hence the motor accelerates with the applied torque while during braking the motor is already at high speed so it can't accelerate any further.
Due to this ineffective regenerative braking action, the whole motor power can't be fedback to the supply.
Coordination of Electrical and Mechanical brakes :
- There are two important problems in designing the regenerative braking system.
- First, how to distribute the total braking forces required between the regenerative brake and the mechanical brake in order to recover the kinetic energy of the vehicle as much as possible;
- Second, how to distribute the total braking forces on the front and rear axles so as to minimize the stopping distance and conserve the vehicle stability.
- Usually regenerative braking is effective only for the driven axle,which is the rear axle in this study. The traction motor
must be controlled to produce the proper amount of braking force for recovering the kinetic energy as much as possible and, at the same time, the mechanical brake must be controlled to meet the braking force command from driver.
Basically, there are three different brake control strategies: series braking with optimal braking feel, series braking with optimal energy recovery; and parallel braking.
- Series Braking with Optimal braking feel:-
The series braking system with optimal feel consists of a braking controller that controls the braking forces on the
front and rear wheels. The purpose of this strategy is to minimize the stopping distance and optimize the driver’s
feel.
The braking force on the rear wheels (driven axle) is composed of two parts: regenerative braking force and mechanically frictional braking force.
When the braking force demanded for rear axle is less than the maximum braking force that the electric motor can produce, only electrically regenerative braking will apply.
But when the commanded baking force is greater than the available regenerative braking force, the electric
motor will operate its maximum braking torque, and the remaining braking force is provided by mechanical
braking system. - Series braking with Optimal energy recovery:-
The principal of series braking system with optimal energy recovery is to recover the braking energy as
much as possible in the condition of meeting the total braking force demanded for given deceleration. - Parallel Braking:-
The parallel brake system includes both an electrical (regenerative) brake and a mechanical brake, which produce braking forces in parallel and simultaneously.
The parallel brake system has a conventional mechanical braking which has a fixed ratio of braking forces distribution on the front and rear wheels.
Regenerative braking adds additional braking force to the rear wheels. Because the regenerative braking force available is a function of motor speed and because almost no kinetic energy can be recovered at low motor speed, the regenerative braking force at high vehicle deceleration is designed to be zero so as to maintain braking balance.
When the demanded deceleration is less than this deceleration, regenerative braking is effective.
SOLUTION 3 :- To plot Contour line for a given Motor, we need to consider the various types of losses happening inside it.
These losses are as follows:-
- Copper Losses : The Copper losses are given by I^2.R where R is the armature resistance and we say that Torque is proportional to the current. This copper losses can be considered as Kc.T^2 where Kc is to take care of resistance of brushes and aslo the flux and its effects.
Copper losses=Kc*T^2 - Iron Losses : Iron losses are nothing but the Magentic losses which is denoted by Ki*w, where Ki is based on the magnetic field effect. For permanent magnets, we have constant magnetic field and Ki value decides the iron losses and they change with speed. At different values of speed, we have different valuues of back EMF and it affect the iron losses.
Iron Losses=Ki*w - Windage Losses : This is a Mechanical or friction or windage losses.This is based on size of shape of Motor and the amount of windage losses that the motor is going to experience.
Windage losses=Kw*w^3 - Constant losses : These are the losses which don't change with speed.
The total losses in the Motor are calculated by considering all the above losses:
Total losses=Kc/T^2+Ki**w+Kw*w^3+C
All Motors are modelled as per the above losses equation. The above equation is valid not only for permanent magnet DC motors but also to indcution and other motors.
MATLAB program to calculate Motor Speed-torque Contour efficiency:
% A program for plotting efficiency contours for electic motors.
% The x-axis corresponds to motor speed (w),and the y axis to thr torque T.
%  First, set up arrays for range.
x=linspace(1,1000);%speed, N.B. rad/s NOT rpm
y=linspace(1,250); %0 to 40N.m
% Allocate motor loss constants.
kc=0.2; %For copper losses
ki=0.008; %For iron losses
kw=0.00001; %For winding losses
ConL=20; % For constant motor losses
% Now make mesh
[X,Y]=meshgrid(x,y);
Outputpower=(X.*Y); %Torque x speed=power
B=(Y.^2)*kc; % Copper losses
C=X*ki; %Iron losses
D=(X.^3)*kw; %winding losses
Inputpower=Outputpower+B+C+D+ConL;
Z=(Outputpower./Inputpower);
% We now set the efficiencies for which a contour will be plotted.
V=[0.70,0.75,0.78,0.80,0.82,0.85,0.88,0.90,0.91,0.92,0.925,0.93,0.95,0.98];
box off
grid off
figure(1)
contourf(X,Y,Z,V);
xlabel('Speed(rad/s)'),ylabel('Torque(N.m)');
% Now plot a contour of the power output
% The array output power has already been calculated.We draw contours at
% 3 and 5kw.
V=[8000,10000];
figure(2)
contourf(X,Y,Outputpower,V);
xlabel('Speed(rad/s)'),ylabel('Torque(N.m)');
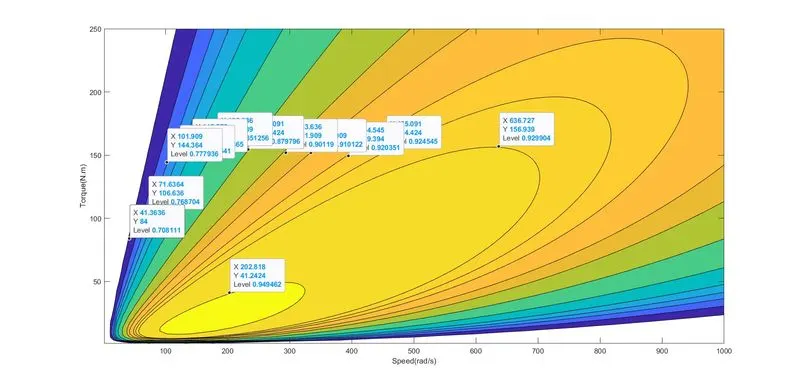
- The Ouptut plot of Efficiency Contour is shown below:
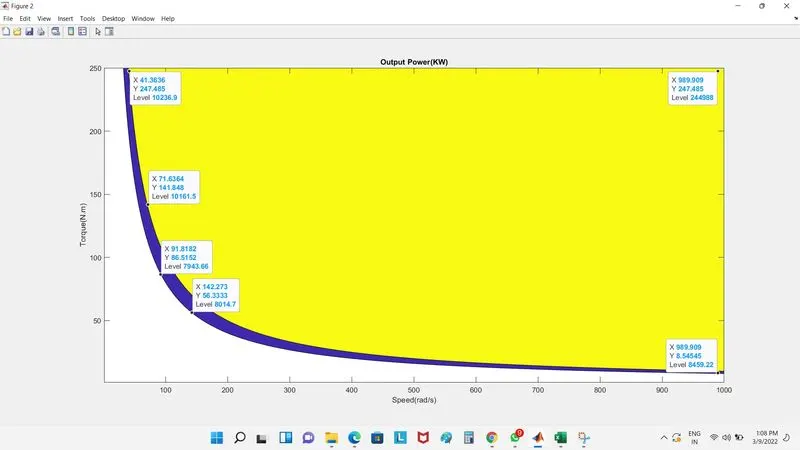
- The Output Power Contour is shown below:
Explanation For above Program:-
- Assign input of Speed and Torque in an array using 'linspace' command and allocate constant values for the 4 losses(Iron loss, Copper loss, Windage loss, constant loss).
- Mesh the speed and Torque values using the 'meshgrid' command.
- Calculate Copper losses, windage losses, Iron losses using those formulas.
- Calcluate Output power by multiplying Torque and speed.
- Calculating Input power by adding the 4 losses and Output power.
- From the ratio of output power and Input power, we get efficiency.
- Now, set the efficiencies for which the Contour will be plotted (from 70% to 98%)
- Plot the Contour efficiency using the'Contour' command and plot Speed, Torque, efficiency and V.
- Now Plot the contour of Output power for 8KW and 10KW.
- Run the program to plot the contour.
- From the efficiency contour we can observe that the minimum observed efficiency is 70.8% at the Speed=41rad/s and Torque=84Nm.
- Also the maximum efficiency is around 95% at speed=203 rad/s and Torque=41.24 Nm.
- From the output power contour, the points of 8KW power are: speed=142.27rad/s & Torque=56.33Nm
- Also the points of 10KW power are: Speed=71.63rad/s & Torque=141.8 Nm
The script file containing the actual code has been attached attached below in the name ''Efficiency.m"