Week-11 Challenge: Braking
Answer 1-
Drive cycle UDDS-
Calculation of energy required for braking using excel calculator( excel file is attached)-
| Braking | Case 1 | Case 2 | Case 3 |
| Initial Velocity (m/sec) | 20 | 12 | 7 |
| Final velocity (m/sec) | 0 | 9 | 4 |
| time (Sec) | 10 | 10 | 10 |
| Energy (J) | 200000 | 4500 | 4500 |
| Energy (KJ) | 200 | 4.5 | 4.5 |
| Deceleration | 2000 | 300 | 300 |
| Decelration power (Kw) | 30 | 0.675 | 0.675 |
| Braking power(kWh) | 0.008333333 | 0.0001875 | 0.0001875 |
Conclusion-
In case 1 energy required for braking is claculated as 200 KJ
In case 2 energy required for braking is claculated as 4.5 KJ
In case 3 energy required for braking is claculated as 4.5 KJ
Answer 2-
At the time of Vehicle Acceleration (starting), motor have high starting Torque but as the motor is deaccelerates, the motor characterstics is shifted towards the braking region. This region doesn't have a maximum torque because motor is already running at a high speed. Due to this reason, electric motor can't develop braking torque at a high speed.
Electric and Mechanical brakes are coordinated by using a Brake Strategy Subsystem;
- Series Braking Strategy.
- Parallel Braking Strategy.
> Series Brakking Strategy:
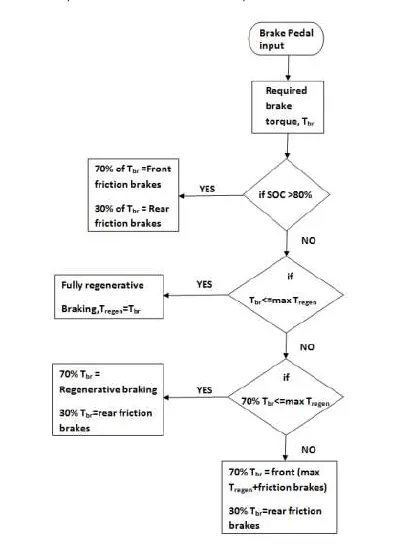
- when we press the brake pedal, a brake torque is sent. Now this brake torque passes into the brake control strategy block. Here, firs it is checked that if the battery SOC(state of charge) is below 80%or not, which is set as the maximun permissible level of charge. If this condition is satisfied, then the battery is recharged.
- The brake torque requested is compared to the maximum rgenerative torque limit of the motor generator.
- If the overall brake torque requested is less than or equal to te maximum regeneative torque, then the vehicle brakes are purely on the regenerative torque and the battery is been charged.
- The amount of charge ultimately put in depends also on the motor generator operation efficiency and the battery charging efficiency.
- If the overall brake torque requested is greater than what the motor generator can provide then the friction brakes kick-in.
- Now since the vehicle is front driven, it is checked if the total brake torque requested from the front is less than or equal to maximum regenerative torque capability of motor generator.
- If yes the front braking is provided purely by regeneration and rare (non driven axle) by friction.
-
- Once the total brake torque requested increases further, the front friction brakes (driven axle) comes into play in combination with rare friction brakes, the front regenerative braking to satisfy the overall brake torque on demand.
> Parallel Brakking Strategy:
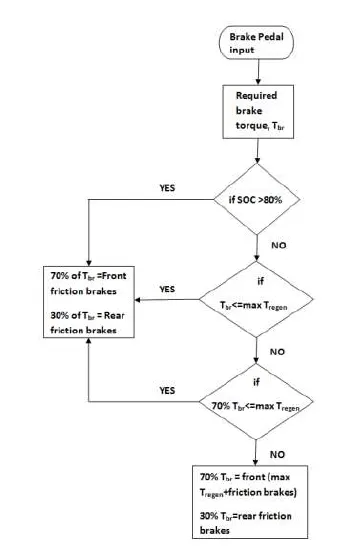
- When the brake pedal is applied and the desired overall brake torque request is sent from the driven block, this brake torque on passing through the brake control strategy gets divided between regeneration and friction braking at all times.
- The strategy is so modeled with the comfort and brake pedal free in mind as a parallel regenerative braking is an add-on to the conventional system.
- It is devoid of any integrated control so, the making transition and performance of regenerative braking with frictions mood is assigned in such a way that there is a clear division between the amount of brake torque that will be achieved from regeneration and friction braking.
- On application of brakes and in keeping with the design of the motor generator. It is designed to operate generator in a constant generator torque region.
- Motor-generator can provide a maximum of 322 Nm of generator torque at all under the base speed. The generator is called such that the base speed of the generator corresponds to a velocity of 124 kmph, which is the maximum speed limit on most highways.
- Hence, regeneration works as long as the vehicle is breaking from a speed of under 124 kmph and the requested brake torque on the front driven wheels After the front rear brake split is greater than or equal to maximum generated torque.
- If the condition is satisfied then regenerative and friction braking operates in tandem. Else, it's just the friction brakes at the driven and non driven axle.
Answer 3-
>MATLAB Code:
clear all
close all
clc
speed= linspace(0,1000);
torque= linspace(0,500);
kc= 0.2;
ki=0.006;
kw=0.000010;
k=20;
[x,y] = meshgrid(speed,torque);
copper_loss= (y.^2)*kc;
iron_loss= x*ki;
windage_loss= (x.^3)*kw;
output_power= x.*y;
input_power= (copper_loss+iron_loss+windage_loss+output_power+k);
efficiency=(output_power./input_power);
n=linspace(0.7,0.95,10);
contourf(x,y,efficiency,n);
title('speed-torque efficiency')
xlabel('speed (rad/s)');
ylabel('torque (Nm)');
colorbar
Output Plot:-
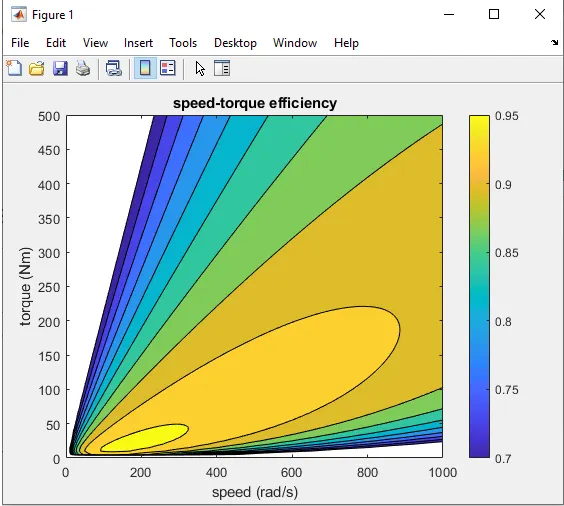
- The above graph shows us the output, we can say that the best region of motor operation is the "yellow Region" because it gives us the Maximum efficiency of around 95%.
- While the worst region of motor operation is the "Dark Blue Region" beacuse it gives he lowest efficiency of around 70%.