Week-4 Challenge WOT Condition Part-2
- What is the difference between mapped and dynamic model of engine, motor and generator? How can you change model type?
Solve-
Difference Between Mapped and Dynamic Engine Models-
| Type | Implementation | When to Use | |
| Mapped | CiMappedEngine | Model uses a set of steady-state lookup tables to characterize engine performance. | If you have engine data from a dynamometer or a design tool like GT-POWER. |
| SiMappedEngine | The tables provide overall engine characteristics, including actual torque, fuel flow rate, BSFC, and engine-out exhaust emissions. | For quasi steady-state engine simulations. | |
| Dynamic | CiEngine | Model decomposes the engine behavior into engine characteristics that are separated into lower-level components. By combining components in this way, the models capture the dynamic effects. | If you need a more detailed dynamic model and have component-level data. |
| SiEngine | To analyze the impact of individual engine components on the overall performance. | ||
Difference Between Mapped and Dynamic Motor Models-
| Motor | Mapped | Motor Specifications such as rpm, maximum efficiency, Heat, and such specifications are to be entered for simulating the results |
| Dynamic | The actual details for the same would be considered and the results would be obtained. |
Difference Between Mapped and Dynamic Generator Models-
| Generator | Mapped | Specifications for Battery Torque, Battery Current, Motor Torque and others are to be enetered for simulation. |
| Dynamic | All the details and specifications would be considered as per the actual and dynamic state the results of the same would be obtained then |
Steps followed to change the model type:-
1.select model which we want to configure.
2. choose variant manager.
3.right click the model we want to choose.
4.set as label mode active choose.
2.How does the model calculate miles per gallon? Which factors are considered to model fuel flow?
Solution-
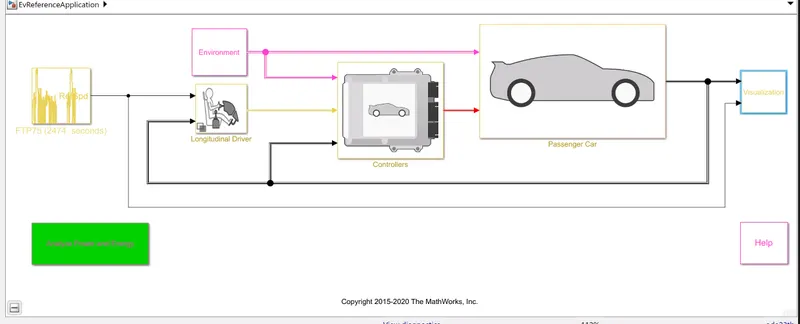
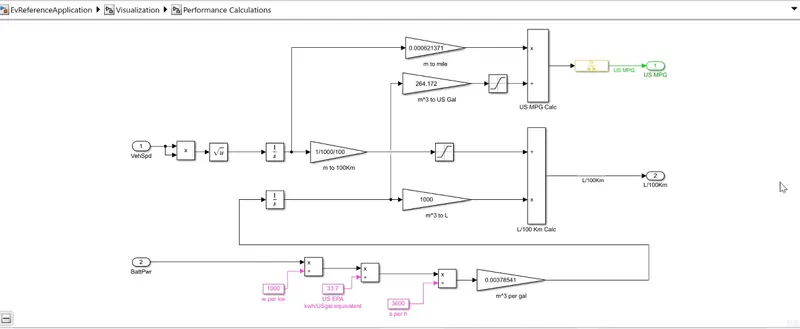
1.First, we get battery power in watt which is converted into kwatt and further converted into kw/h
2.Then it's is converted into US gallon equivalent energy by dividing it by the standard value 33.7. Then converted into US gallons per second
3.It is multiplied by standard value 0.00378541 to get volume in meter cube per gallon
4.Further meter Cube is converted into US gallon.
5. the speed of the vehicle is integrated to get distance and the distance which is in the meter is converted into mile by multiplying the standard value.
factors that are considered to model fuel flow:-
1. Vehicle speed
2.battery power
3.fuel flow
Answer 3 -
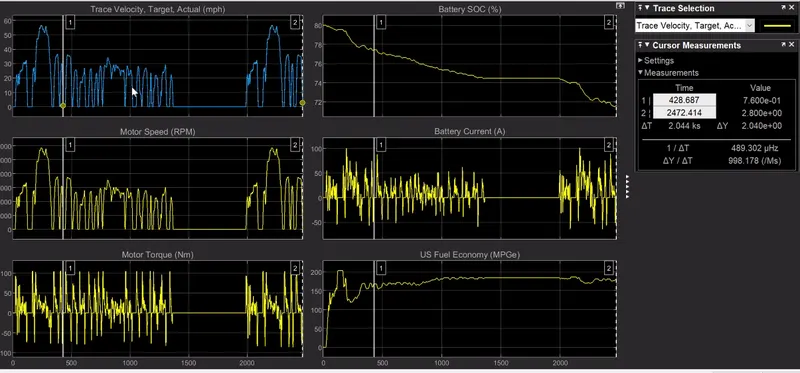
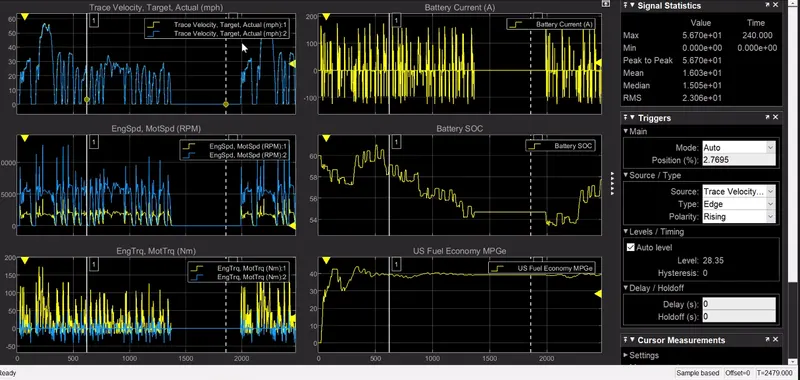
following observations has been made after running the simulation-
1. simulation time is 2472.414 seconds.
2. SOC of a battery is shown in the graph which indicates battery was 80% charged initially.
3. as the time increases soc value reduced to its min value.
4. The motor speed (RPM) and trace velocity, target, actual (mph) showing the same results. whereas motor speed increases when torque is decreasing
5.from Us fuel economy graph, it can be observed that fuel economy increased within few seconds from 0 to 200 then decreased and got stable at 175, after 400 seconds.
6.When the motor speed is 0- torque is also 0.
7.motor speed is always positive but torque is bidirectional (-100 to +100).
Answer 4-
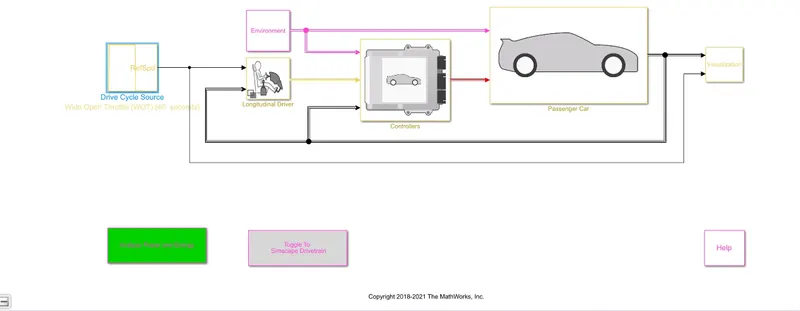
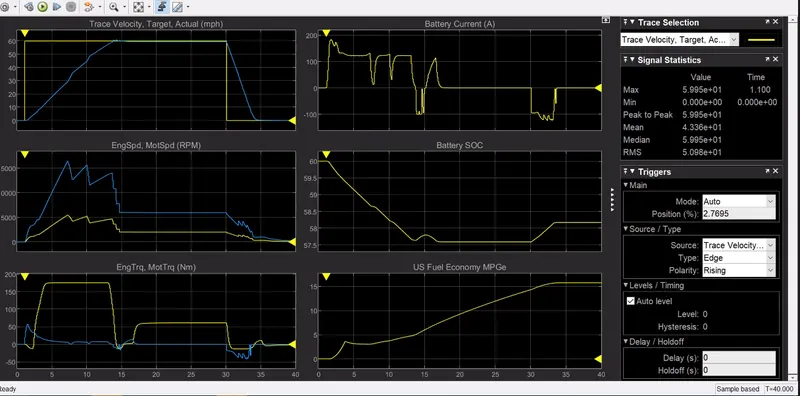
Results-
1. yellow line is the reference line while the blue line is the actual performance.
2.SOC of a battery is shown in the graph which indicates battery was 60% charged initially.
3. It can be seen SOC value decreased with time.
4.velocity get a sudden rise from 0 to 60 in a second which is not practical and in actual; performance it increases linearly and then get stable.
5. there is a major difference in motor speed. engine speed in reference and actual performance and same goes with the torque.
6.fuel economy was 0 initially and gets increased linearly upto 15 and get almost stable after that.