Week-11 Challenge: Braking
Ans 3.
matlab code
% A matlab program for plotting contour plot of motor speed, rorque & efficiency
clear all
close all
clc
% speed array
w = linspace(0,1000);
% torque array
t = linspace(0,300);
% loss coefficients
kc = 0.18; % copper losses
ki = 0.006; % iron losses
kw = 0.000015; % windage losses
% meshgrid
[x,y] = meshgrid(w, t);
copper_losses = (y.^2)*kc;
iron_losses = x*ki;
windage_losses = (x.^3)*kw;
k = 20;
output_power = x.*y;
input_power = (copper_power)+(iron_loss)+windage_loss)+output_power)+k;
eff = (output_power)./(input_power);
n = linspace(0.7,0.95,10);
contourf(x,y,eff,n);
title('speed torque characteristics')
xlavel('speed rad/s')
ylabel('torque n-m')
the speed and torque is at maximum,95%
speed = 151rad/s@24n-m torque . the speed increase efficiencies of the motor will be reduced.
Ans 2.
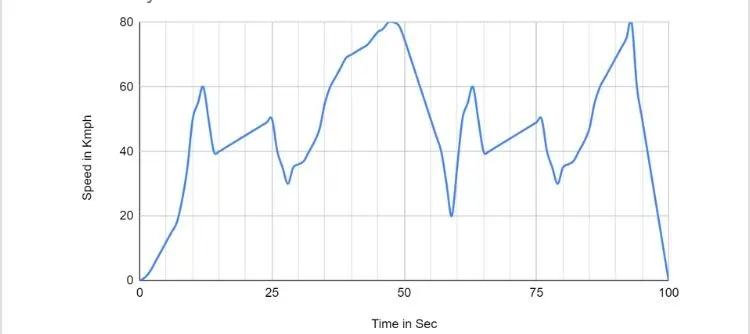
the driving cycle is determine in a table and a plot is made. using the plot, the value from the braking region of the vehicle are taken . the ploy of the drive cycle
Time in sec and speed is kmph
0
0
1
1
2
3
3
6
4
9
5
12
6
15
7
18
8
25
9
35
10
50
11
55
12
60
13
50
14
40
15
40
16
41
17
42
18
43
19
55
20
45
21
46
22
47
23
48
24
49
25
50
26
40
27
35
28
30
29
35
30
36
31
37
32
40
33
43
34
47
35
55
36
60
37
63
38
66
39
69
40
70
41
71
42
42
72
73
44
75
45
77
46
78
47
80
49
79
50
75
51
70
52
65
53
60
54
55
55
57
40
58
30
29
20
60
35
61
50
62
55
63
60
64
50
65
40
66
41
68
42
69
43
70
44
71
45
72
46
73
47
74
48
75
49
76
50
77
40
78
35
79
30
80
35
81
36
82
37
83
40
84
43
85
47
86
55
87
60
88
63
89
66
90
69
91
72
92
75
93
80
94
60
95
50
96
40
97
30
98
20
99
10
100
0
no. of braking
initail velocity(kmph)
final velocity(kmph)
time required(s)
deceleration( m/s^2)
energy required(j)
braking power(w)
braking energy(wh)
1
60
40
3
1.85
277778
92592.6
25.7
2
50
30
3
1.85
222222
74074.1
20.6
3
80
20
11
1.52
833333
75757.6
21.0
4
60
50
3
1.85
2777778
92592.6
25.7
5
50
30
3
1.85
222222
74074.1
20.6
6
80
0
7
3.17
888889
126984.1
35.3
ans2.
this situation occurs only when the vehicle is at high speeds because the motor will be runing at the constant power region. in the constant power region the torque og motor power reduce ans so the motor cannot developd the braking torque. which is equal to the constant torque that occureed during low sprrd at the constant torque range.
The torque and spped plot of vector control induction motor given below.
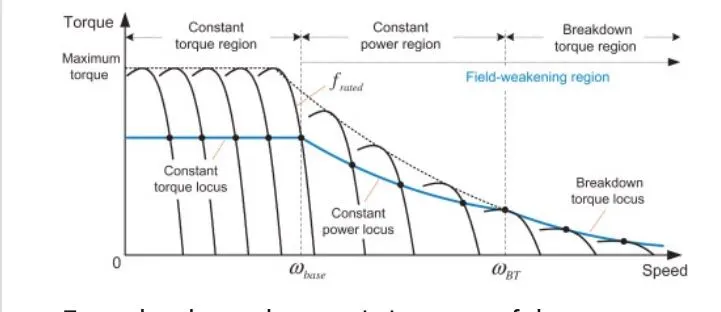
from the above characteristiccurves of the motor. that is seen that the torque of the motor remains high at low speeds and reduces as the speeds increase.
the electric motor cannot develop braking torque t a high speed similar to starting.
Electric braking and mechanical braking
electric braking:- unblancing the input points of currents to the motor.
unsing transistors in H-bridge arrangement to reverse the motor direction in the order to reduce speed.
implementing a regenerative braking system by using bi-directional power converter.
regenerative braking convert much of the energy to electrical energy which may be collected for later use.
mechanical braking:-friction between two surafce pressed together use convert the kinetic energy of the moving object into heat, through other methods of energy conversion may be perfored using pressuried air or pressuried oil which are commonly known as an air brake and hydraulic braking respectively.
coordination of electrical and mechanical braking in EV's
two tyes of barking control strategies are used to organise the electrical braking and mechanical brake
series control strategy
parallel control strategy
the comparsion of the control strategies is shown in the below figure.
in the figure it is seen that, according to the amount of brake pendal travel of the vehicle.
the mechanical brakes and regenerative brake are employed.
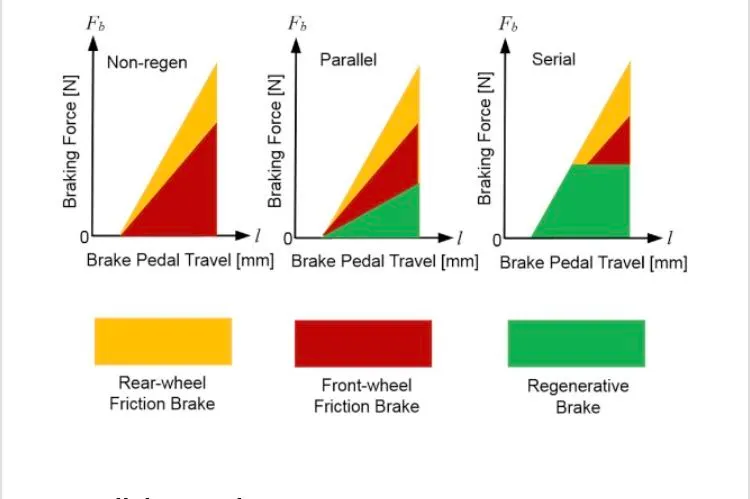
parallel control strategy:- when the brake is applied according to the brake pedal travel the front wheel friction brake, the rear wheel friction brakes and the regenerative braking are employed simultaneously. the higher the travel of the brake pendal the higher the amount of braking will done.
series control strategy:- when the brake is applied according to the brake pedal travel the front wheel friction brake, the rear wheel friction brakes and the regenerative brakes are applied one after another.
Ans1.
Driving cycle:- A driving cycle are as of vehicle speeds point versus time, it is used to calcultate the fuel consumption of a vehicle, which is later on is comparad with different vehicle s. the main use of driving cycle.
. To assess the performance of a vehicle 9fuel economy, emission tests).
. to analyze battery state and energy consumption in electric vehicles.
. to simulate vehicle model prior to the actual development.
Braking:- raid vehicle involves the conversion of kinetic energy into thermal energy (hrat). when stepping o the brake the driver command a stopping force several times as powerul as the force associated kinetic energy as heat.
matlab coad
clear all
close all
clc
%read the drive cycle data from given.xls file
DC = xlsread ('velocity and time.xlsx');
T = Dc(;1);%time in sec
S = DC(;2);%speed in kmphg
%ither data
m = 1000;5mass in kg
V = s/3.6;%speed in m/s
%to create an array to store values for deceleration & braking energy
z = lenght(T)
deceleration = zeros(1,z)
acceleration = zeros(1,z);
BE = zeros(1,z);
AE = zeros(1,z);
for i = 1:(length(T)-1)
if V(i)>V(i+1) BE = 0.5*(V(i)-V(i+1)^2;%braking energyin joules
speed_decerease(i)=V(i+1)-V(i)
deceleration(i)=speed_decreses(i);
%since time delta is 1s Acc/Dec=V/T..m/s, where
t = 1
end