Week-11 Challenge: Braking
1. AIM
- To calculate the energy required for braking for a defined driving cycle.
ENERGY CALCULATION
- the deceleration or braking condition is also similar to the acceleration condition, both conditions require the same amount of energy.
- the formula used for both conditions,
Energy = 0.5 * mass * (velocity)^2 where velocity is considered as V_final - V_initial generally
PROGRAM
clear all
close all
clc
%input
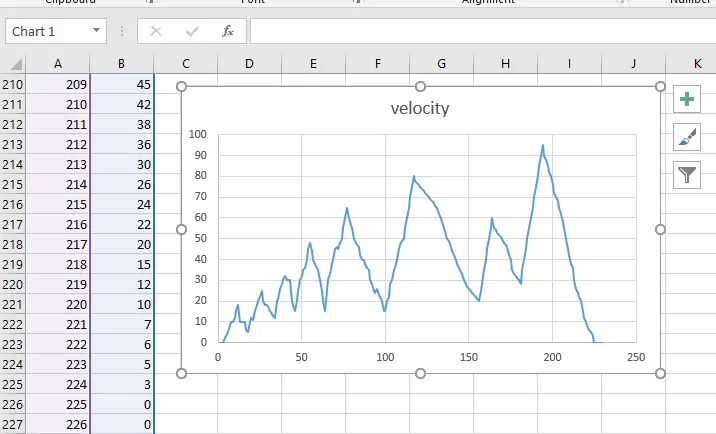
d_c=xlsread('timevsspeed.xlsx');
time=d_c(:,1);
speed=d_c(:,2);
v=speed./3.6;   %km/h - m/s
mass=1000;

%array
braking_energy=zeros(1,length(time));
acceleration_energy=zeros(1,length(time));

%energy
for i=1:(length(time)-1)
    if v(i)>v(i+1)
        braking_energy(i)=0.5.*mass.*(v(i+1)-v(i)).^2;
    end
    if v(i)<v(i+1)
        acceleration_energy(i)=0.5.*mass.*(v(i+1)-v(i)).^2;
    end
end

figure(1);
plot(time,v);
xlabel('time');
ylabel('speed');
title('time vs speed')

figure(2)
plot(time,braking_energy,'color','r');
hold on;
plot(time,acceleration_energy,'color','g');
xlabel('time');
ylabel('acceleration/braking_energy');
legend('braking energy','acceleration energy');
title('acceleration energy and braking energy');

% total energy
total_brake_energy=(sum(braking_energy)/1000) %in KJ
total_acceleration_energy =(sum(acceleration_energy)/1000) %in KJ
EXPLANATION
- first, an excel file 'timevsspeed.xlsx' is created and read through xlsread command
- time and speed are inputted from excel file as well
- speed is converted from km/h to m/s and mass is given
- then arrays are created for braking and acceleration energy
- for loop is executed with if conditions using energy formula
- then figures are plotted
- finally, the total braking and acceleration energy is calculated.
OUTPUT
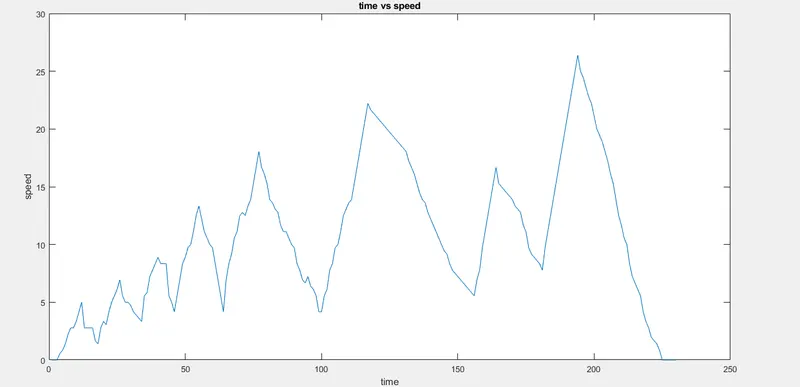
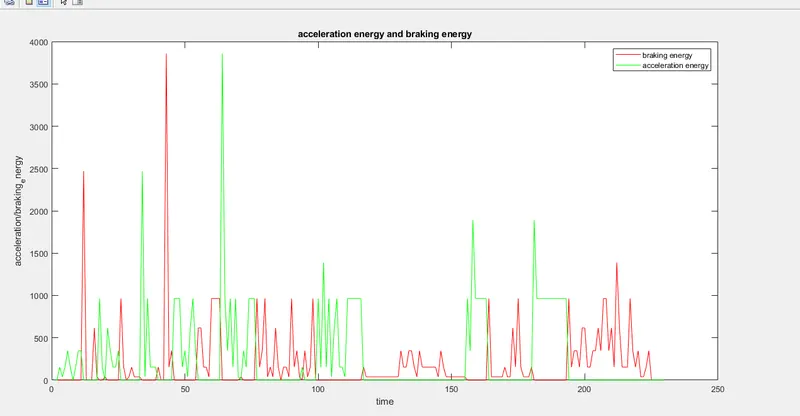
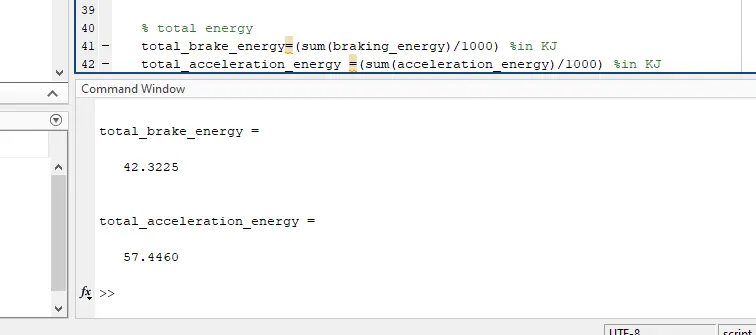
- For the considered drive cycle (speed vs time excel file) the required braking energy will be 42.3225 KJ
RESULT
- Thus the energy required for braking for a defined driving cycle is calculated using Matlab
excel file: https://docs.google.com/spreadsheets/d/1ykNywpWCXWKO4nbmFfDv_2AWVEakcRqu/edit?usp=sharing&ouid=115981456646120318324&rtpof=true&sd=true
2. Why electric motor can’t develop braking torque at a high speed similar to starting? How electric and mechanical brakes are coordinated?
REGENERATIVE BRAKING
- The moving vehicles will have a lot of kinetic energy. when they are slowing down or braking is applied this kinetic energy can be converted to electric energy through an electric motor acting as a generator and able to be used immediately or stored in a battery through a power converter.
- When the brake pedal is pressed, negative torque is generated in the motor against the direction of motor speed. now the motor acts as a generator receiving mechanical power from the load and converts it to electrical energy.
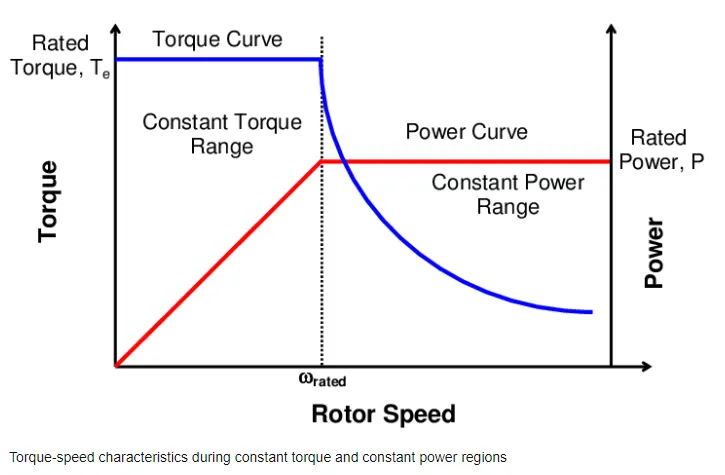
from the above torque-speed characteristics during constant torque and constant power region graph, we can understand that
- As an electric motor starts in the constant torque region will have lower speed and higher torque
- once the speed reaches the constant power region, the torque will be reduced and the speed will be higher.
- so when we are slowing or braking the vehicle at a constant power region, the speed will be higher and the torque generated against the speed of the motor which is called braking torque will be negative. hence the braking torque cannot be as high as accelerating torque and will be lesser. It is considered one of the limitations of regenerative braking.
electric and mechanical brakes
- mechanical brakes are frictional brakes that use brake pads or shoes to stop a vehicle.
- a vehicle without a brake is still able to slow down or stop at a higher distance and higher time. but for an immediate stop or slow down of a vehicle mechanical brakes are used.
- In an electric motor vehicle, we are using both mechanical and regenerative braking. both are in coordination.
- there are 2 types of brake control strategy,
1. series - where regenerative/mechanical braking is used one after another. they can be customized according to the comfort of the driver and energy efficiency.
2. parallel - where both regenerative and mechanical braking is used at a time. for example EDIB - Nissan
Electric Driven Intelligent Brake
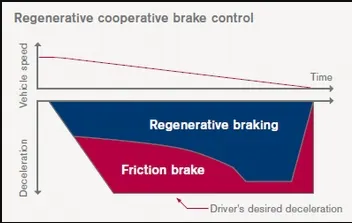
- both regenerative and mechanical braking is controlled by EDIB with the help of a pedal sensor, ECU which controls the motor, and hydraulic pressure of the braking system.
- when the vehicle speed is higher and since the braking torque of regenerative is less, we can see that the percentage of frictional brake is higher than the regenerative.
- with the speed decreasing, we can observe that the regenerative braking percentage is more than the friction brake.
we can conclude that when applying the brake at a higher speed, frictional brake contribution is more than the regenerative. and at a lower speed, regenerative braking is used more which will result in overall efficiency and effectiveness.
3. AIM
- To make a MATLAB program that plots the contour of given motor speed, torque, and efficiency values.
For the efficiency calculation, we need to consider the losses,
Copper losses - the armature conductors are made of copper material, due to the armature resistance experiences current losses. they can be defined as I^2R. since torque is proportional to the current, they can be defined as Kc*T^2. where Kc is the copper loss constant
Iron losses - are mainly due to the magnetic field effect and are also termed magnetic losses. they are defined as Ki*W, where Ki is the iron loss constant.
Windage losses - they are due to mechanical or frictional loss in the machine. they are defined as Kw*W^3, they depend on the size and shape of the motor and the amount of windage loss.
PROGRAM
clear all
close all
clc

x = linspace(1,1000);   %speed in rad/sec
y = linspace(1,250);    %torque Nm
%losses
Kc = 0.2;               %copper loss constant
Ki = 0.008;             %iron loss constant
Kw = 0.00001;           %windage loss constant
Cl = 20;                %constant loss of motor

[X,Y] = meshgrid(x,y);  %2D to 3D
output_power =(X.*Y);   %power=speed*torque

B = Kc*(Y.^2);          %copper losses
C = Ki*X;               %iron losses
D = Kw*(X.^3);          %windage losses

input_power = output_power + B + C + D + Cl;
Z = output_power./ input_power;

V = [0.70,0.75,0.80,0.85,0.90,0.91,0.92,0.93]; % efficiencies

contour(X,Y,Z,V);       % contour plot
xlabel('speed rad/sec');
ylabel('torque Nm');
legend('70%,75%,80%,85%,90%,91%,92%,93%');
EXPLANATION
- speed and torque values are given through linspace.
- then various constants are given for various losses.
- then meshgrid command is used to convert 2d to 3d array
- output power is calculated using power formula
- then B(copper loss), C(iron loss), D(windage loss) are calculated using loss equations.
- input power is calculated by adding output power with all the calculated losses.
- efficiencies are calculated.
- then we set efficiencies for the contour plot
- contour command is used for plotting.
OUTPUT
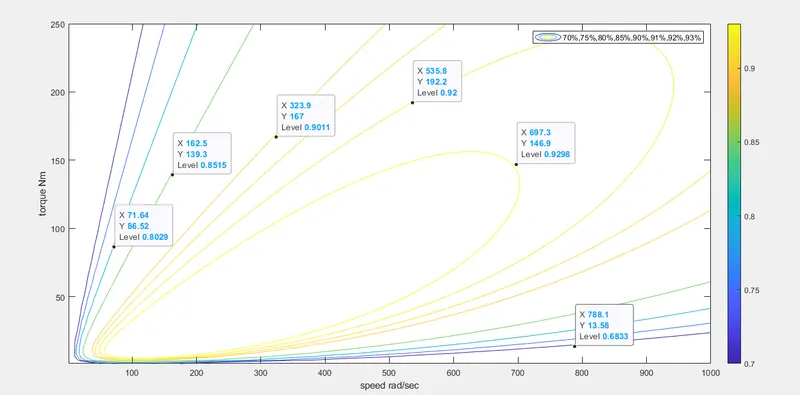
- from the plot, we can observe efficiencies (70%,75%,80%,85%,90%,91%,92%,93%) for various speed and torque values
- the maximum of 93% is achieved when the speed is less than 700 and torque is less than 150 approx.
- by this plot, we can easily able to find the efficient points, and accordingly, the speed and torque can be controlled.
RESULT
- Thus the contour plots of motor speed, torque, and efficiency values are plotted using a Matlab program.
Attachment .m file: https://drive.google.com/file/d/1yx64ySDpoXJtZRKsoVRiIUyDYtMUwMVS/view?usp=sharing