Week-11 Challenge: Braking
Q. 1. For a defined driving cycle, calculate the energy required for braking.
Ans.
Driving Cycle:
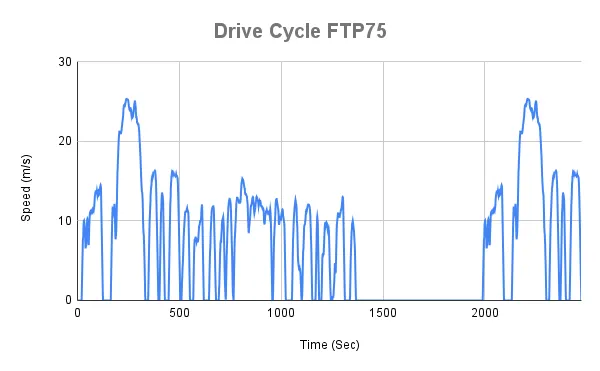
Above figure shows the Drive Cycle FTP75 plot which I used for calculating the energy required for braking. This drive cycle's total time is 2474 sec and the speed count in m/sec.
Calculation:
Let's assume the total weight of the vehicle is 1000 Kg.
For calculation I used Excel.
From this drive cycle I determine deceleration with respect to time in (m/sec^2) by using deceleration formulas same as acceleration formulas.
Deceleration = Speed difference/Time difference
The braking force in N is:
Braking Force = - (Vehicle weight * deceleration)
Note: -ve sign for deceleration
The Braking Power in Watts is:
Braking Power = Braking Force * Speed of vehicle
The total energy required for braking in KWh is:
Total Braking Energy = Sum of all braking power with respect to time/(1000*3600)
So the energy required for braking is 1.66 KWh for FTP75 Drive Cycle.
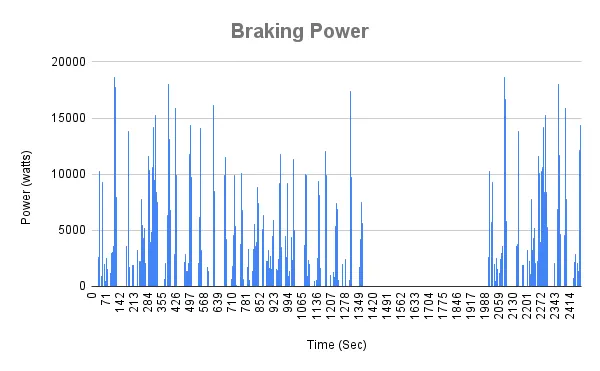
Below Figure shows the Braking power required with respect to time.
Attached the excel file for reference ‘Braking Energy.xlsx’
Q. 2. Why electric motor can’t develop braking torque at high speed similar to starting? How electric and mechanical brakes are coordinated?
Ans.
- We can change the speed and torque of the motor as per our requirement at a certain limit with some types of speed control methods.
- After a certain limit we can't take constant torque due to the motor limitation.
- For example we change the speed and torque of the Induction Motor with the help of VFD drives. Below figure shows the speed torque characteristics of Induction Motor with VFD drives.
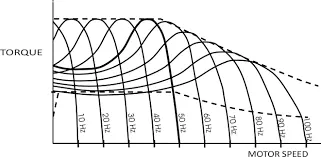
- Above figure we can see that after 50 Hz frequency torque gradually reduces and speed increases.
- Motor operated at constant torque and constant power regions. In the constant torque region the motor operated at constant torque at different speeds.
- In a constant power region the motor operates at constant power but in that torque it reduces as motor speed increases.
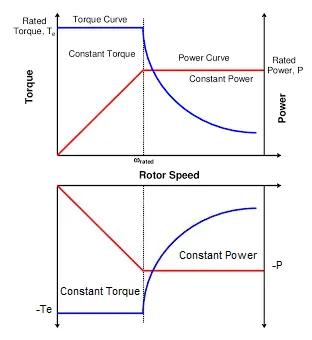
- In the above figure we can see the upper plot is quadrant 1 and lower plote is quadrant 4 speed torque characteristics i.e. forward motoring and forward braking speed torque characteristics respectively.
- The speed of the motor is similar in both cases but the torque is negative in forward braking mode and positive torque in forward motoring mode.
- We can see that in the above figure, after rated speed torque gets reduced after increasing the motor speed.
- At higher speeds the motor torque is less than the starting torque in both the cases.
- That's why electric motors can’t develop braking torque at a high speed similar to starting. Therefore we used mechanical brakes with electric braking in EV applications.
How electric and mechanical brakes are coordinated?
Regenerative Braking: (Electric Brake)
- If we want to apply only a regenerative or electric brake then no need to press the brake pedal. The only thing to do is release the acceleration pedal.
- But regenerative braking takes some time to stop the vehicle due to some limitations.
- An electric motor can’t develop braking torque at high speed similar to starting torque.
- The battery charging current limit is lower than discharging current limit.
- For regenerative required bidirectional power converter.
Brake Control Strategies:
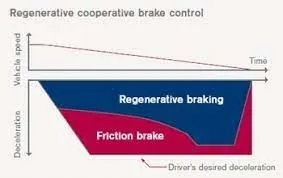
- If we want to stop the vehicle in an emergency or faster than the regenerative braking, then we need to apply both electric and mechanical brakes.
- There are two braking strategies one is series braking and another is parallel braking. In series brakes applied one after another i.e. electric then mechanical brake or vice versa. And in parallel braking, both brakes are applied at a time.
- In this case, if we want more comfort then we need to compromise with battery charging energy and vice versa.
- There is one more braking technology, name as ‘Electric Driven Intelligent Brake’ (EDIB)
Electric Driven Intelligent Brake (EDIB):
- This technology is used in Nissan Leaf vehicle.
- In that technology at high vehicle speed regenerative braking is less used and mechanical brakes is more used
- At the low speed opposite happens, high regenerative braking used and low mechanical brakes used.
Q. 3. Make a MATLAB program which plots contour of given motor speed, torque and efficiency values. Attach the code as a .m file attach a screenshot of all the plots.
Ans.
Contour Plot:
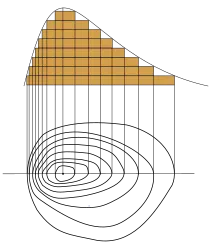
A contour plot is a graphical technique for representing a 3-dimensional surface by plotting constant z slices, called contours, in a 2-dimensional format. That is, given a value for z, lines are drawn for connecting the (x,y) coordinates where that z value occurs.
Motor Parameters:
Copper Loss Coefficient Kc = 0.2
Iron Loss Coefficient Ki = 0.008
Windage Loss Coefficient Kw = 0.00001
Constant Loss = 20
Copper Loss = Torque^2 * Kc
Iron Loss = Speed * Ki
Windage Loss = Speed^3 * Kw
MATLAB Code:
clear all

close all

clc

x = linspace(1,1000);  % motor speed (rad/sec)

y = linspace(1,250);   % Motor Torque (Nm)

% allocate motor losses

Kc = 0.2; % copper loss

Ki = 0.008; % iron loss

Kw = 0.00001; % windage loss

ConstL = 20; % constant loss

% now make mesh

[X,Y] = meshgrid(x,y);

OutputPower = (X.*Y);  % Power = Torque * Speed

B = (Y.^2)*Kc;  % Copper loss

C = X*Ki;  % Iron loss

D = (X.^3)*Kw;  % Windage Loss

InputPower = OutputPower + B + C + D + ConstL;

Z = OutputPower./InputPower;

% We now set the efficiencies for which a contour

% Will be plotted

V = [0.70,0.80,0.85,0.90,0.91,0.92,0.925,0.93];

box off

grid off

contour(X,Y,Z,V);

xlabel('Speed (rad/sec)')

ylabel('Torque (Nm)')

title('Efficiency of Motor')
Contour Plot:
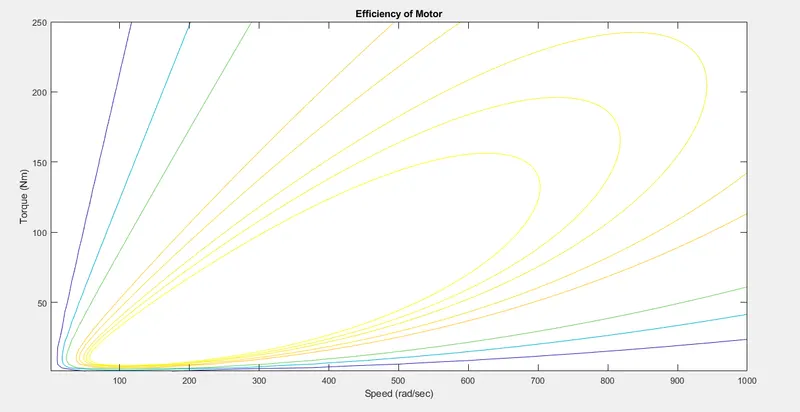
In the above figure, we can see that the motor achieves different efficiency at different speeds and torque.
Attached the script file for reference ‘Contour_plot_of_motor.m’