Week-11 Challenge: Braking
AIM -
1. To calculate the energy required for braking , for a defined driving cycle.
2. To find out why electric motor can’t develop braking torque at high speed similar to starting .
3. To make a MATLAB program which plots contour of given motor speed, torque and efficiency values.
OBJECTIVE 1 - To calculate the energy required for braking , for a defined driving cycle.
Brake - A brake is a mechanical device that inhibits motion by absorbing energy from a moving system. It is used for slowing or stopping a moving vehicle, wheel, axle, or to prevent its motion, most often accomplished by means of friction.
Equation For Braking Energy Calculation -
E = 1/2 * m * (Vf - Vi )^2
Drive Cycle -
Preparing Drive Cycle in google spreadsheet -
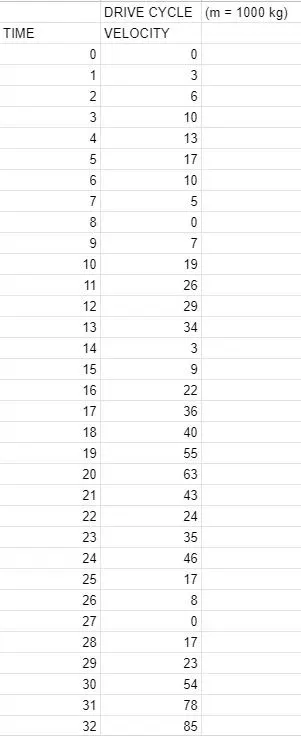
Keeping , mass of vehicle = 1000 kg constant
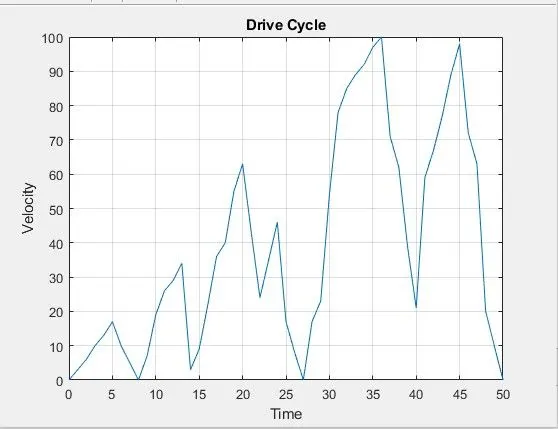
Drive Cycle Graph -
Calculation -
From the above graph -
Taking , Initial Velocity (Vi) = 63 m/s
Final Velocity (Vf) = 43 m/s
E = 1/2 * m * ( Vf- Vi )^2
E = 0.5 * 1000 * (63 - 43 )^2
E = 200 kJ
Conclusion - From the above calculation it is noted that 200 KJ of energy is released in the form of Heat Energy when brake is applied .
OBJECTIVE 2 - To find out why electric motor can’t develop braking torque at high speed similar to starting
Peak Acceleration Torque and Peak Deacceleration Torque are not be equal Because -
- To bring the motor in accelration from its stands position higher amount of Torque is required .
- Acceleration required is usually higher at low speed so higher amount of torque is required .
- At the higher speed the value of torque will be lower and braking operation is also comes into action so it is not possible to get the higher torque , i.e higher torque is not be obtained while braking.
Electric and mechanical brakes are coordinated -
1. Series - In series we apply Mechanical brake and Regenerative Electric Brake one after the another , i.e. One Brake at a time.
2. Parallel - In parallel both the brakes are applied simultaneously.
OBJECTIVE 3 - To make a MATLAB program which plots contour of given motor speed, torque and efficiency values.
MATLAB Program-
clear all
close all
clc
%A Programme For Plotting Efficiency Contours for Electric Motor
% X- axis corresponds to motor speed
% Y- axis corresponds to Torque
% First set-up arrray for range
x = linspace(1,1000); % speed ,N.B. rad/s NOT rpm.
y = linspace(1,250); % 0 to 40 N.m
% Allocate motor loss constants.
kc = 0.2; % For copper losses.
ki = 0.008; 5 % For iron losses.
kw = 0.00001 ;%For windage losses.
ConL = 20 ; % For constant motor losses.
% Using Mesh-Grid command
[X,Y] = meshgrid(x,y);
Outputpower = (X.*Y);% Torque x Speed = Power
B = (Y.^2)*kc; %Copper losses
C = X*ki; % Iron losses
D = (X.^3)*kw ; % Windage losses
Inputpower = Outputpower + B + C + D + ConL;
Z = Outputpower./Inputpower; % Efficiency of motor
% We now set the efficiencies for which a contour will be plotted.
V = [0.70,0.80,0.85,0.90,0.91,0.92,0.925,0.93];
box off
grid off
contour (X,Y,Z,V);
xlabel('Speed/rad.s^-^1'),ylabel('Torque/N.m');
title('Speed, Torque and Efficiency Characteristics Of Motor')
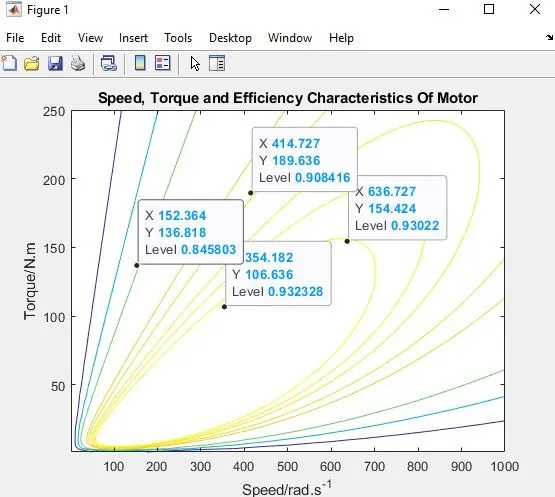
RESULT -
Conclusion-
From the above plot it is noted that at 160 N-m Torque and at 650 rad/sec angular speed highest efficiency is achieved which is 93% . Also higher Efficiency contour is the innermost one.