Project 1 - Parsing NASA thermodynamic data
AIM -
1) - To extracts the 14 co-efficients and calculates the enthalpy, entropy and specific heats for all the species in the data file.
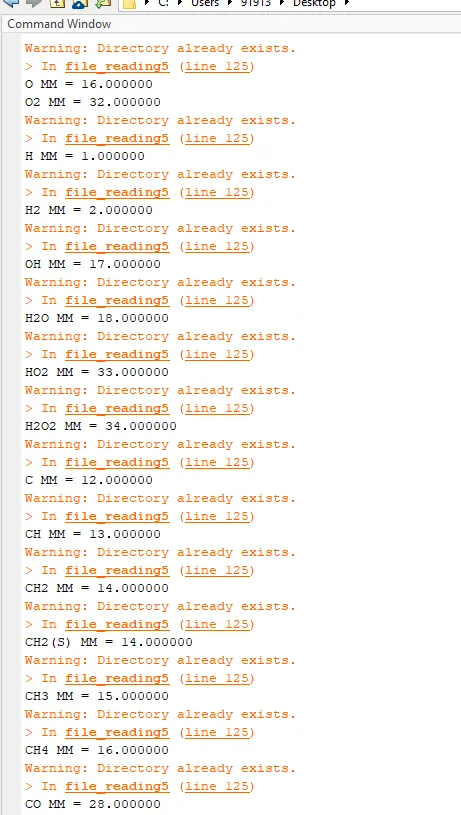
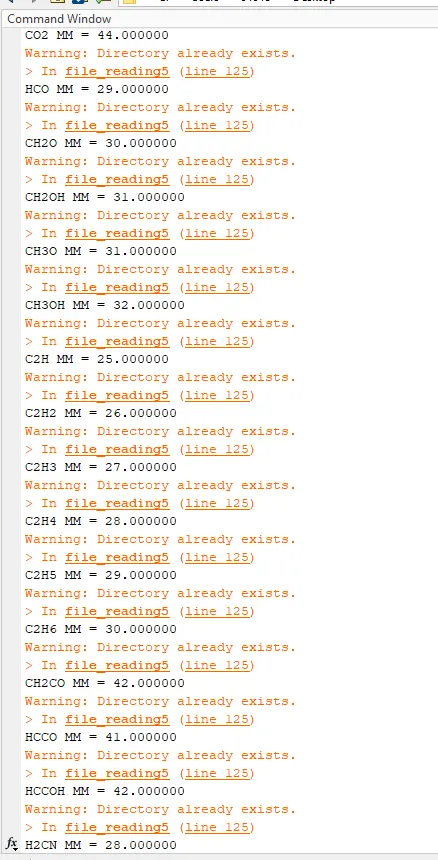
2) - To Calculate the molecular weight of each species.
3) - To show the variation of these parameters against corresponding temperature.
FILE PARSING : Parsing a file means reading in a data stream and building a memory model of the content of that data. This aims at facilitating perfoming some kind of transformation on the data.
FORMULA USED - To Calculate the Specific Heat , Enthalpy and Entropy.
THEORY -
- Specific Heat - The specific heat is the amount of heat per unit mass required to raise the temperature by one degree Celsius.It is a thermodynamic property.
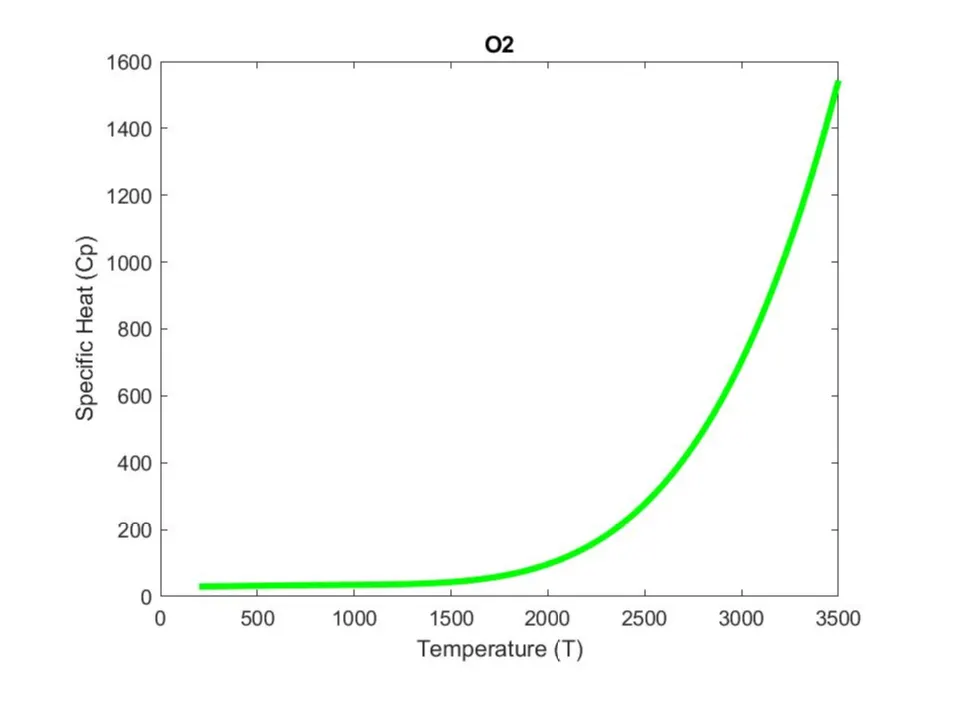
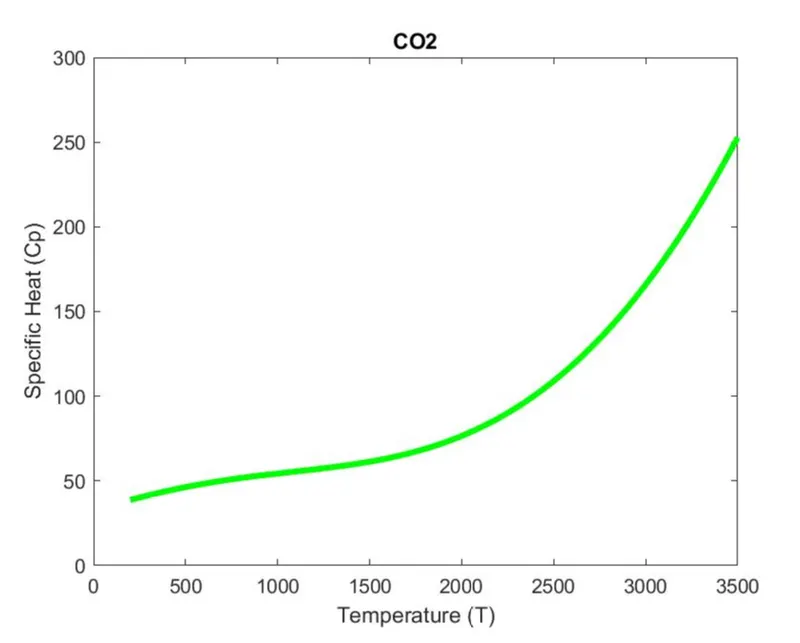
Cp = (a1 + a2 T + a3 T^2 + a4 T^3 + a5 T^4)R
- Enthalpy - The enthalpy H of a thermodynamic system is defined as the sum of its internal energy U and the work required to achieve its pressure and volume.
- H = U + pV,
where p is pressure, and V is the volume of the system.
Enthalpy is an extensive property; it is proportional to the size of the system (for homogeneous systems). As intensive property, the specific enthalpy h = H/m is referenced to a unit of mass m of the system, and the molar enthalpy Hm is H/n, where n is the number of moles.
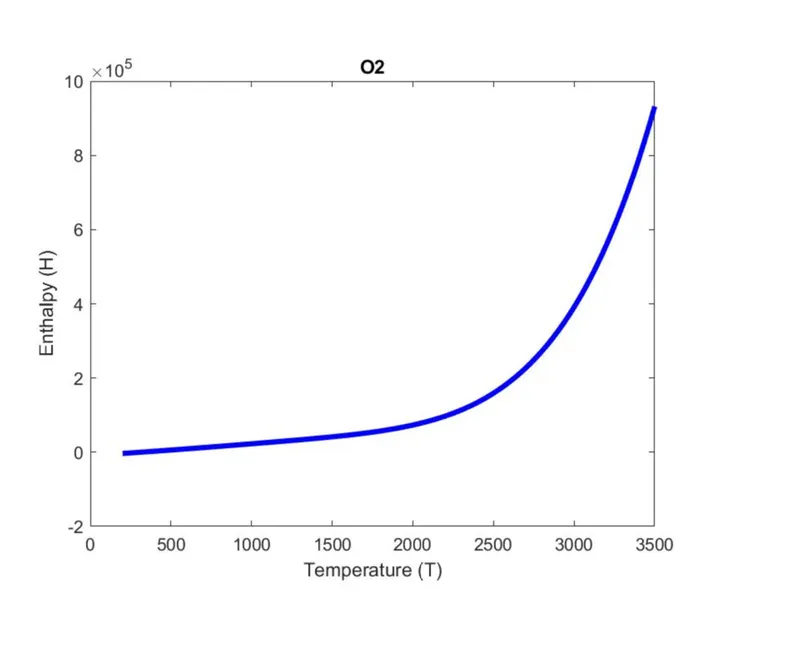
H = (a1 + a2 T/2 + a3 T^2/3 + a4 T^3/4 + a5 T^4/5 + a6/T)RT
- Entropy - Entorpy is an extensive property of thermodynamics.The entropy of an object is a measure of amount of energy which is unavailable to do work.
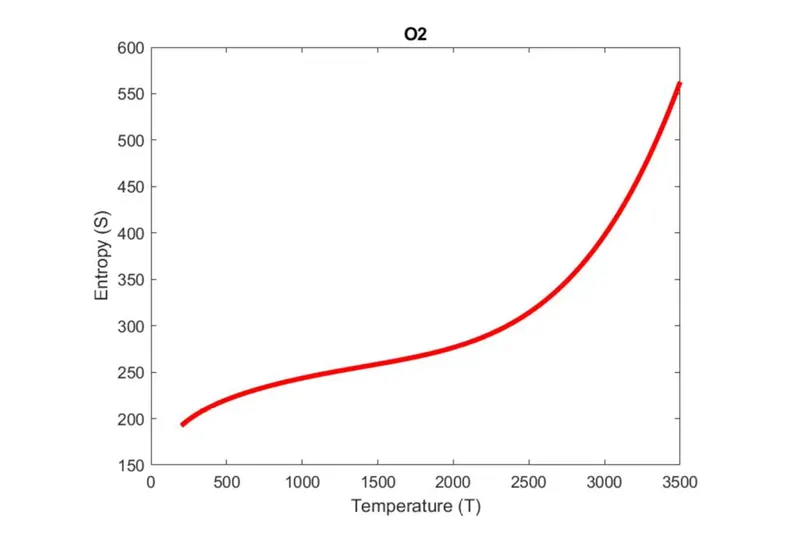
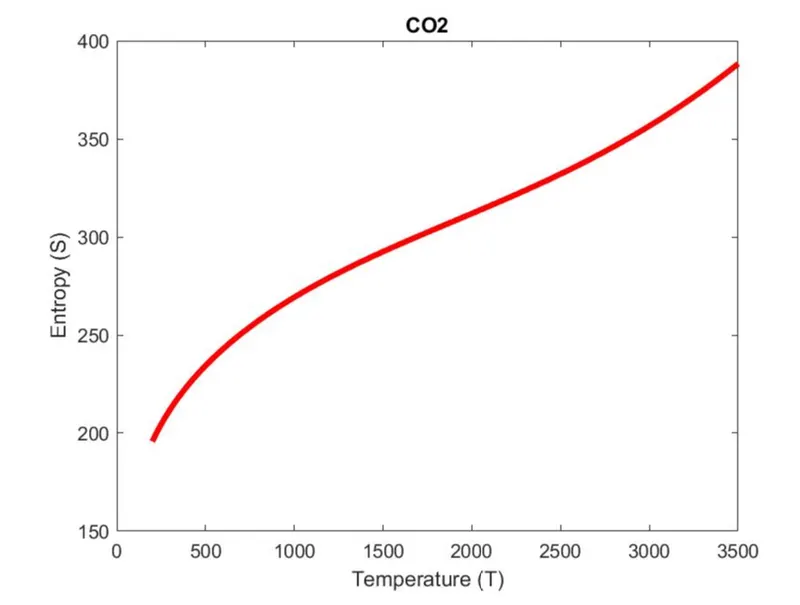
S = (a1 lnT + a2 T + a3 T^2/2 + a4 T^3/3 + a5 T^4/4 + a7)R
- Molecular Weight - The molecular mass (m) is the mass of a given molecule: it is measured in daltons. Different molecules of the same compound may have different molecular masses because they contain different isotopes of an element. The related quantity relative molecular mass, as defined by IUPAC, is the ratio of the mass of a molecule to the unified atomic mass unit (also known as the dalton) and is unitless. The molecular mass and relative molecular mass are distinct from but related to the molar mass. The molar mass is defined as the mass of a given substance divided by the amount of a substance and is expressed in g/mol. The molar mass is usually the more appropriate figure when dealing with macroscopic (weigh-able) quantities of a substance.
CODE --
clear all  % clears the work space
close all  % closes all the plot
clc        % closes all the command
f1 = fopen('THERMO.dat','r');

line1 = fgetl(f1);
line2 = fgetl(f1);

comment_1 = fgetl(f1);

comment_2 = fgetl(f1);

comment_3 = fgetl(f1);

A = strsplit(line2,' '); % split string on the elements of delimeter
global_low_temperature = str2num(A{2});
global_mid_temperature = str2num(A{3});
global_high_temperature = str2num(A{4});

%species

 for i=1:53
    species = fgetl(f1);
     species = strsplit(species,' ');
    species_name = species{1};
    local_low_temp = str2num(species{end-3});
    local_mid_temp = str2num(species{end-1});
    local_high_temp= str2num(species{end-2});
    tline_1 = fgetl(f1);

    A1 = findstr(tline_1,'E');

    a1 = str2num(tline_1(1:(A1(1)+3)));

    a2 = str2num(tline_1((A1(1)+4):(A1(2)+3)));

    a3 = str2num(tline_1((A1(2)+4):(A1(3)+3)));

    a4 = str2num(tline_1((A1(3)+4):(A1(4)+3)));

    a5 = str2num(tline_1((A1(4)+4):(A1(5)+3)));

    tline_2 = fgetl(f1);

    A2  = strfind(tline_2,'E');

    a6  = str2num(tline_2(1:(A2(1)+3)));

    a7  = str2num(tline_2((A2(1)+4):(A2(2)+3)));

    a8  = str2num(tline_2((A2(2)+4):(A2(3)+3)));

    a9  = str2num(tline_2((A2(3)+4):(A2(4)+3)));

    a10 = str2num(tline_2((A2(4)+4):(A2(5)+3)));


    tline_3 = fgetl(f1);

    A3  = findstr(tline_3,'E');

    a11 = str2num(tline_3(1:(A3(1)+3)));

    a12 = str2num(tline_3((A3(1)+4):(A3(2)+3)));

    a13 = str2num(tline_3((A3(2)+4):(A3(3)+3)));

    a14 = str2num(tline_3((A3(3)+4):(A3(4)+3)));

    %Folder for each species


    T = linspace(local_low_temp,local_high_temp,100);

    R = 8.314;

   %Calculation based on upper amd lower temperature

   for j = 1:length(T)
       if T(j)<local_mid_temp

   Cp(j) = (a1 + a2.*T(j) + a3.*T(j).^2 + a4.*T(j).^3 + a5.*T(j).^4 ).*R;

   H(j)  = (a1 + a2.*T(j)./2 + a3.*T(j).^2/3 + a4.*T(j).^3/4 + a5.*T(j).^4/5 + a6./T(j)).*R.*T(j);

   S(j)  = (a1.*log(T(j)) + a2.*T (j)+ a3.*T(j).^2/2 + a4.*T(j).^3/3 + a5.*T(j).^4/4 + a7).*R;

       else

   Cp(j) = (a8 + a9.*T(j) + a10.*T(j).^2 + a11.*T(j).^3 + a12.*T(j).^4 ).*R;

   H (j) = (a8 + a9.*T(j)/2 + a10.*T(j).^2/3 + a11.*T(j).^3/4 + a12.*T(j).^4/5 + a13./T(j)).*R.*T(j);

   S (j) = (a8.*log(T(j)) + a9.*T(j) + a10.*T(j).^2/2 + a11.*T(j).^3/3 + a12.*T(j).^4/4 + a14).*R;
       end
   end

   %PLOTTING
   % Temperature vs Entropy

    figure(1)
    plot(T,S,'linewidth',3,'color','r')
    title(species_name)
    xlabel('Temperature (T)')
    ylabel('Entropy (S)')

   % Temperature vs Enthalpy

   figure(2)
    plot(T,H,'linewidth',3,'color','b')
    title(species_name)
    xlabel('Temperature (T)')
    ylabel('Enthalpy (H)')


   % Temperature vs Specific Heat

   figure(3)
   plot(T,Cp,'linewidth',3,'color','g')
    title(species_name)
    xlabel('Temperature (T)')
    ylabel('Specific Heat (Cp)')

     mkdir(species_name);
     cd(species_name);
     saveas(1,'entropy.jpg')
     saveas(2,'enthalpy.jpg')
     saveas(3,'specific heat.jpg')

     cd ..

     MM = molecular_mass(species_name);

     p = sprintf('%s MM = %f' ,species_name,MM);

     disp(p)


      end

fclose(f1)
CODE EXPLANATION--
- In line 4 NASA THERMO.dat file is open using fopen command ,here we are reading the file using 'r'.
- Using fgetl command we extract each of the line in command window.
- First line is for header information followed by Global Temperature Values , Next 3 lines are comments which can be ignore.
- strsplit command is used to split string on the element of delimeter.
- From line 16 to 18 global temperature values are in the form of string to convert it into number we use str2num command.
- From line 22 onwards we have 53 species and 14 coefficients. Using forloop name of species and there coefficient is extracted.
- First fgetl command is used to get the species name and next 3 fgetl command is used to extract the coefficient values.
- strfind is used to find strings within other strings.
- mkdir command is used to create new folder.
- cd command is used change current folder.
- Different temperature values are asssumed for calculating Enthalpy , Entropy and Sp. Heat.
- Loop is used to for calculating Enthalpy , Entropy and Sp. Heat , for different temperature.
- With the help of plot command ,the calculated values of Enthalpy , Entropy and Sp. Heat are plotted against corresponding values of temperature.
- saveas command is used to save figure for specific file format.
CODE FOR MOLECULAR MASS --
%code for molecular mass
function MM = molecular_mass (species_name) %Function take species name as input and give MM as output

species = upper(species_name); %species stored in a string


elements = ['H' ,'C' , 'N' , 'O' , 'A' ]; %Element array is used to stored species_name

Atomic_weight = [1 , 12 , 14 , 16 , 40];%Atomic weight of each element is stored in array called Atomic_weight

MM = 0 ; %Molecular weight  initially set to 0.

for i = 1:length(species_name) %for loop is used to run species_name
    for j = 1:length(elements) %Is used to run entire length of elements
        if strcmp(species(i),elements(j)) %strcmp command is used to compare 2 string
            MM = MM + Atomic_weight(j);
            u = j;
        end
    end
    n = str2num(species(i)); %str2num command is used to convert string into number
    if n>1
        MM = MM + Atomic_weight(u)*(n-1);
    end
end
end
RESULTS--
Screen Shot Of Windows Where All The Plots Are Saved--

PLOTS OF -O2 ,N2 and CO2 Species -
1- O2 PLOT
*For Enthalpy
*For Entropy
*For Specific Heat
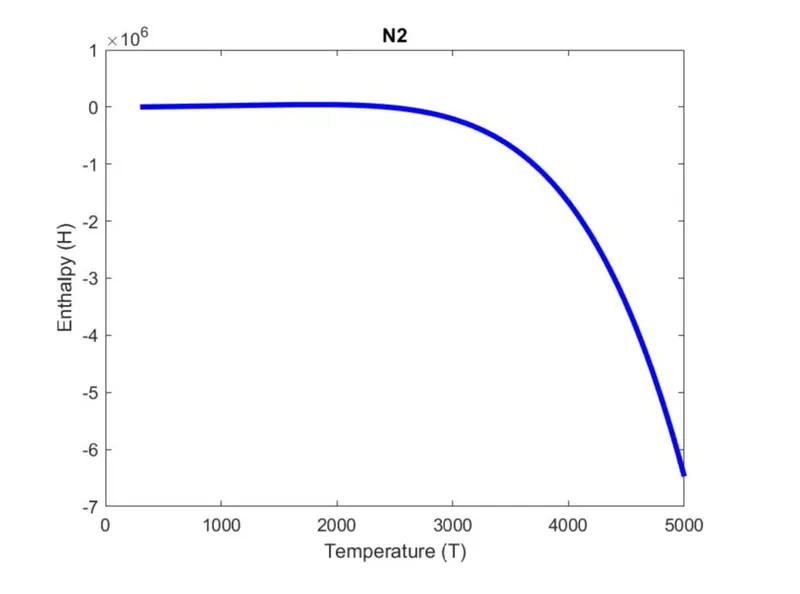
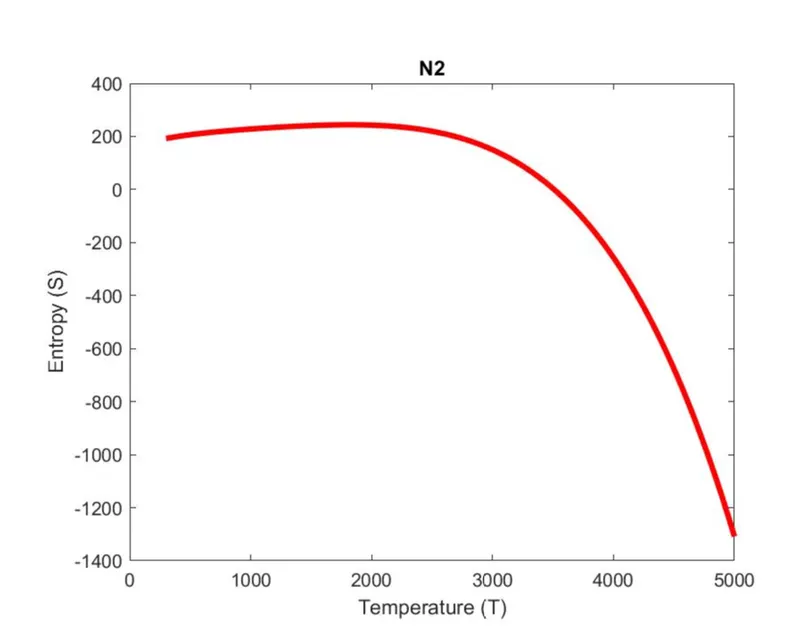
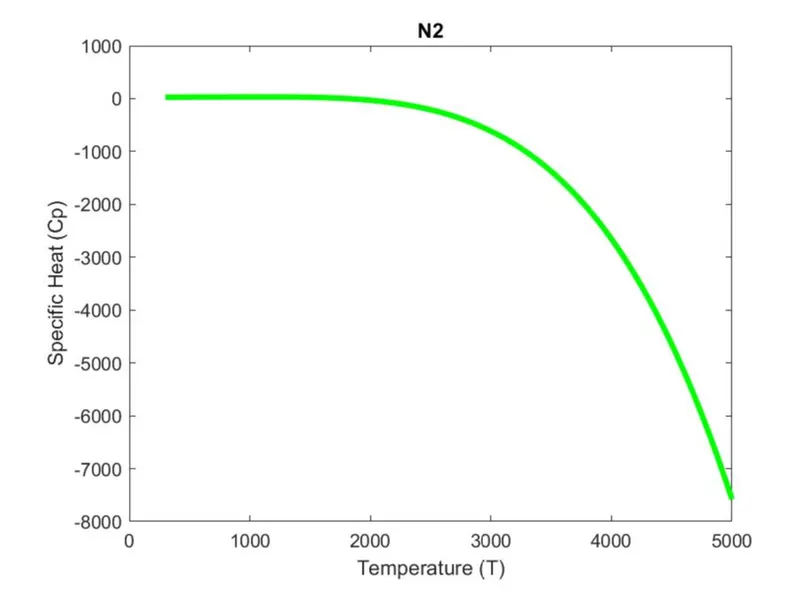
2 - N2 Plot -
*For Enthalpy
*For Entropy
*For Specific Heat
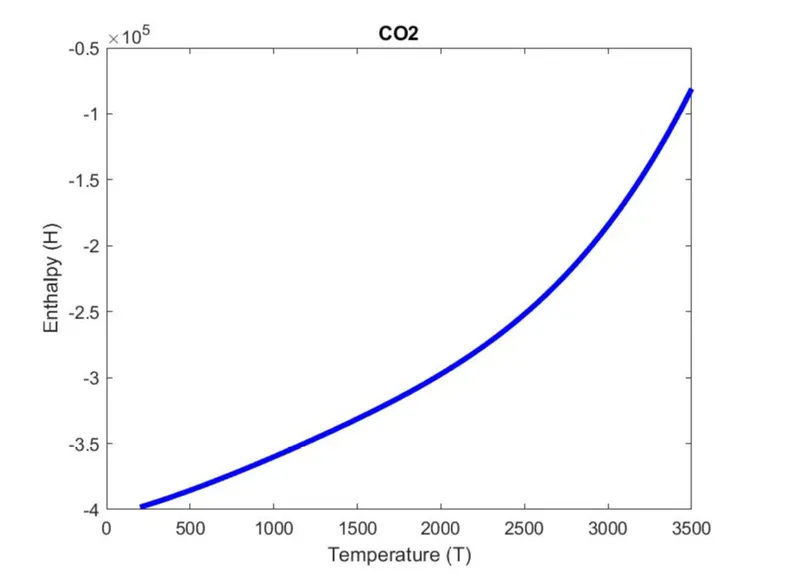
3. CO2 PLOT-
*For Enthalpy-
*For Entropy-
*For Specific Heat-
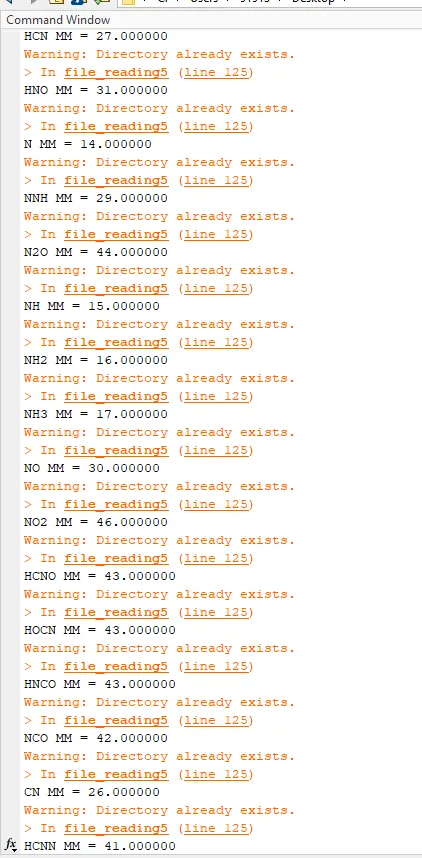
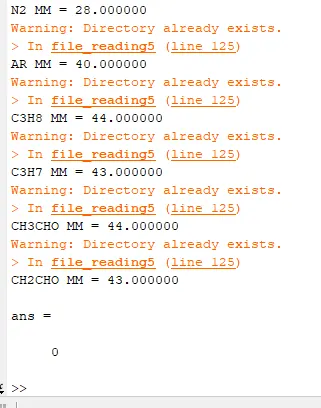
Screen Shot Of Molecular Weight Display In Command Window--
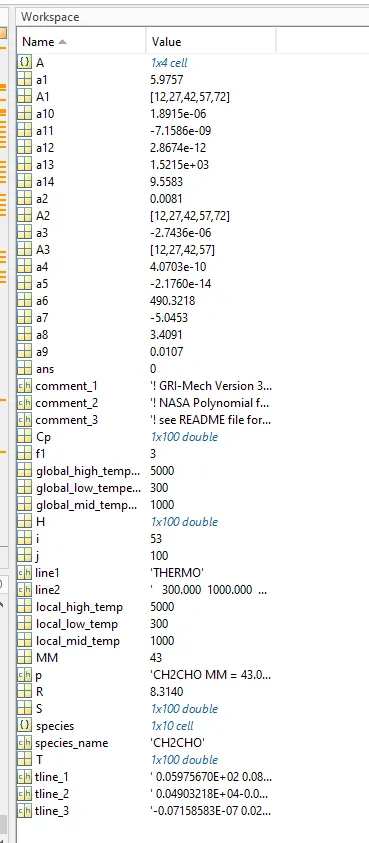
Work Space Output-