Week - 4
AIM-To implement control logic of a “washing machine” using Stateflow as per given sequence.
- If the power supply is available, the system gets activated
- If the Water supply is not available, stop the process & indicate through LED
- Soaking time should be 200s followed by Washing time of 100s.
- Then rinsing happens for next 20s & dryer runs for 50s
1.Washing Machine Model (Flow Chart)
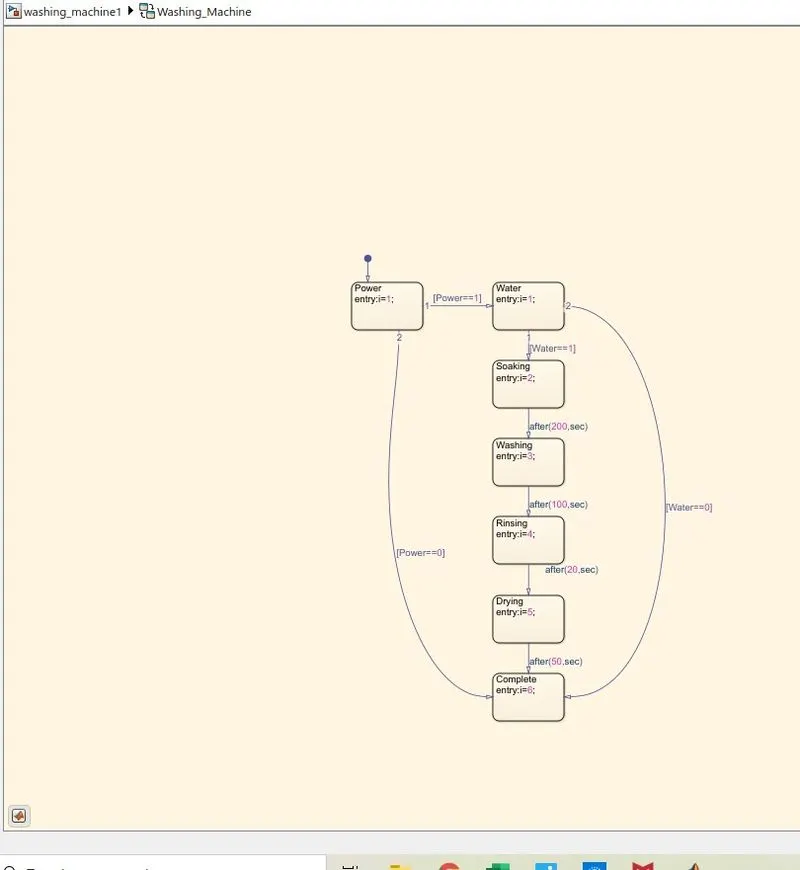
Main Model
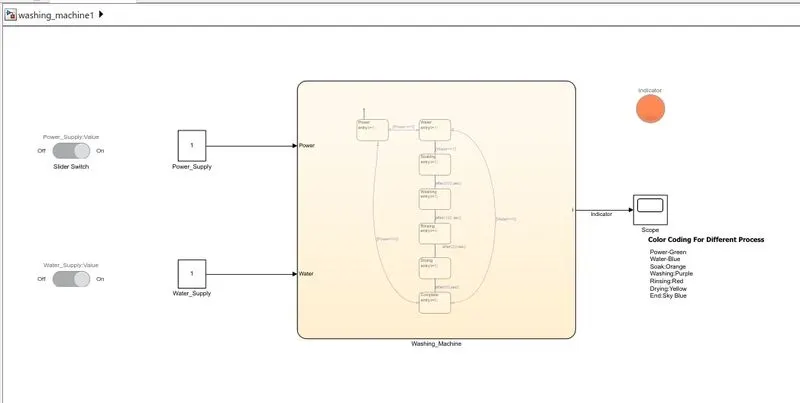
EXPLANATION
Block Used-
- Flow chart block
- Scope
- Constant Block
- Slider Switch
- Lamp
RESULTS
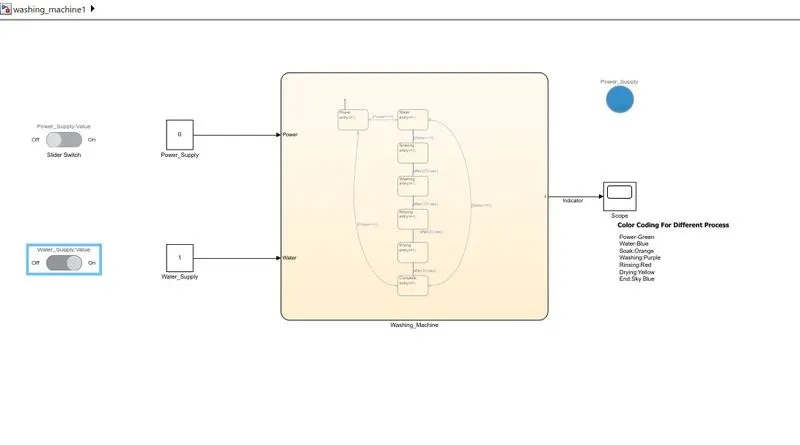
Case-1
Power and Water Supply OFF
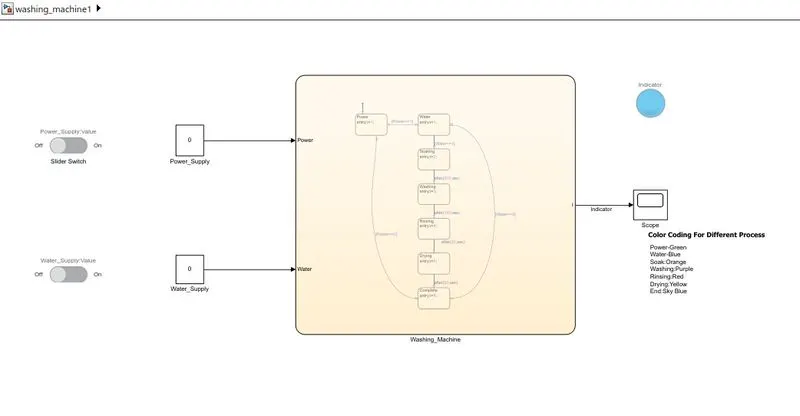
Power and Water supply is off that is constant value is "0", So indicator is indicating Sky Blue Color.
Case-2
Power ON and Water Supply OFF
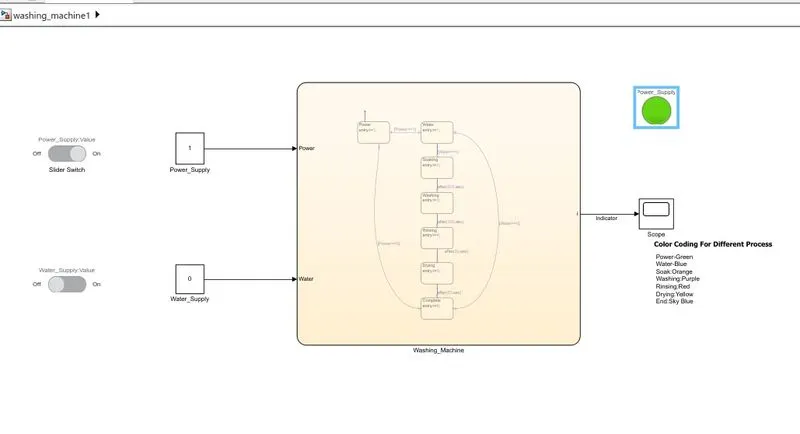
When power supply is ON lamp is showing Green color.
Case - 3
Power Supply OFF and Water Supply ON
When Water Supply is On LED lamp is showing Blue Color.
Case 4-
Power ON Water Supply ON Only Soaking Completed
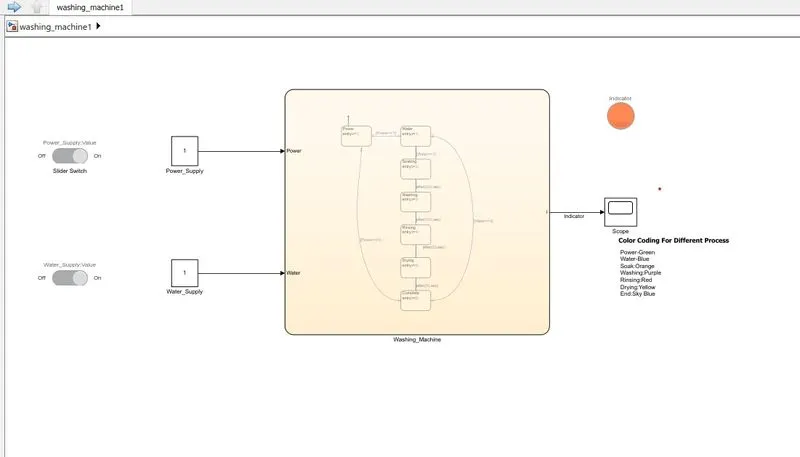
When both Power Supply and Water Supply is ON and soaking time is set to 200 second,soaking will be completed and it is indicated by the Orange Color LED.
Case-5
Power ON Water Supply ON ,Washing Completed After 200 second
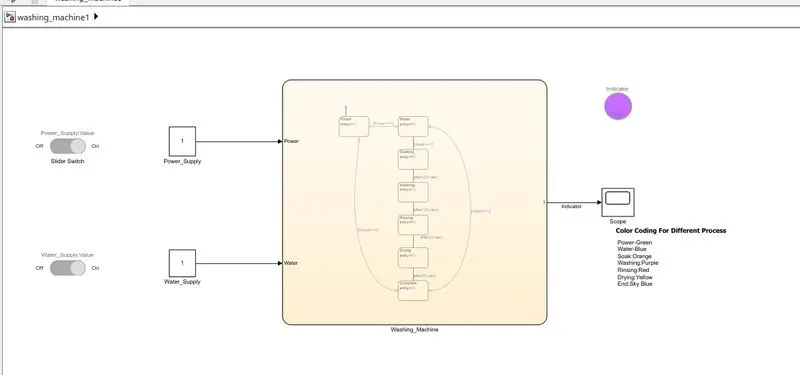
Case - 6
Rinsing Completed After 20 seconds
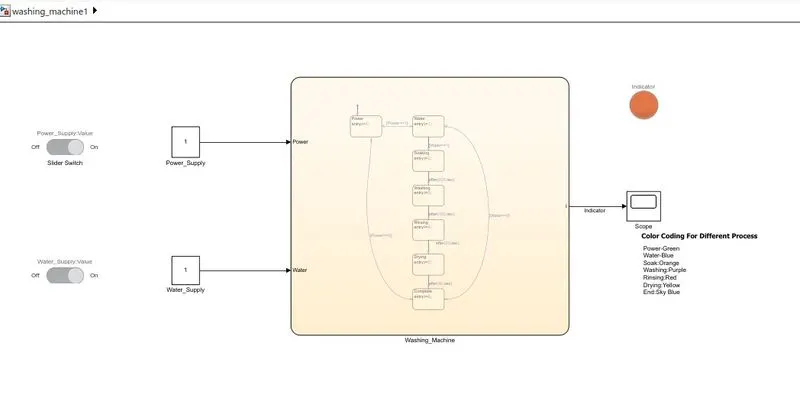
Stop time for Rinsing Operation is 320 seconds, LED is showing Red color for this Operation.
Case 7 -
Drying is completed after 370 seconds
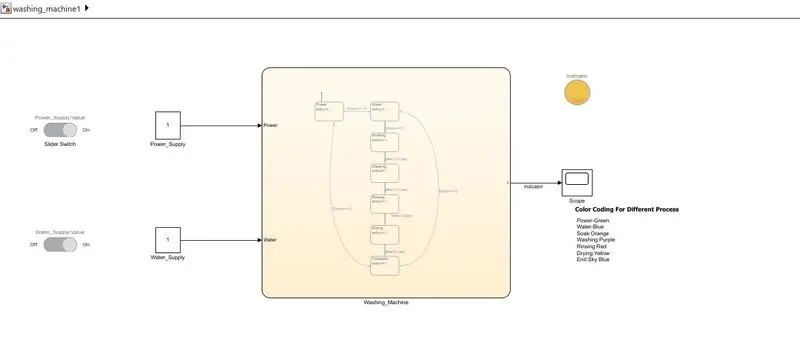
Drying is completed after 50 second of Rinsing Process,Yellow Color is shown by LED for Drying Process
Case - 8 -END
All process will be completed when Water Supply and Power Supply is ON
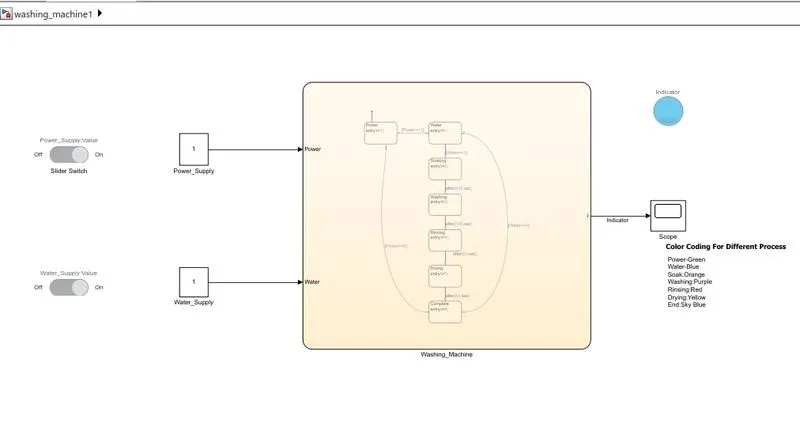
All process will be completed ,when stop time is being set to greater than 370 seconds,LED is showing Sky Blue Color.
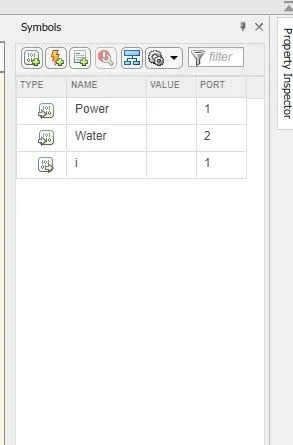
Symbols-
Graph-
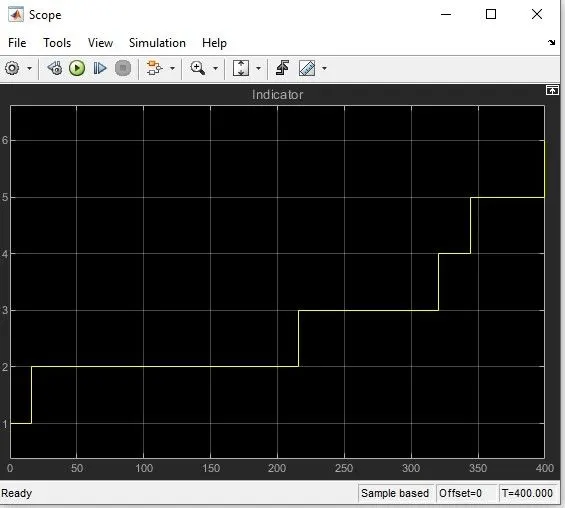
Above graph is showing the different stages of the Washing machine as per the given Time Value.
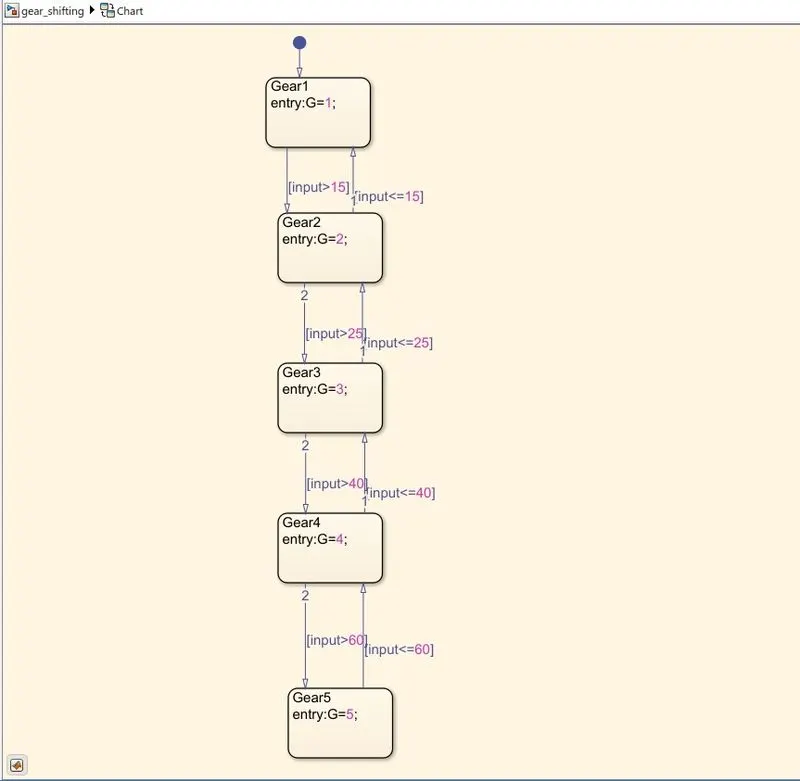
2. TO Make a Simulink chart for the “Gear shift” logic As per the given conditions-
Speed Range(kmph) Gear
0 to 15 1
16 to 25 2
26 to 40 3
41 to 60 4
Above 61 5
Flow Chart For Gear Shift -(Flow State)
Main Model -
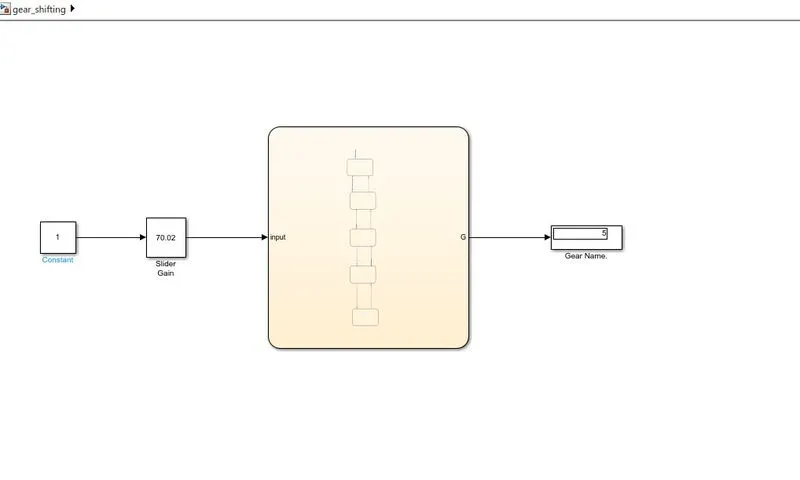
Blocks Used-
- Flow Chart
- Slider Gain Block - Is used to input the values from the chart.
- Constant block
- Display - is used to display the gear number as per given condition.
CASE 1.
When Speed Range Is Between 0 -15 kmph
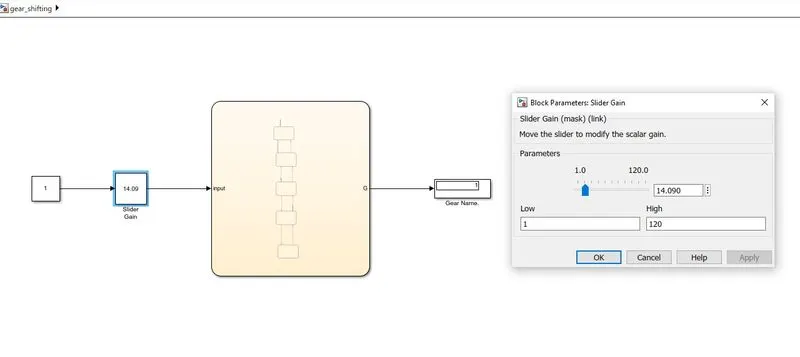
when the speed range is between 0-15 kmph vehicle will run on gear 1, as the display is showing .Also the value is set by using slider gain block parameter.
CASE 2.
When Speed Range is 16-25 kmph
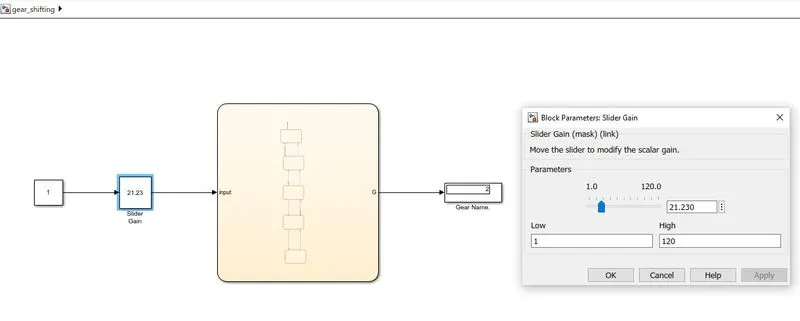
Vehicle is running on gear 2.
CASE 3.
Speed Range 26 - 40 kmph
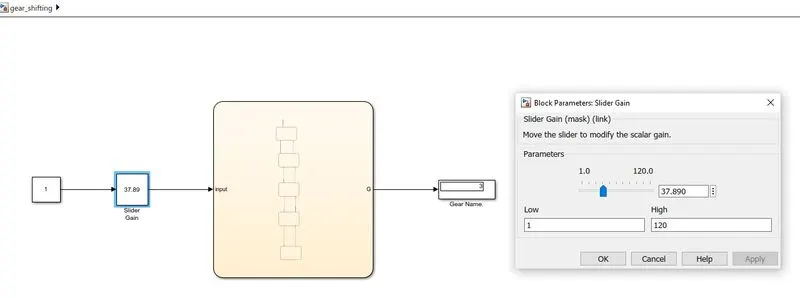
Vehicle is running on gear 3.
CASE 4.
Speed range 41 - 60 kmph
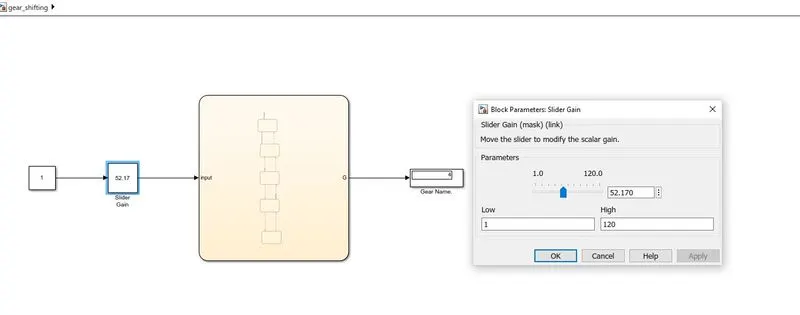
Vehicle run on gear 4.
CASE 5.
Speed Range Above 61 kmph
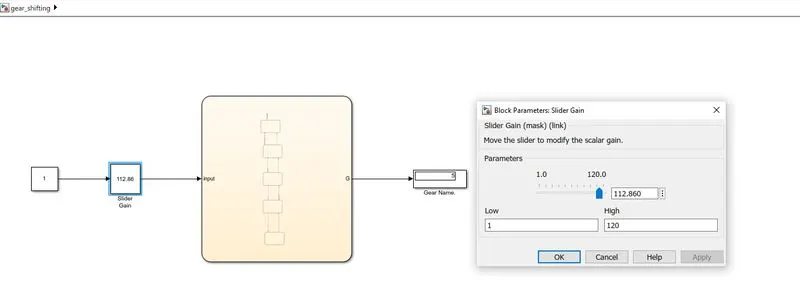
Vehicle will run gear 5 as the speed of vehicle is above 61 kmph.
RESULT-
Speed input and Gear number is displayed according to given conditions.