Simulink Model - Braking
Objectives:
- For a defined driving cycle, calculate the energy required for braking.
- Why electric motor can’t develop braking torque at high speed similar to starting? How electric and mechanical brakes are coordinated?
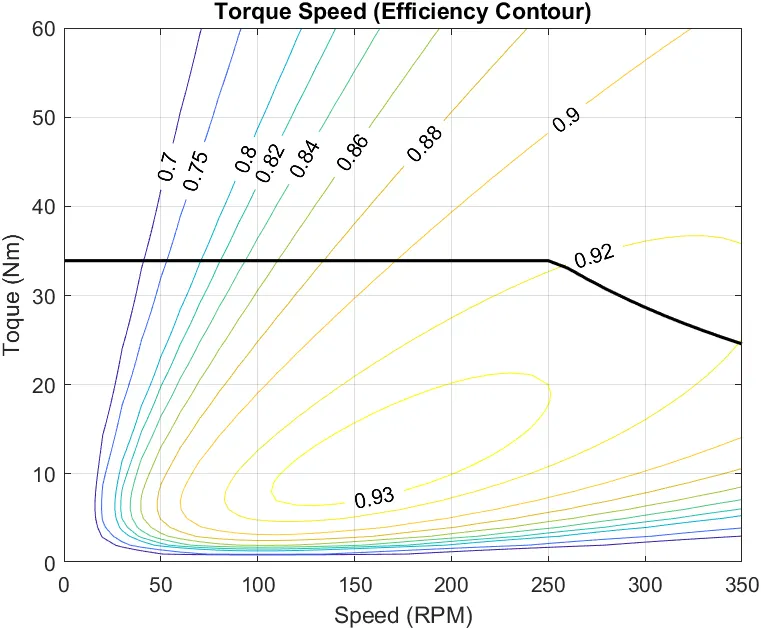
- Make a MATLAB program which plots contour of given motor speed, torque and efficiency values. Attach the code as a .m file attach a screenshot of all the plots.
#1 For a defined driving cycle, calculate the energy required for braking.
- using excel, a custom drive cycle is prepared. which is shown below.
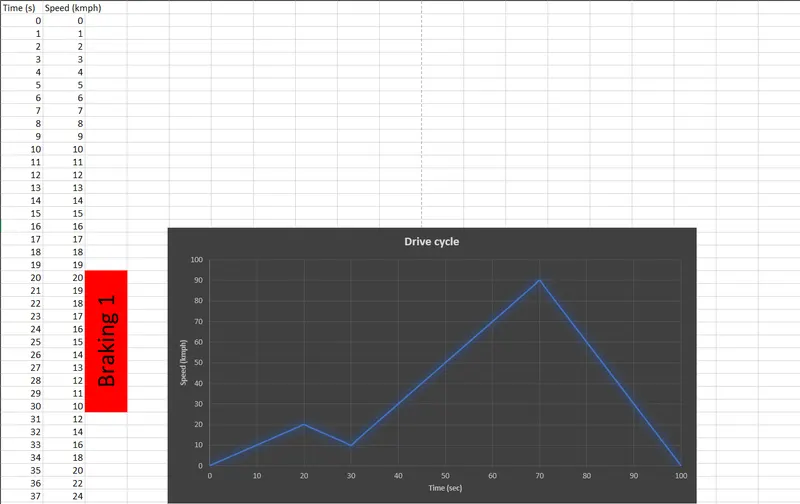
- There are braking zones in the drive cycle.
- Below images show the vehicle parameters and energy calculation are done
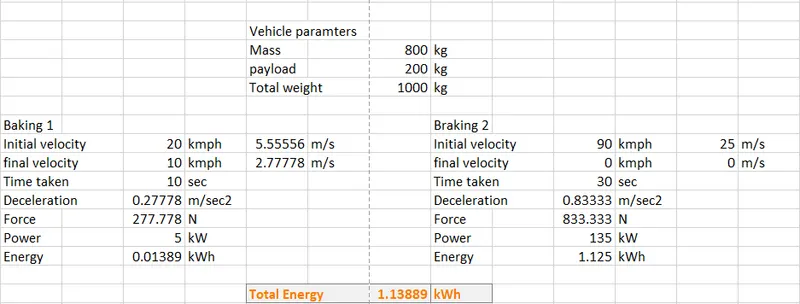
- Kinetic Energy: `1/2*m*(v_f-v_i)^2` J
- Power: `{KE}/t*1/{1000}` kW
- Braking Energy: `BE= P/{3600}*t (kWh)`
#2 Why electric motor can’t develop braking torque at high speed similar to starting? How electric and mechanical brakes are coordinated?
Why electric motor can’t develop braking torque at high speed similar to starting?
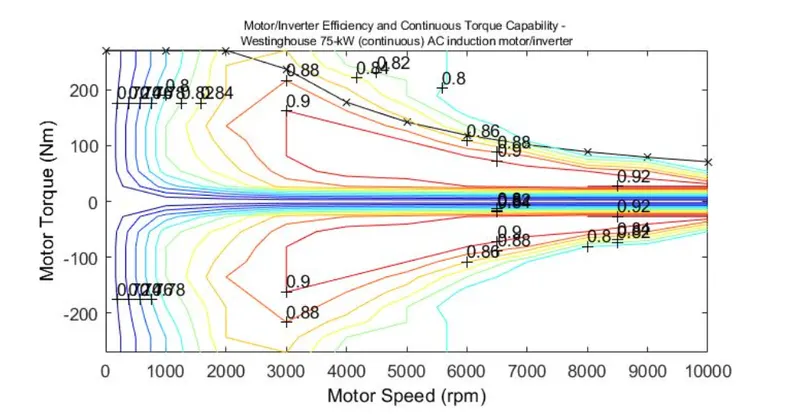
The figure represents forward motoring (positive torque and speed) and forward braking (negative torque and positive speed).
The braking torque in a electric motor is not as high as that of the accelaration torque at higher speeds.this can be attributed to many diffferent reasons.the rate of discharge of the battery is higher than the charging rate it can be said that the discharge rate can betwice as that rate of charging rate.The power converter is customised 3 phase inverters which are bi directional as it needs to convert regnerative braking energyback to dc current for the battery and this reduces the efficiency of the power converter at low speedsregenerative braking is very high as speed increases.
How electric and mechanical brakes are coordinated?
There are different ways of coordinating between the hydraulic brakes and regnerative brakes one of the brake control startegies involves series connection where both brakes are connected together which implies that in this scenario both brakes are used together and the next one in the parallel connection where either of the two barkes is operated individually whithout relying on one another depending on the braking requirements.
Types of control strategy
1.series: the braking is applied one after the other either of regenerative and mechanical braking is applied alternatively.
2.parallel:both the brakes are applied the regenarative and mechanical are applied in parallel
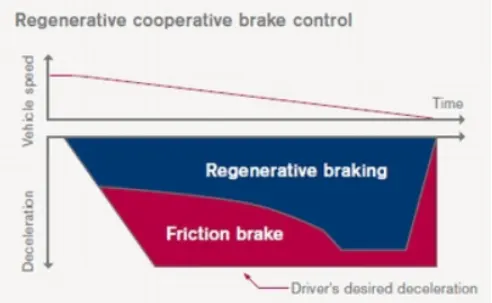
when the brake pedal is applied it supplies the hydrualic fluid to the disc to slow the tires at the same time when the accelaration pedal is lifted a certain in amount of electric brakes are applied at high speed since the braking force is required is a high large amount og hydrualic brakes are applied and once the speed is reduced and the torque value is also high so the elctric brakes become pre dominate so the battery charging occurs efficiently the ECU system with a feedback system to find the torque region and regenerative braking predominates in the high torque region.
#3 Make a MATLAB program which plots contour of given motor speed, torque and efficiency values. Attach the code as a .m file attach a screenshot of all the plots.
Governing Equations:
- Power, `P = T*omega` (watts)
- Copper losses, `C_u = k_c*T^2`
- Iron Losses, `I = k_i*omega`
- Windage losses, `W = k_{omega} *omega^3`
- Constant losses = C
- Where
- `omega` = Speed(rad/sec)
- T = Torque
- `k_c` = copper losses constant
- `k_i` = iron losses constant
- `k_{omega}` = windage losses constant.
Matlab Program:
clear all .
close all
clc

P_rated = 8600; %rated power in watts
T_rated = 33.9; %rated torque in Nm
N_rated = P_rated/T_rated*30/pi; %rated angular velocity (rad/sec)

W = [0:10:350]; %RPM for calculations
T = [0:1:60]; %Torque for calculations
[X,Y] = meshgrid(W,T);
pow_out = X.*Y;

%Loss Constant values
kc = 0.5;
ki = .0005;
kw = .00001;

%power losses in watts
cl = kc*(Y).^2; %copper losses
il = X.*ki; %iron losses
wl = X.^3*kw; %windage losses
ml = 20; %constant power losses

%input power
pow_in = pow_out+cl+il+wl+ml;

%Efficiency
z = pow_out./pow_in;

%torque ranges
Tl = P_rated./(W);

Tl (Tl>T_rated) = T_rated;

%plotting
contour(W,T,z,[0.7,0.75,0.80,0.82,0.84,0.86,0.88,0.90,0.92,0.93],'showtext','on','labelspacing',800)
hold on
plot(W,Tl,'k','linewidth',1.5)
xlabel('Speed (RPM)')
ylabel('Toque (Nm)')
title('Torque Speed (Efficiency Contour)')
grid on
Output Plot:
Excel and Matlab script Files:
https://drive.google.com/drive/folders/1DGysUd3_JMqUP8oh7oSZvdIO9q7yQ4Rh?usp=sharing