Week 11 Car Crash simulation
Stress Concentration on Car Crash Simulation
OBJECTIVES:
To carry out an Explicit Dynamic Analysis of Car Crash Simulation for the given three thicknesses of the Car Body and determine the stress, and deformation.
GEOMETRY and MATERIAL:
The Explicit Dynamic Analysis was carried out on the given specimen. The material used for this analysis was Stainless Steel NL for Car Body and Structural Steel and the analysis was carried out using ANSYS Mechanical Enterprise. The model for Tension Test was imported to ANSYS Workbench software and is shown in the figure below.
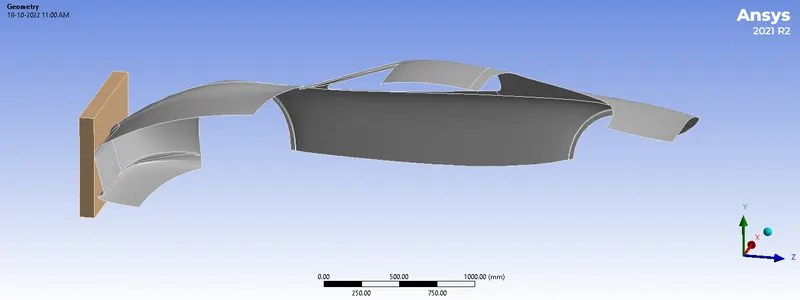
Fig.1 Car Crash Simulation Model
Later the material was assigned and its properties used for this analysis are specified below.
- Wall: Structural Steel
- Car Body: Stainless Steel
|
Material |
Stainless Steel NL |
Structural Steel |
|
Density |
7.75e-6 kg/mm3 |
7.85e-6 kg/mm3 |
|
Young’s Modulus |
1.93e+5 MPa |
2e+5 MPa |
|
Poisson Ratio |
0.31 |
0.34 |
|
Bulk Modulus/YS |
1.693e+5 MPa |
250 MPa |
|
Shear Modulus/US |
73664 MPa |
460 MPa |
|
Components |
Car Body |
Wall |
Thickness:
The different thicknesses assigned to the car body are as follows:
- Case-1: Thickness=0.3 mm.
- Case-2: Thickness=0.5 mm.
- Case-3: Thickness=0.7 mm.
CONNECTIONS:
Body Interactions with FRICTIONLESS Type was provided by default to both the Car Body and the Wall.
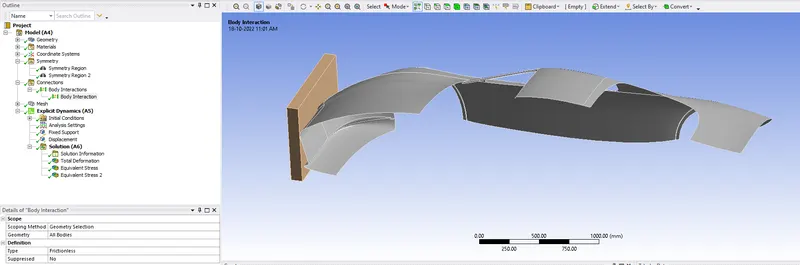
Fig.2 Body Interactions
SYMMETRY:
Since the given geometry is symmetrical, so Two SYMMETRY REGION was assigned one to the wall and the other to the Car Body Edges.
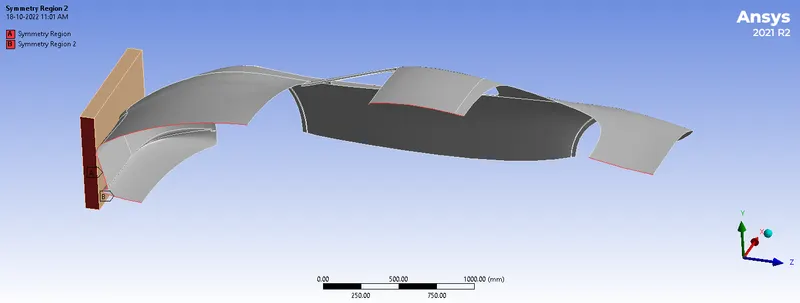
Fig.3 Symmetry Region
MESHING:
- Method: To Wall Body
- Type: Tetrahedrons
- Face Sizing: To the back side of the car body
- Element Size: 70mm
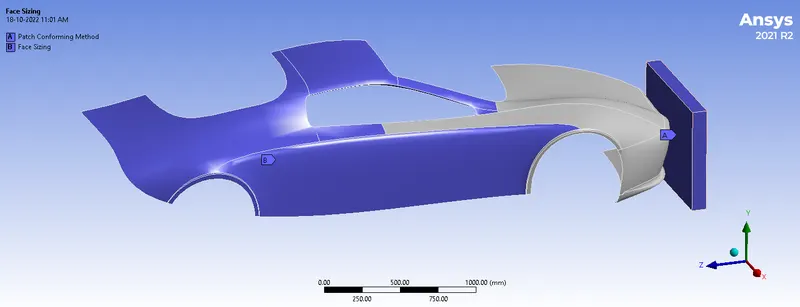
Fig.4 Method and Sizing
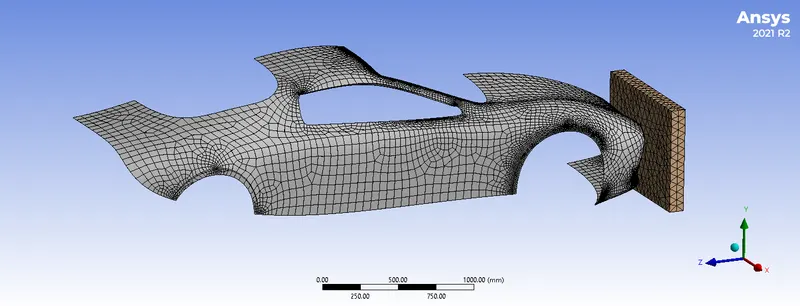
Fig.5 Meshed Model
A mesh metric that identifies elements according to their quality was employed and it can be seen that the elements of the lowest quality are minimal. Most of the elements have very high quality in the range of 0.5 to 0.9. Hence, the mesh is of acceptable quality. The meshed model is shown below.
ANALYSIS SETTING (All Cases):
- of Steps: 1
- Load Step Type: Explicit Time Integration
- End Time: 0.001s
- No. of Cycles: 1e+7
- Energy Error: 0.1
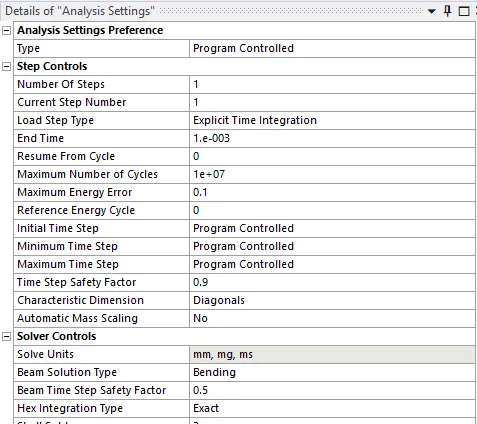
Fig.6 Analysis Setting (all cases)
BOUNDARY CONDITIONS AND LOAD (All Cases):
- Fixed Support: Back Side or Faces of the Car Body
- Displacement: To the Wall
- Z Component: 500mm
- Y and Z Component: Free
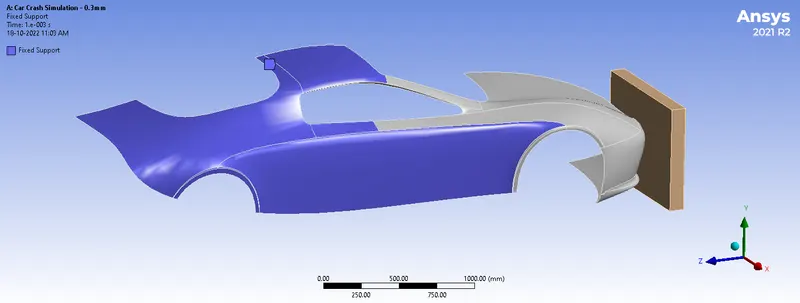
Fig.7 Fixed Support
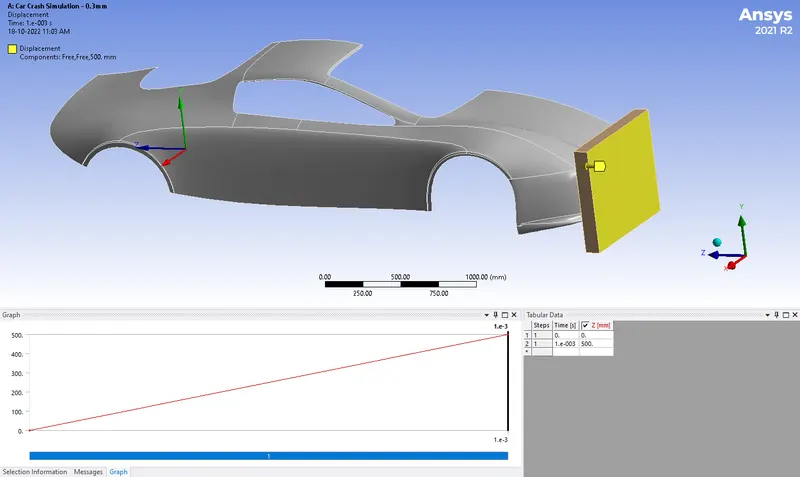
Fig.8 Velocity Load -139000mm/s
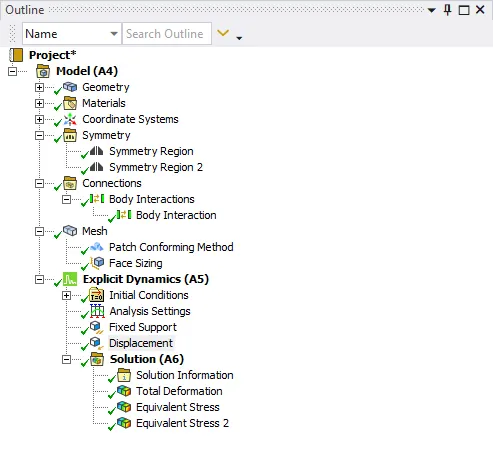
Fig.9 Case Setup
RESULTS – thickness 0.3mm:
The Total Deformation obtained from the analysis is shown below.
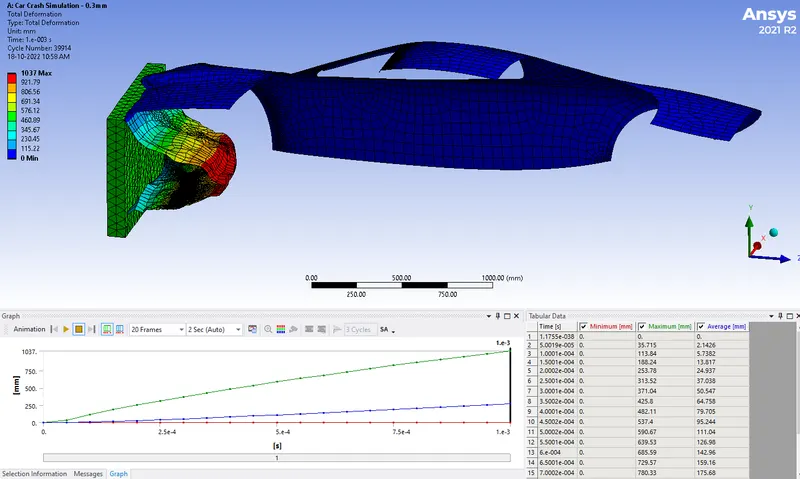
Fig.10 Total Deformation Contour Plot
The Equivalent (Von-Mises) Stress obtained from the analysis is shown below.
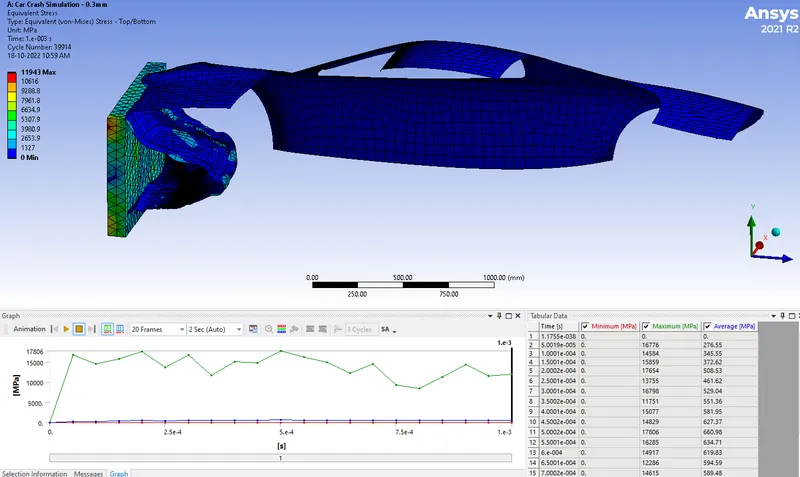
Fig.11 Equivalent Stress Contour Plot
The Equivalent (Von-Mises) Stress of the Car Body obtained from the analysis is shown below
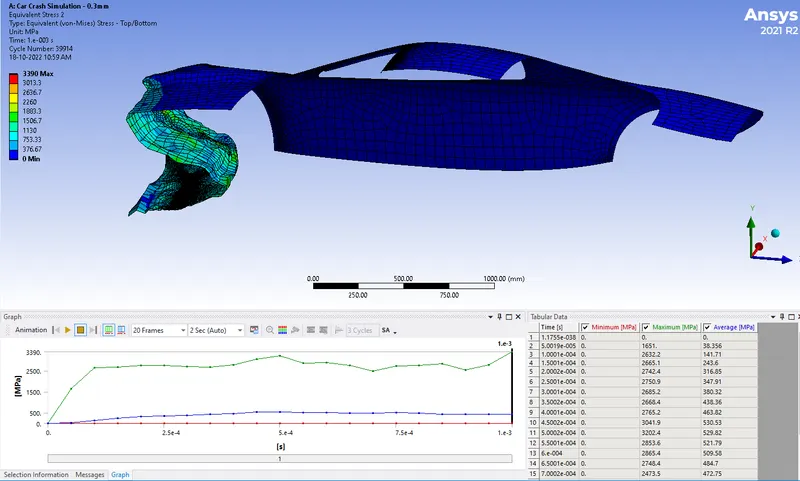
Fig.12 Equivalent (Von-Mises) Stress of the Car Body Contour Plot
RESULTS – thickness 0.5mm:
The Total Deformation obtained from the analysis is shown below.
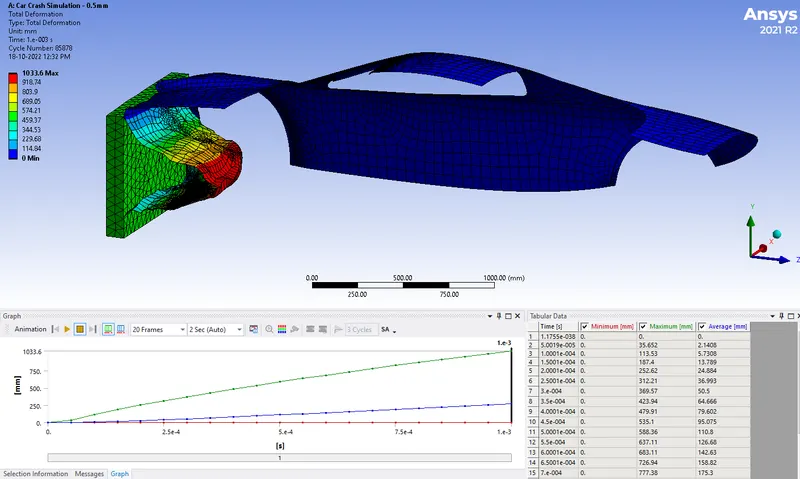
Fig.13 Total Deformation Contour Plot
The Equivalent (Von-Mises) Stress obtained from the analysis is shown below.
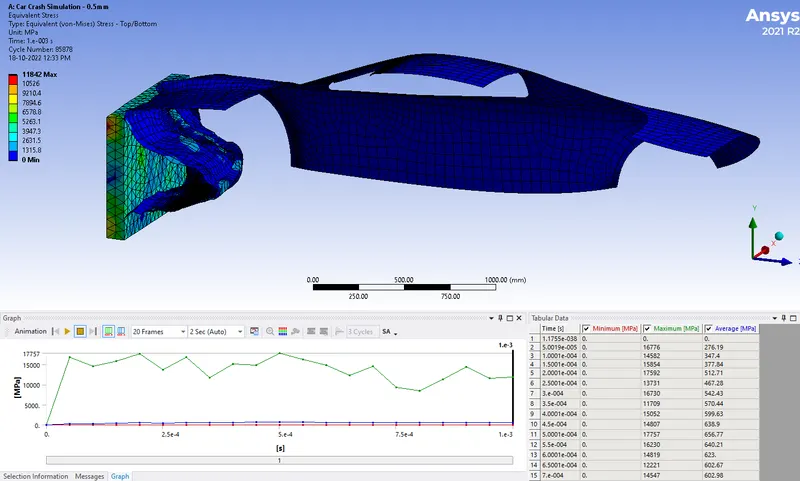
Fig.14 Equivalent Stress Contour Plot
The Equivalent (Von-Mises) Stress of the Car Body Model obtained from the analysis is shown below
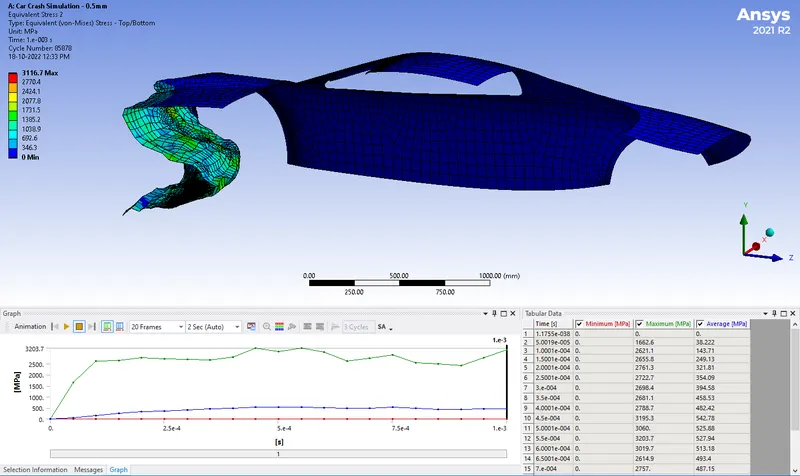
Fig.15 Equivalent Stress of the Car Body Contour Plot
RESULTS – thickness 0.7mm:
The Total Deformation obtained from the analysis is shown below.
Fig.16 Total Deformation Contour Plot
The Equivalent (Von-Mises) Stress obtained from the analysis is shown below.
Fig.17 Equivalent Stress Contour Plot
The Equivalent (Von-Mises) Stress of the Car Body obtained from the analysis is shown below
Fig.18 Equivalent Stress of the Car Body Contour Plot
The simulation was run and the results are tabulated below.
|
Output |
Case-1 Thickness 0.3mm |
Case-2 Thickness 0.5mm |
Case-3 Thickness 0.7mm |
|
Total Deformation Max. [mm] |
1037 |
1033.6 |
1030 |
|
Equivalent Stress Max. [MPa] |
17806 |
17757 |
17713 |
|
Equivalent Stress of Car Max. [MPa] |
3390 |
3203.7 |
3536.9 |
CONCLUSION:
The analysis was run successfully and results were obtained and tabulated.
- The Maximum Deformation was 1037mm obtained for a thickness of 0.3mm
- The Maximum Stress of the Car Body was 3536.9MPa obtained for a thickness of 0.7mm
The stress generated by the car crash is more in the car body thickness of 0.3mm, than any other thickness provided above, this is due to the strength of the car body which depends on the material and thickness. In this analysis, the material is the same and only the thickness is varied, and the strength in this case is dependent on the thickness. So, as the strength(thickness) of the car body increases, the deformation also decreases accordingly.