Week 10 - Simulating Combustion of Natural Gas.
SIMULATING COMBUSTION OF NATURAL GAS
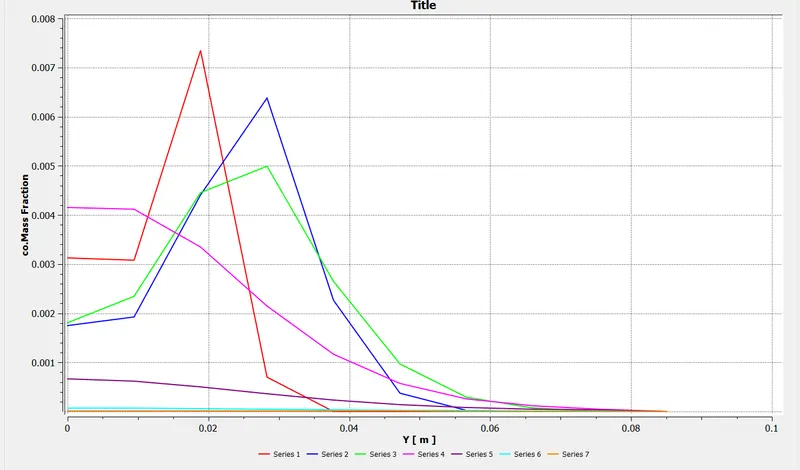
AIM: To perform a combustion simulation on the combustor model and plot the variation of the mass fraction of the different species
OBJECTIVE:
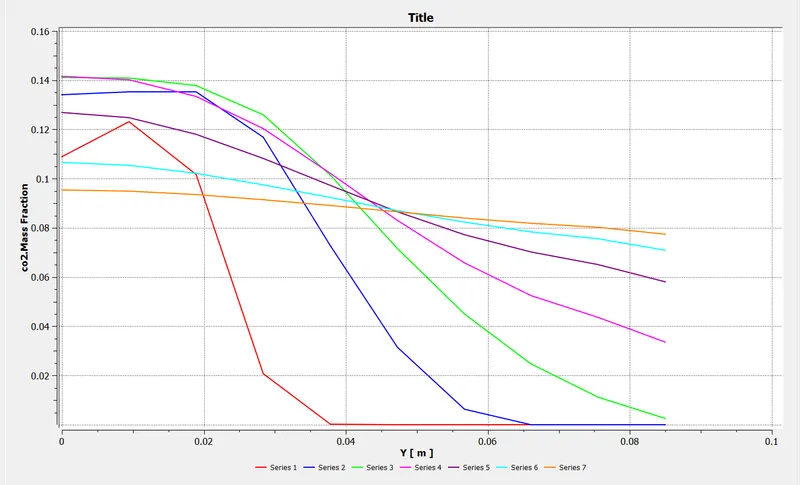
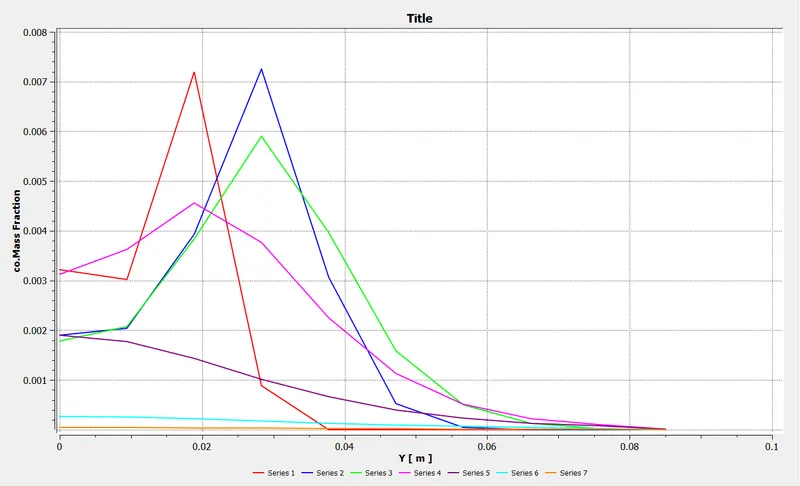
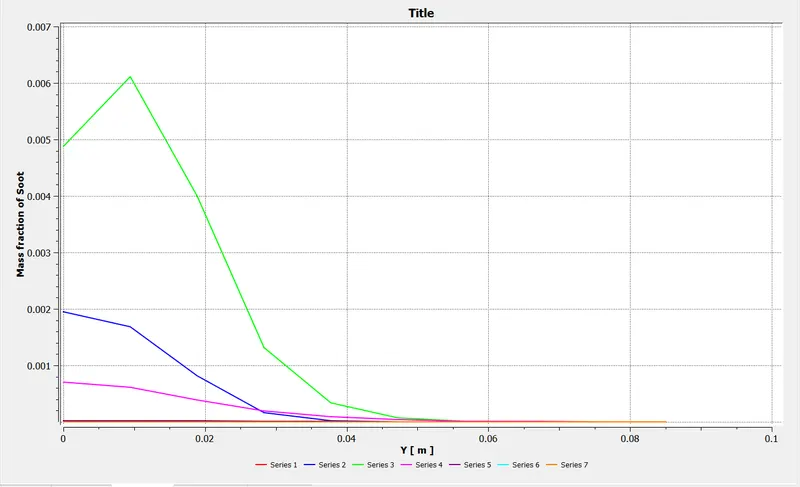
- Simulating using line probes at different locations of the combustor and to plot for CO2, H2O, CH4, N2, O2, NOx emissions & Soot formation.
- To add the water content in the fuel from 5% to 30% by mole and observe the effect of it on the results.
THEORY:
Natural gas is the cleanest of all the fossil fuels, as evidenced in the Environmental Protection Agency Composed primarily of methane. The main products of the combustion of natural gas are carbon dioxide and water vapor, the same compounds we exhale when we breathe.
Coal and oil are composed of much more complex molecules, with a higher carbon ratio and higher nitrogen and sulfur contents. This means that when combusted, coal and oil release higher levels of harmful emissions, including a higher ratio of carbon emissions, nitrogen oxides (NOx), and sulfur dioxide (SO2)
The combustion of natural gas, on the other hand, releases very small amounts of sulfur dioxide and nitrogen oxides, virtually no ash or particulate matter, and lower levels of carbon dioxide, carbon monoxide, and other reactive hydrocarbons.
Natural gas, emitting fewer harmful chemicals into the atmosphere than other fossil fuels, can help to mitigate some of these environmental issues. These issues include:
- Greenhouse Gas Emissions
- Smog, Air Quality, and Acid Rain
- Industrial and Electric Generation Emissions
- Pollution from the Transportation Sector – Natural Gas Vehicles
MASS FRACTION :
The ratio of the mass of a component in a mixture to the total mass of the mixture is known as mass fraction.
MOLE FRACTION :
The ratio of a number of molecules of one component of solution or other mixture to the total number of moles representing all of the components.
SIMULATION AND SOLUTION:
In this project, we have two parts where
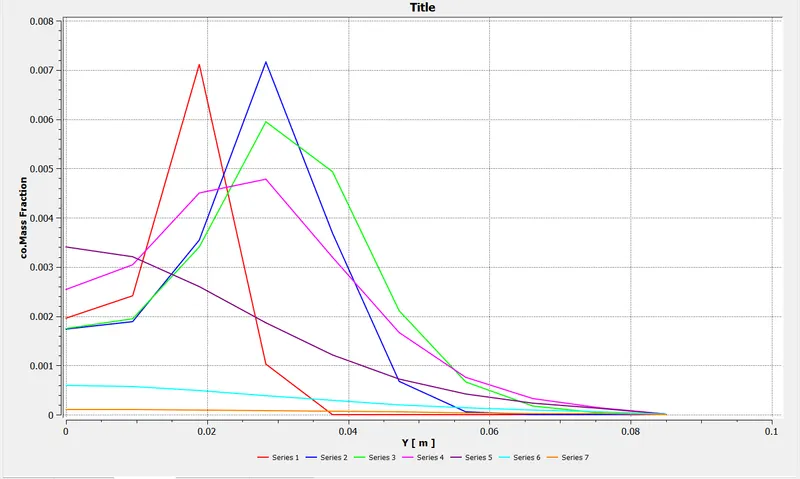
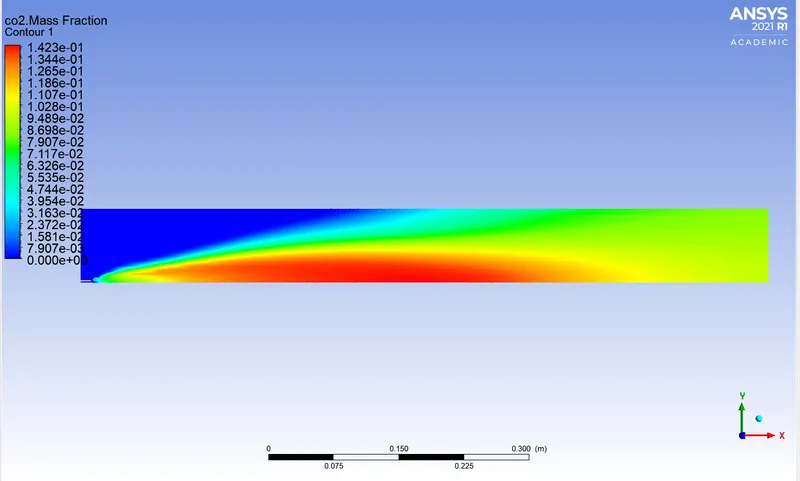
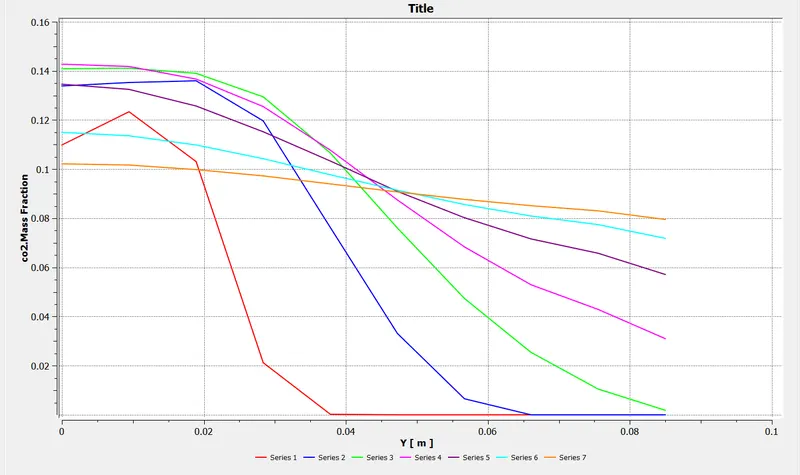
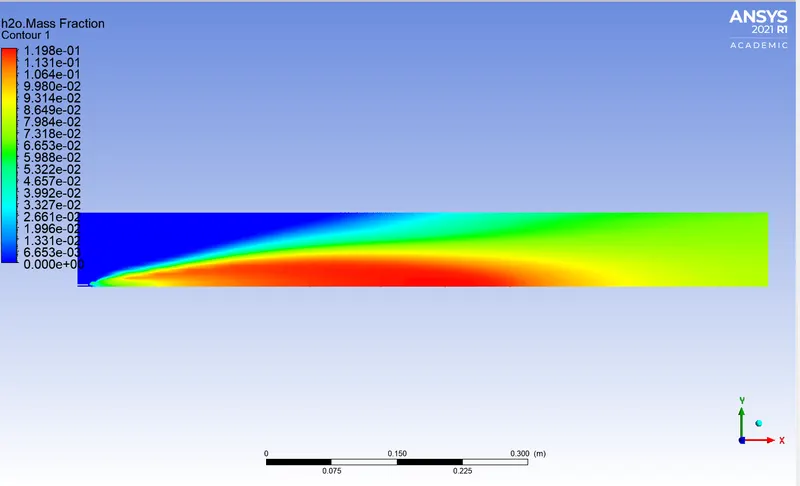
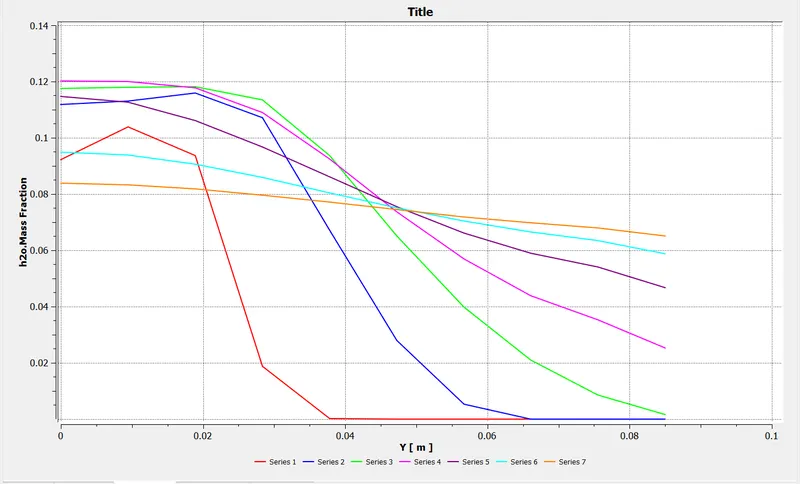
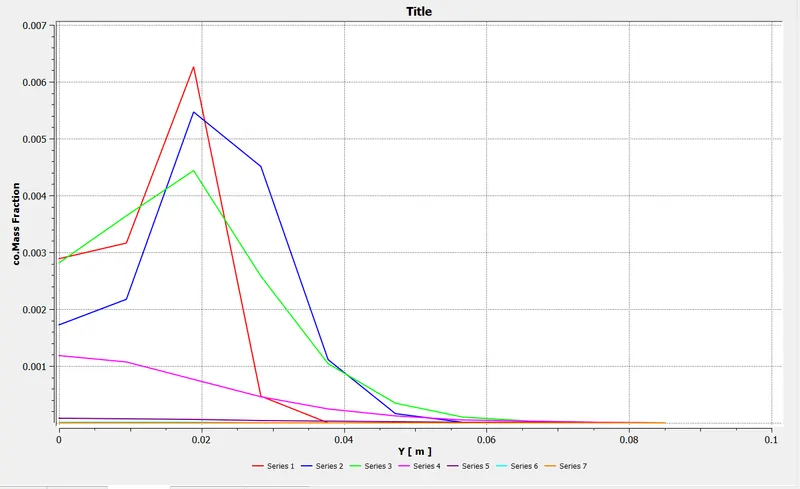
Part 1: Simulating using line probes at different locations of the combustor and to plot for CO2, H2O, CH4, N2, O2, NOx emissions & Soot formation.
Part 2: To add the water content in the fuel from 5% to 30% by mole and observe the effect of it on the results.
Geometry
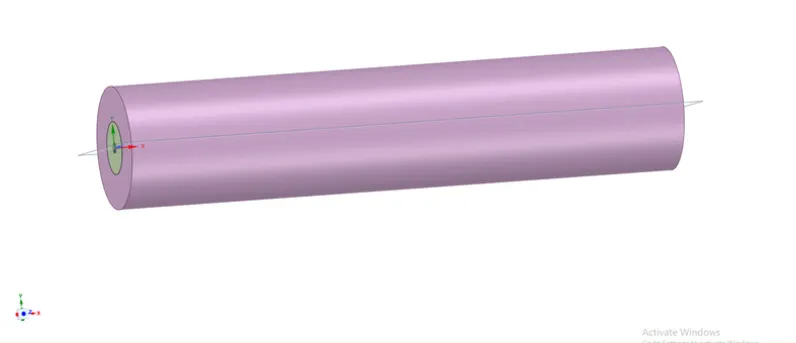
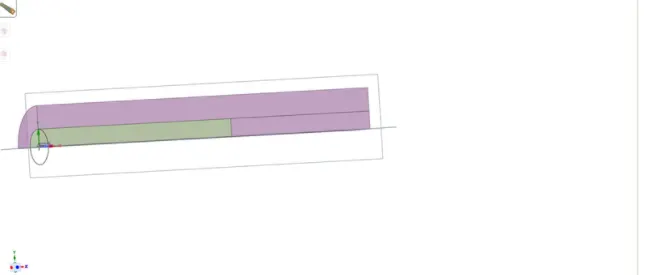
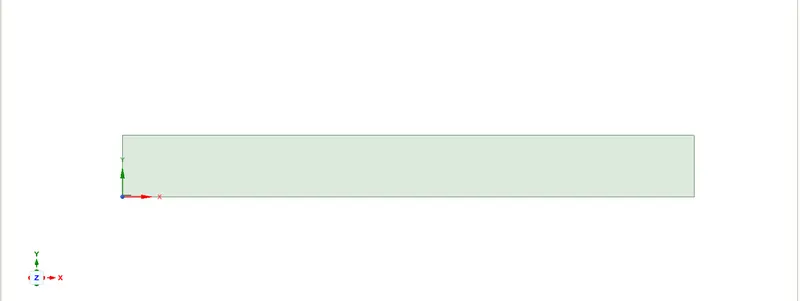
We convert the given geometry from 3D to 2D using a split body and then copying the surface to a new design.
Meshing:
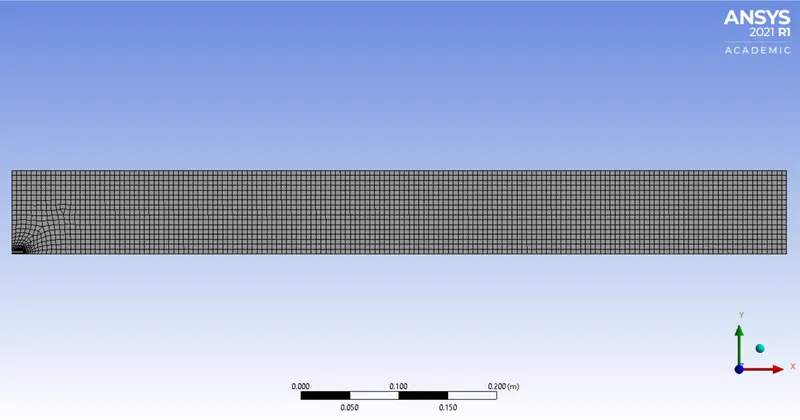
Keeping the element size as 0.005 m and keeping the capture proximity on with the number of cells across the gap as 3
Simulation
Part 1
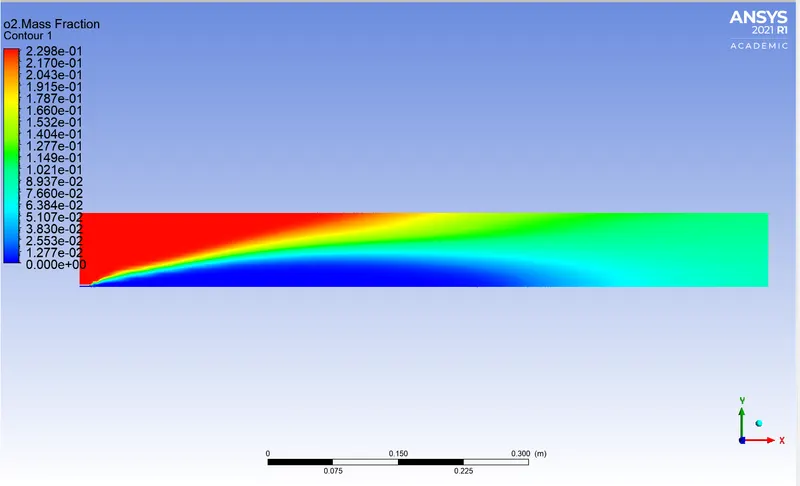
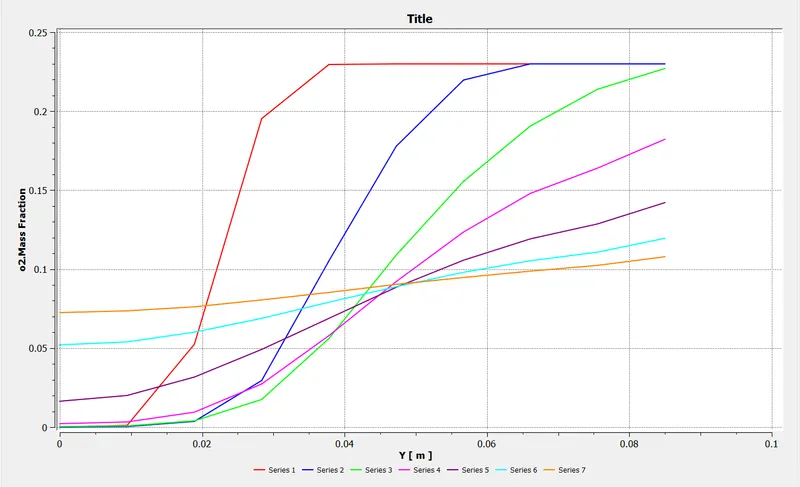
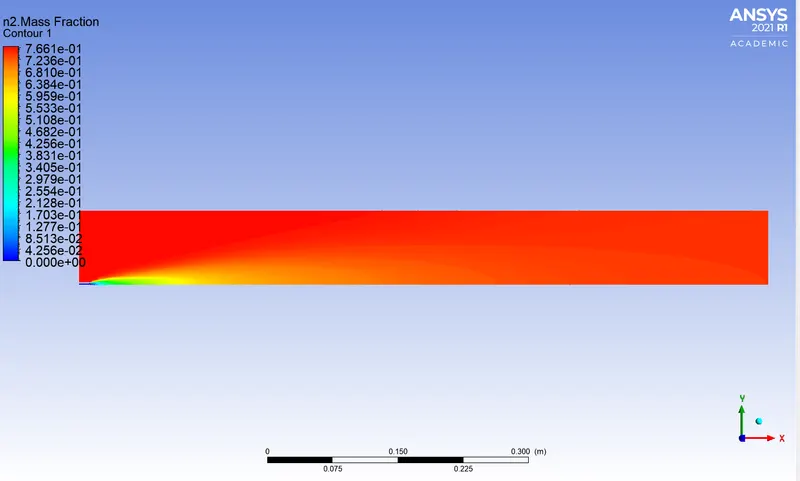
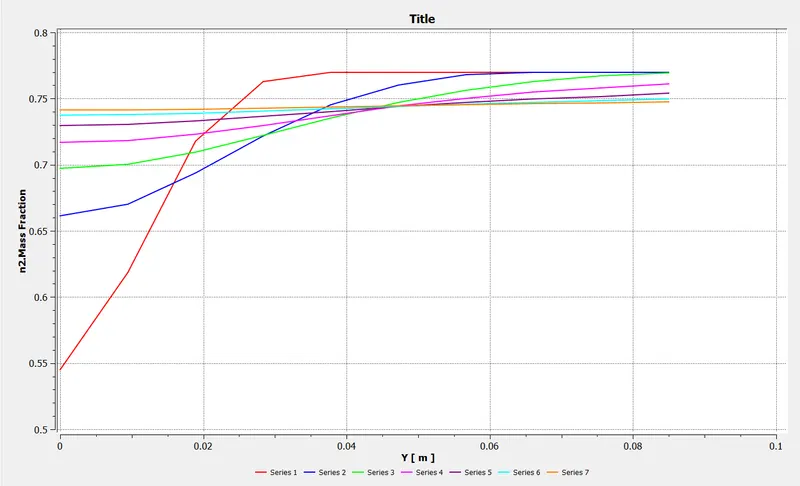
Simulating using line probes at different locations of the combustor and to plot for CO2, H2O, CH4, N2, O2, NOx emissions & Soot formation.
|
SETUP |
||
|
Gravity |
-9.81 in the Y direction | |
|
Solver Type |
Pressure-Based |
|
|
Velocity Formulation |
Absolute |
|
|
2D Space |
Axisymmetric |
|
|
Time |
|
|
|
Models |
Viscous model: K-epsilon Energy model: ON Species: Species transport >volumetric>inlet diffusion>diffusion energy source>methane-air-2step>eddy dissipation |
|
|
Material |
Fluid type: Air Solid-type: Aluminium Mixture: Methane-air-2step |
|
|
Cell zones |
Fluid type: Mixture Solid: Al |
|
|
Boundaries |
Air Inlet velocity: 0.5m/s Fuel inlet velocity: 80m/s Outlet: pressure-outlet Wall:- wall Axis: axis |
|
|
Reference values |
Standard |
|
|
Initialization |
Hybrid |
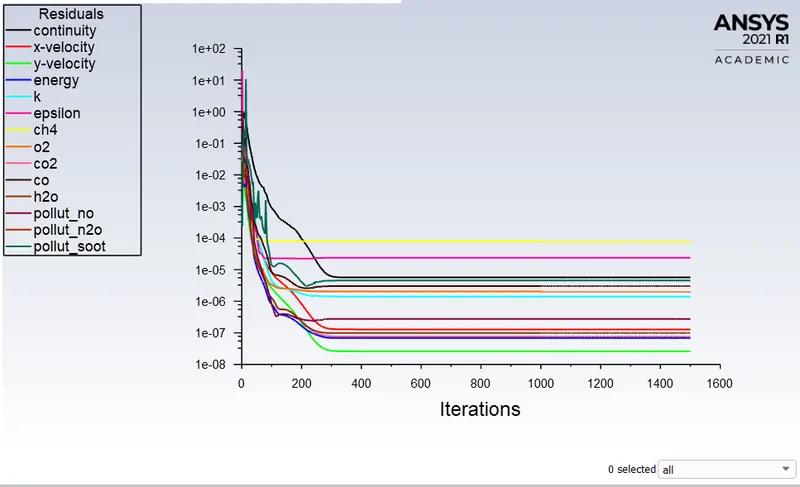
Residual Plot:
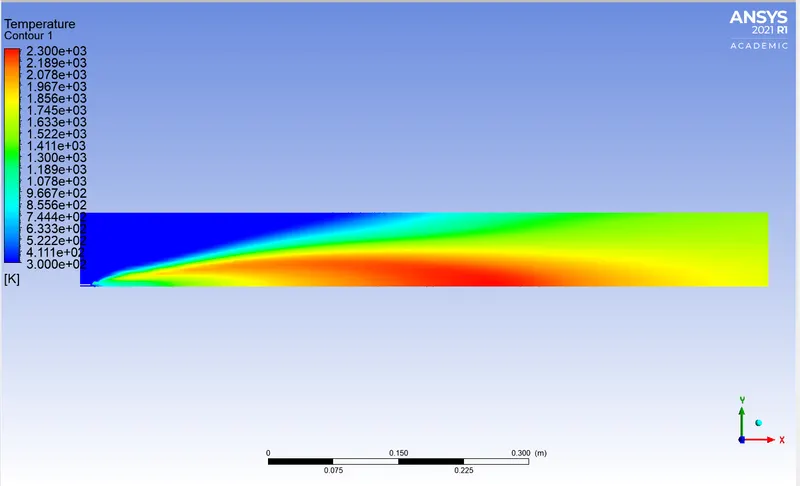
Temperature Counter:
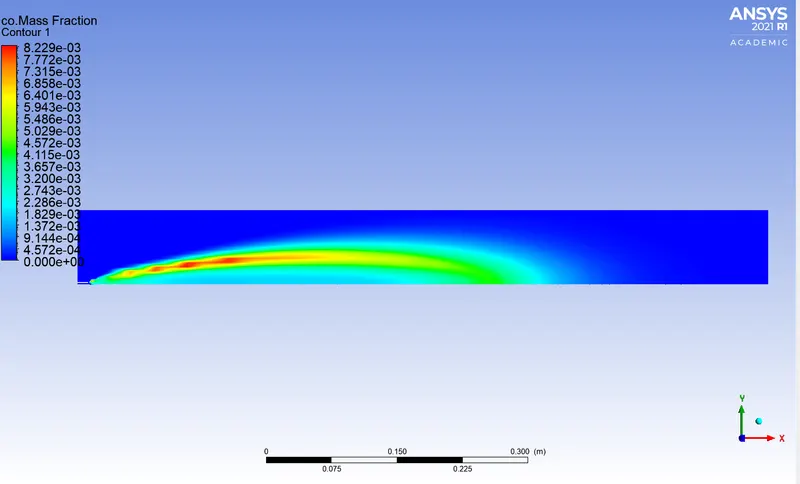
CO Mass fraction
CO2 Mass fraction
H2O Mass fraction
O2 Mass fraction
N2 Mass fraction
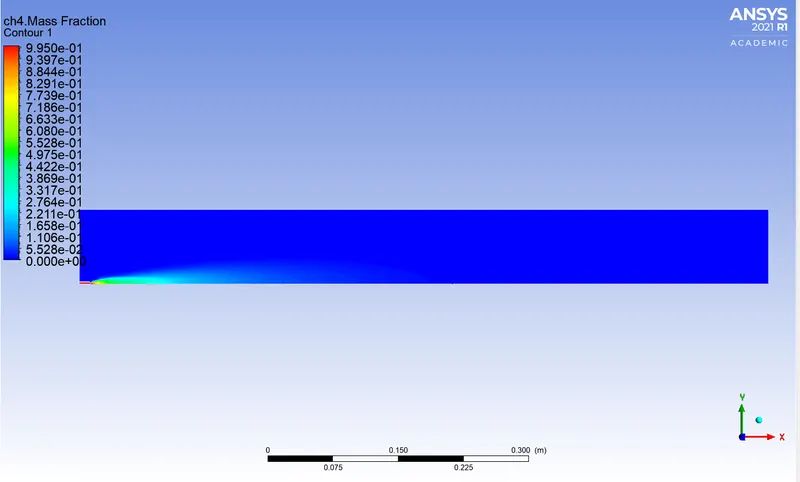
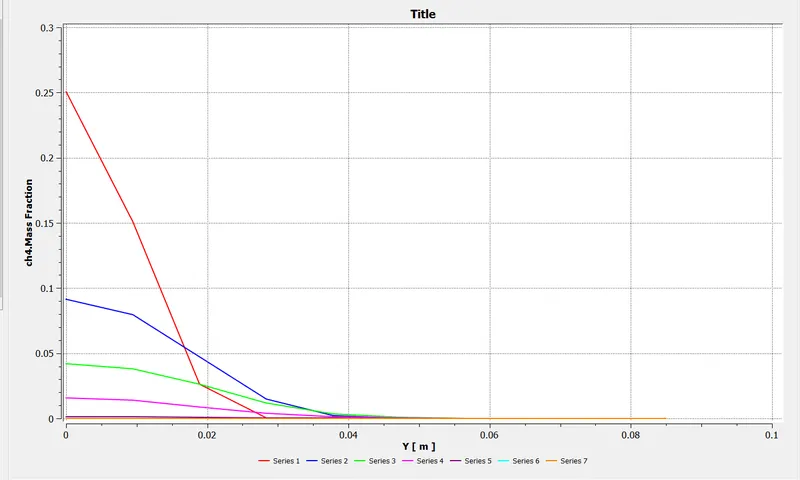
CH4 Mass fraction
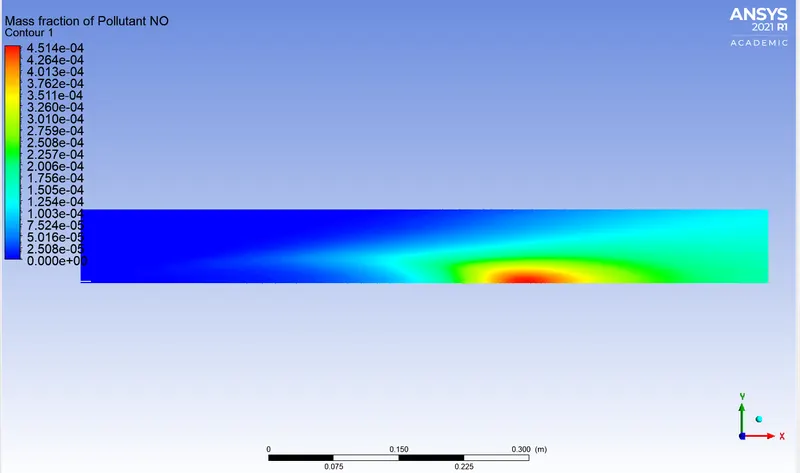
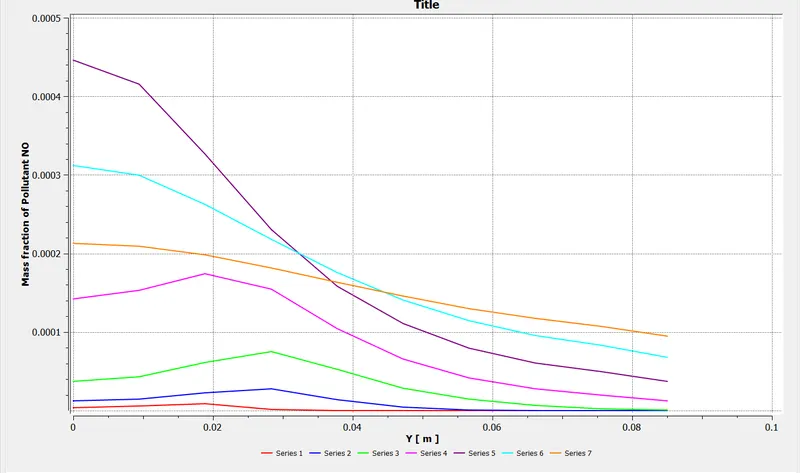
Nox Mass fraction
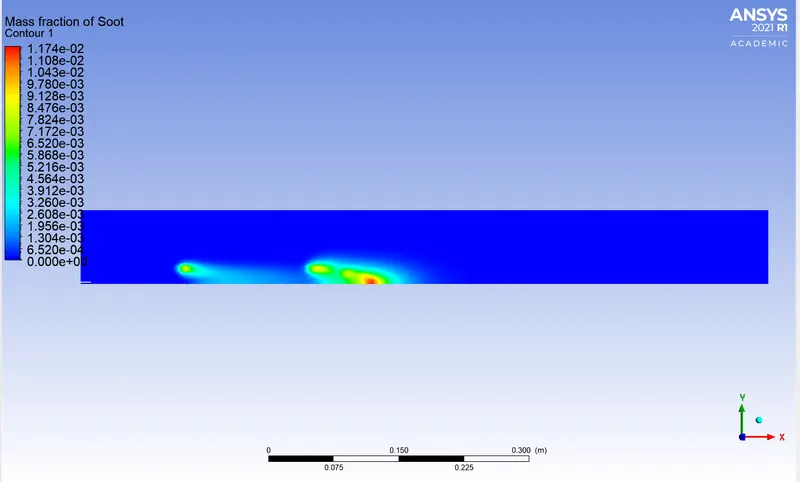
Soot Mass fraction
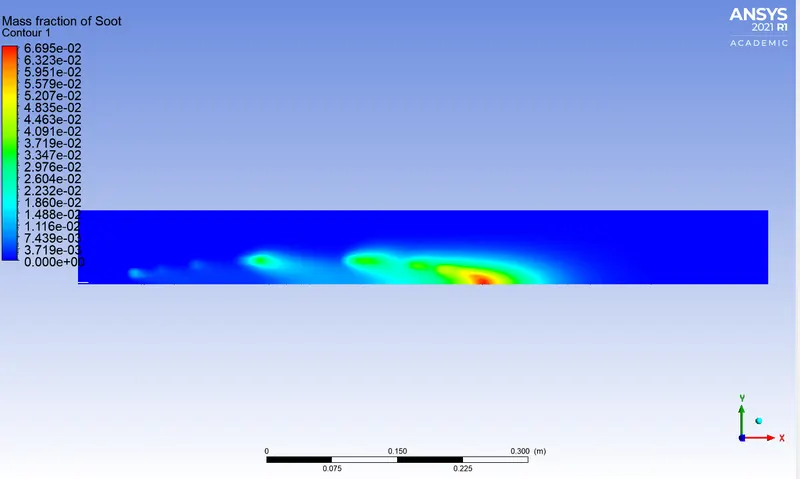
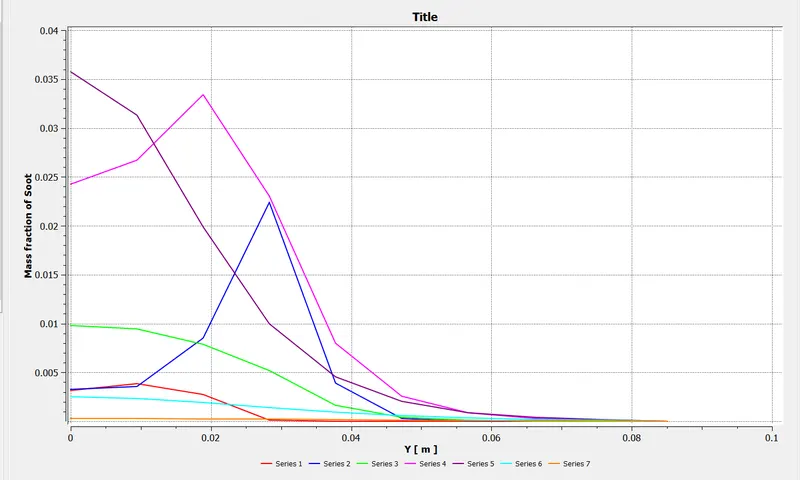
Part 2
To add the water content in the fuel from 5% to 30% by mole and observe the effect of it on the results.
|
SETUP |
||
|
Gravity |
-9.81 in the Y direction | |
|
Solver Type |
Pressure-Based |
|
|
Velocity Formulation |
Absolute |
|
|
2D Space |
Axisymmetric |
|
|
Time |
|
|
|
Models |
Viscous model: K-epsilon Energy model: ON Species: Species transport >volumetric>inlet diffusion>diffusion energy source>methane-air-2step>eddy dissipation |
|
|
Material |
Fluid type: Air Solid-type: Aluminium Mixture: Methane-air-2step |
|
|
Cell zones |
Fluid type: Mixture Solid: Al |
|
|
Boundaries |
Air Inlet velocity: 0.5m/s Fuel inlet velocity: 80m/s Outlet: pressure-outlet Wall:- wall Axis: axis |
|
|
Reference values |
Standard |
|
|
Initialization |
Hybrid |
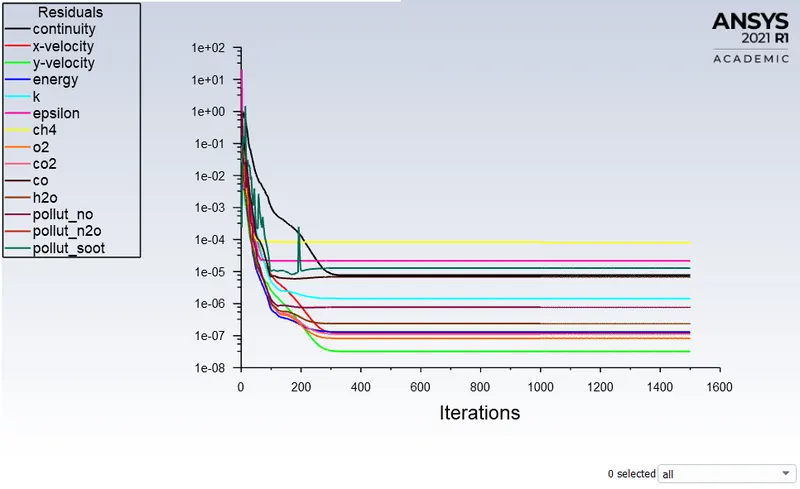
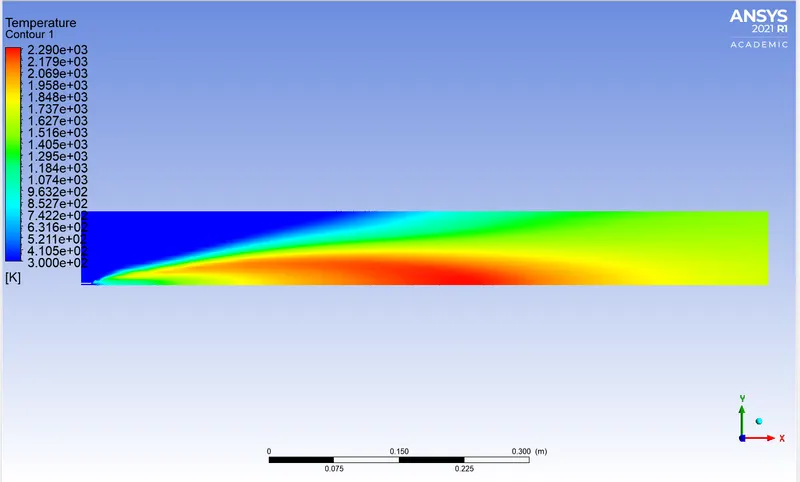
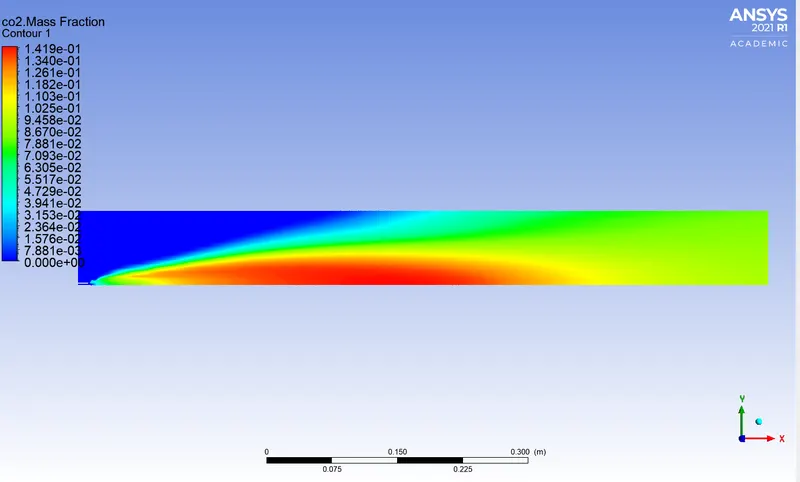
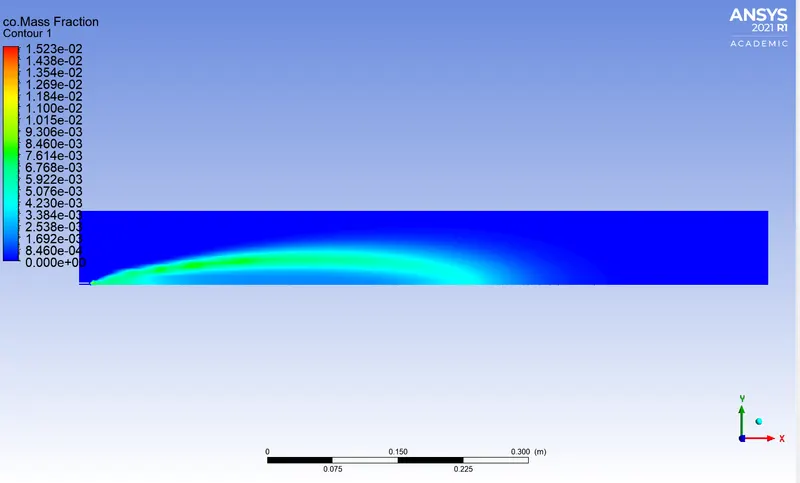
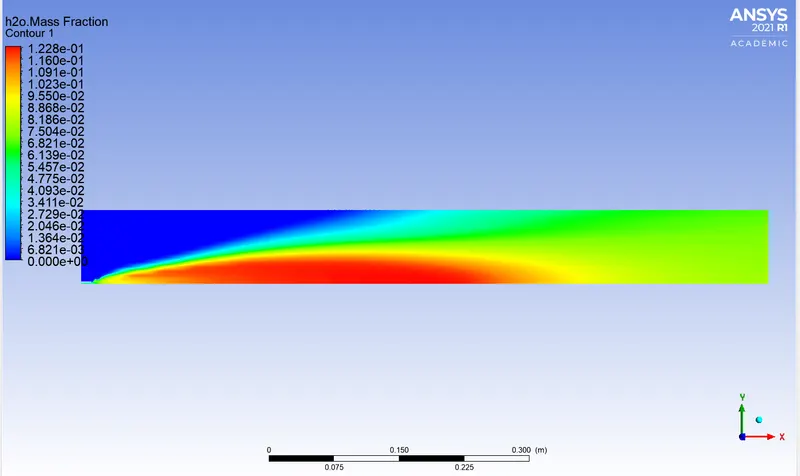
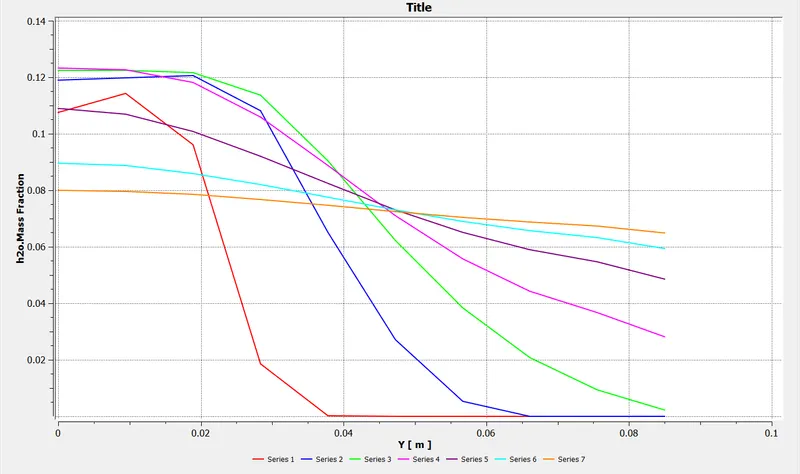
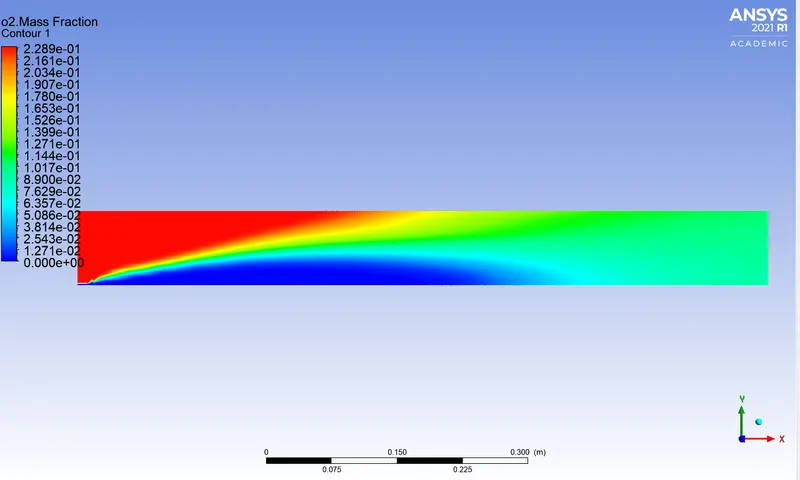
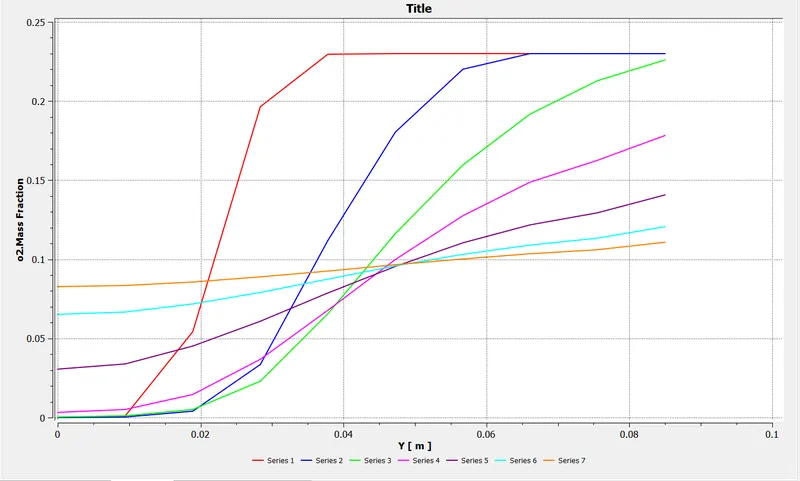
1.For 5% addition of water
Residual Plot:
Temperature Counter:
CO2 Mass fraction
CO Mass fraction
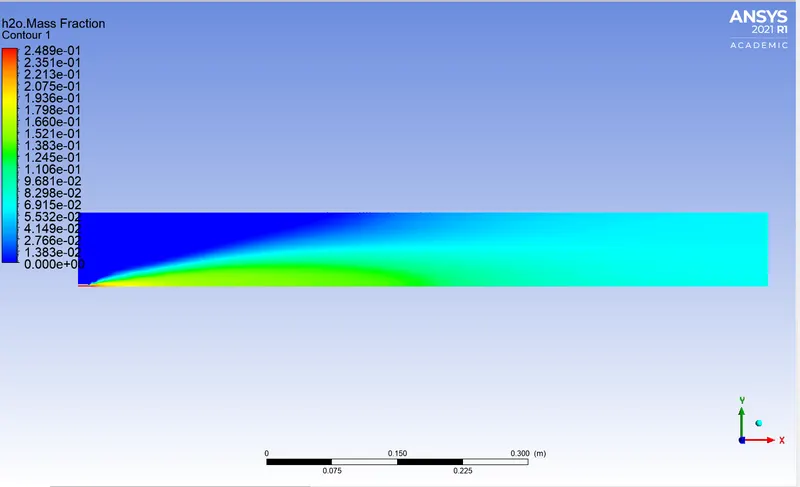
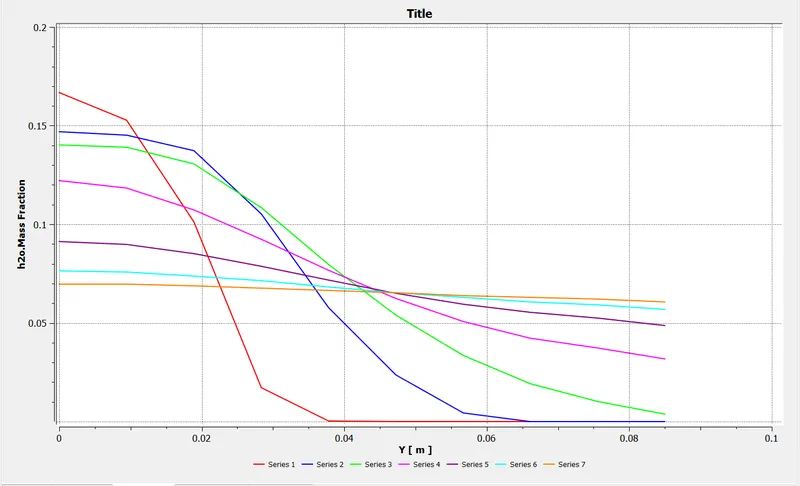
H2O Mass fraction
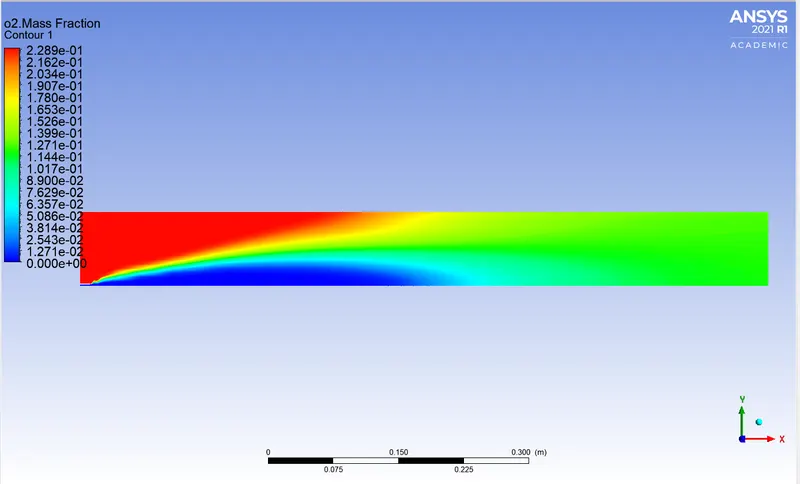
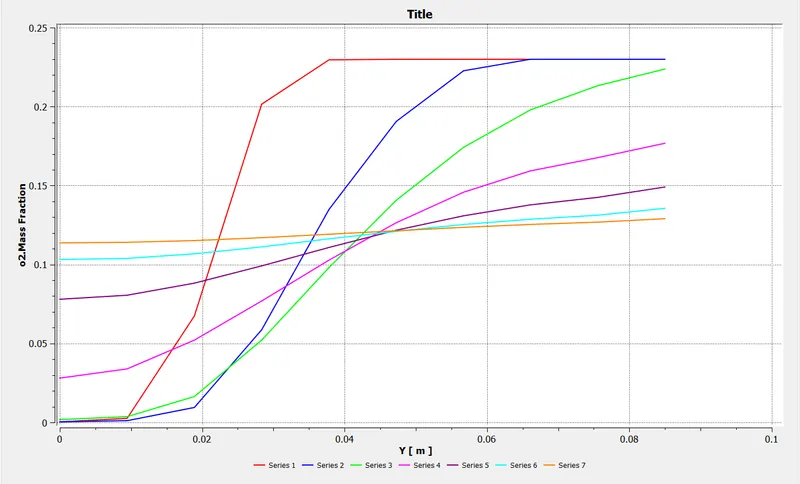
O2 Mass fraction
N2 Mass fraction
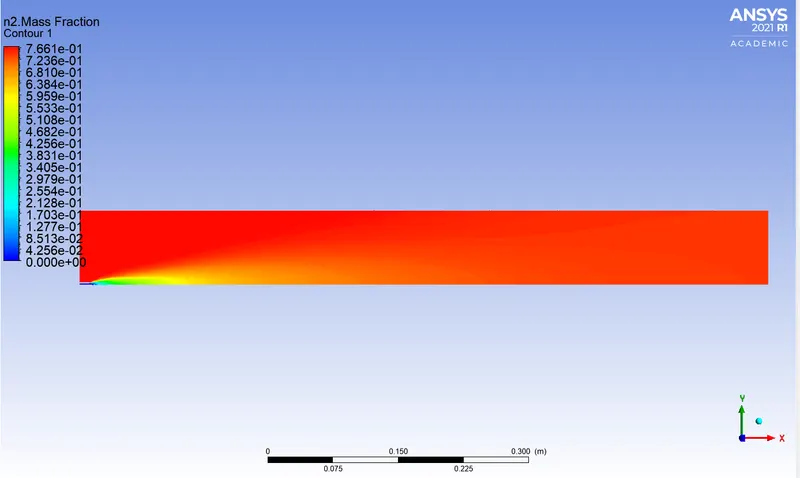
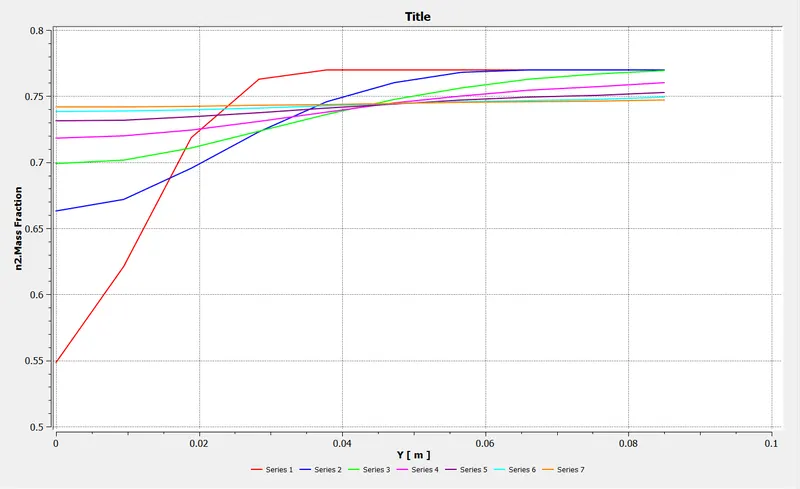
CH4 Mass fraction
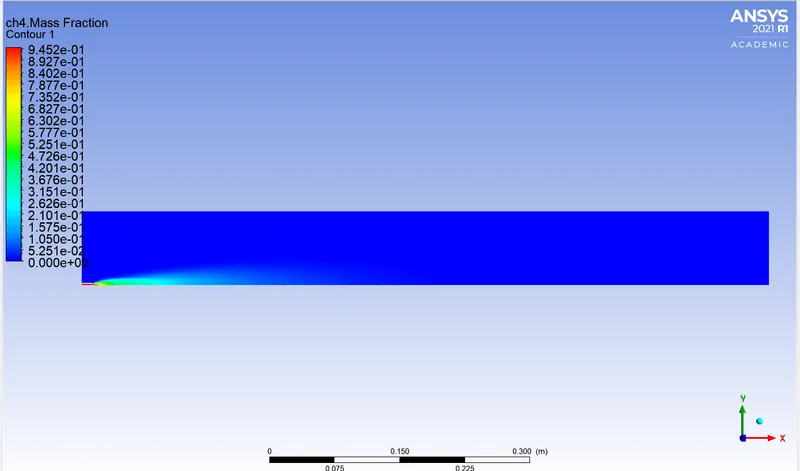
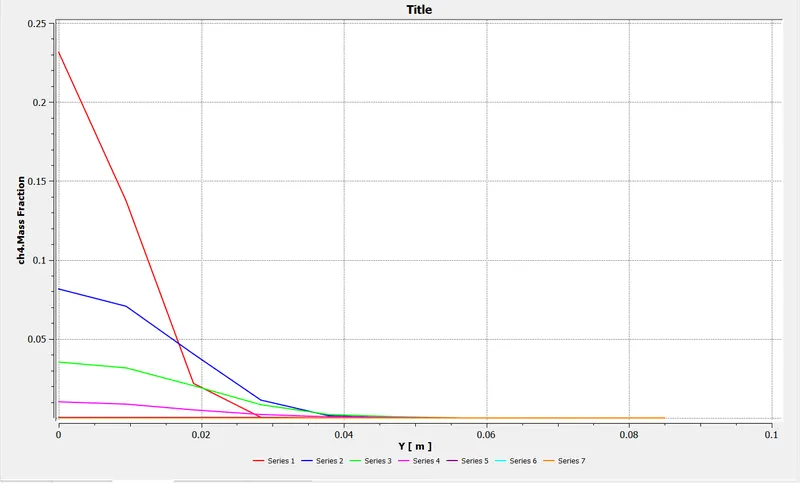
Nox Mass fraction
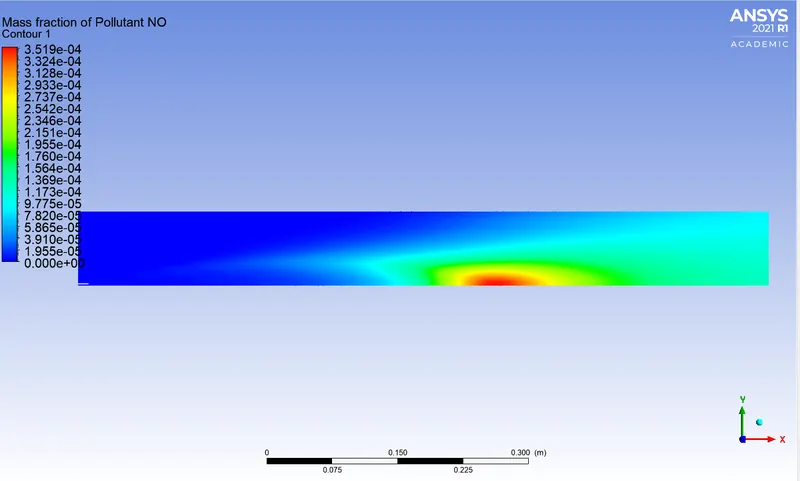
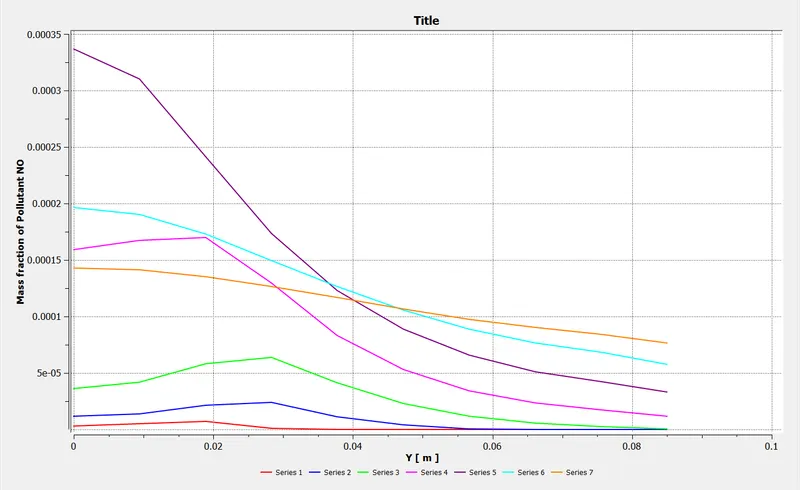
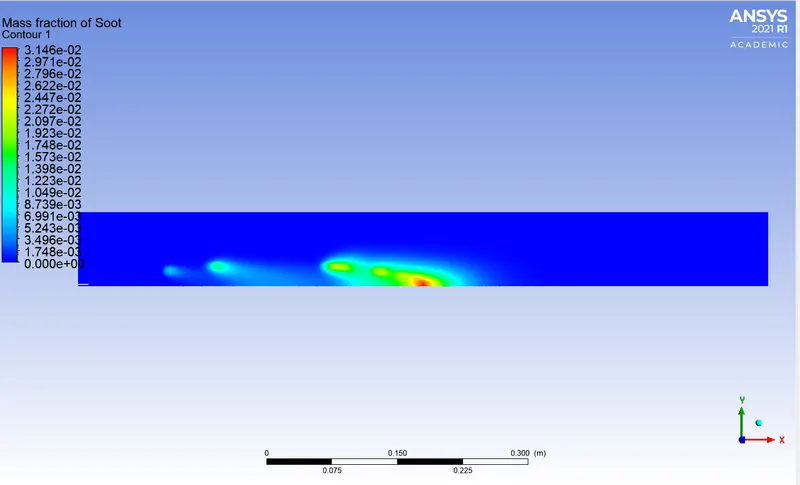
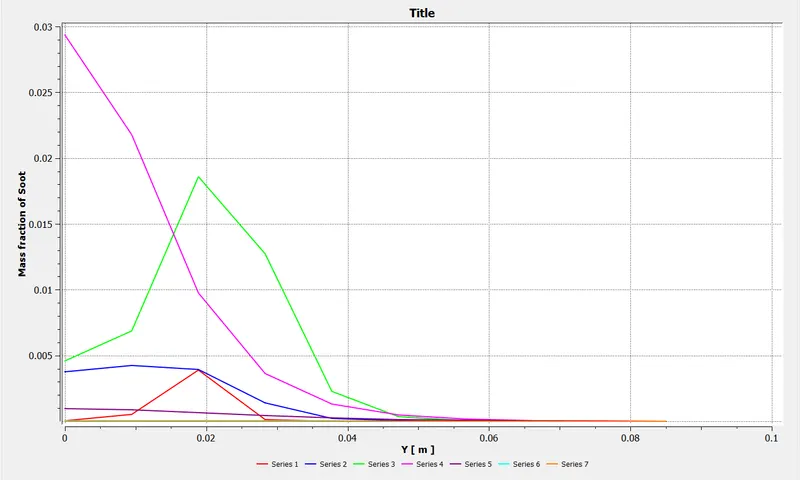
Soot Mass fraction
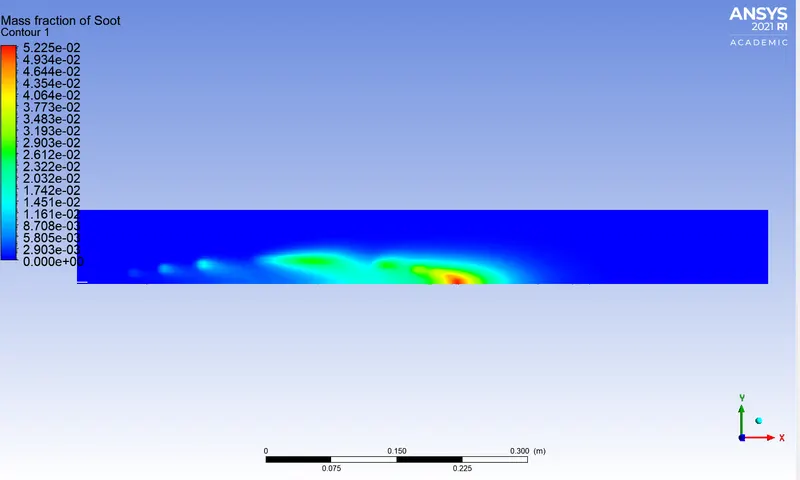
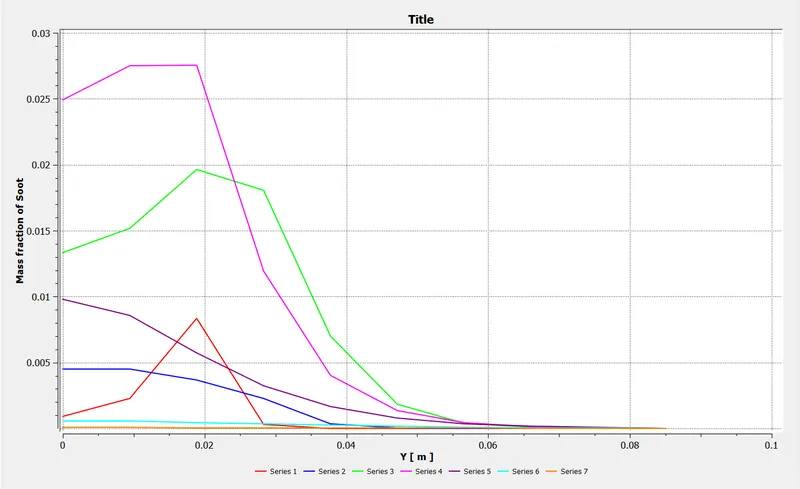
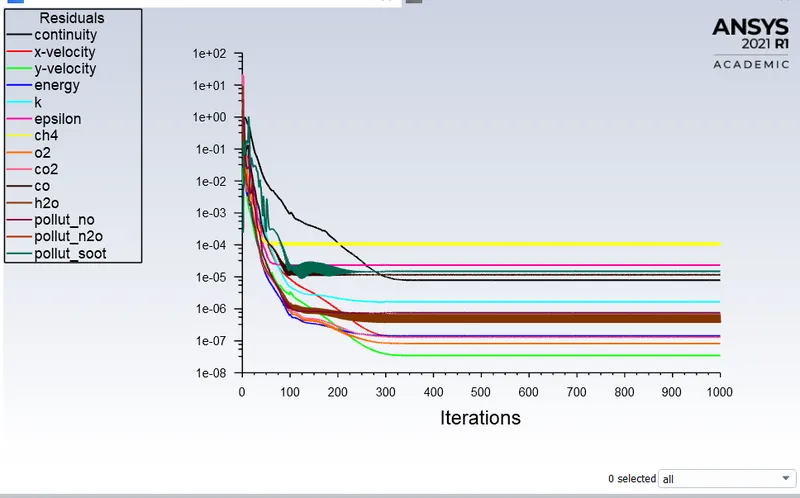
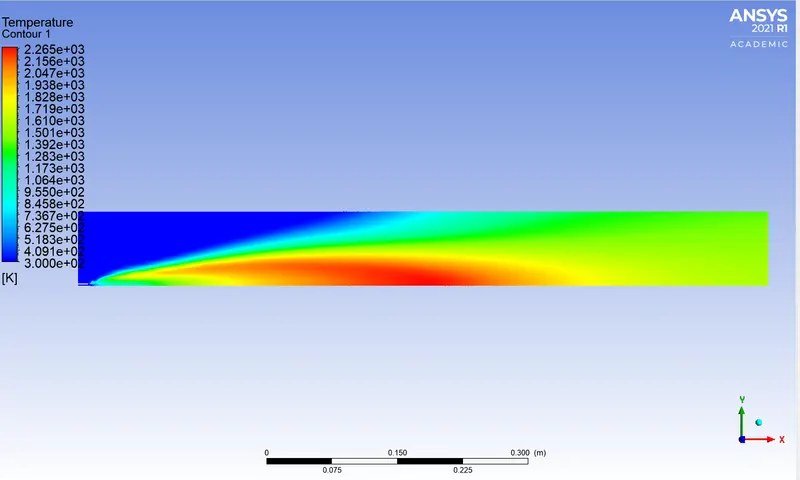
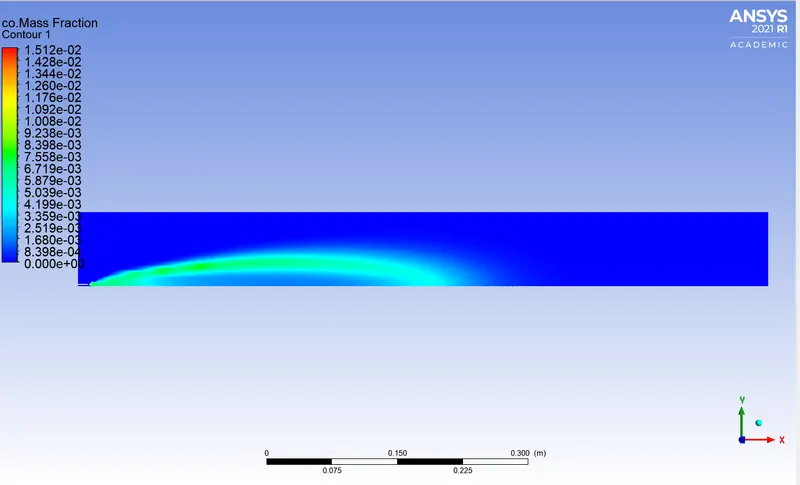
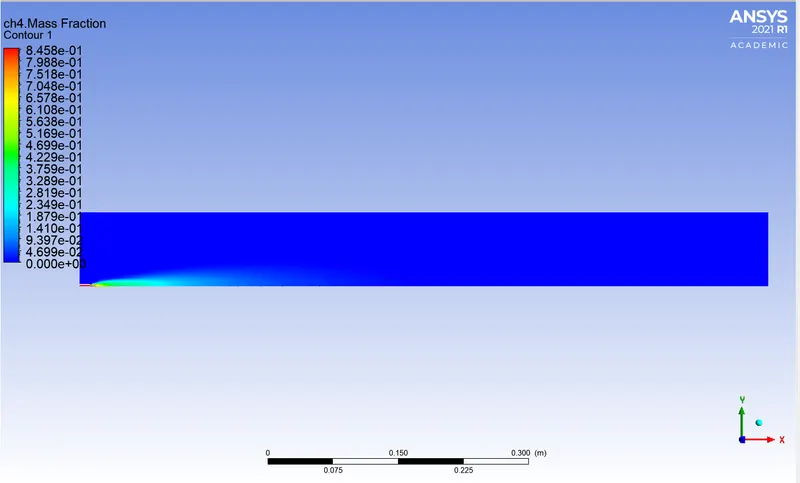
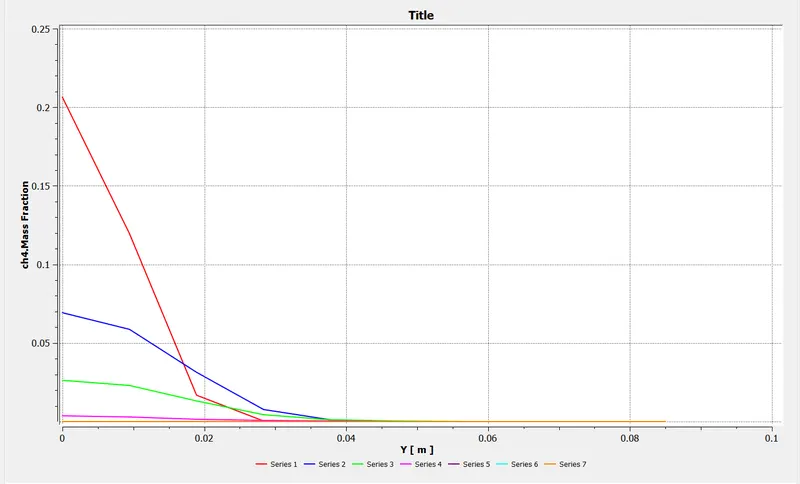
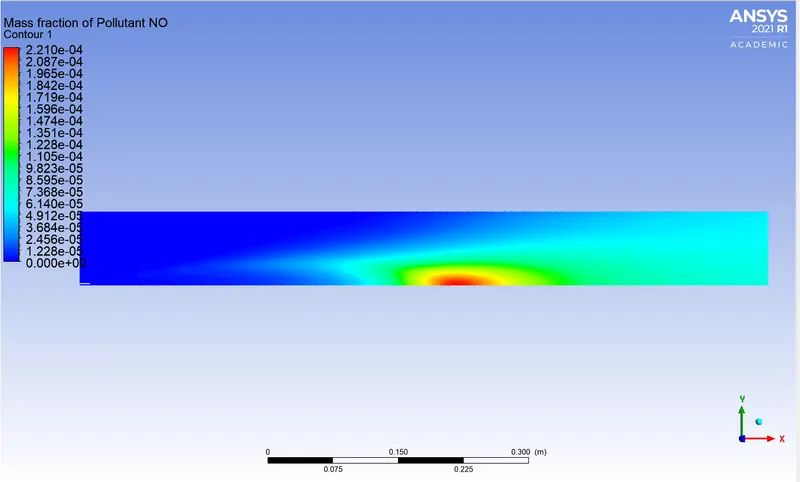
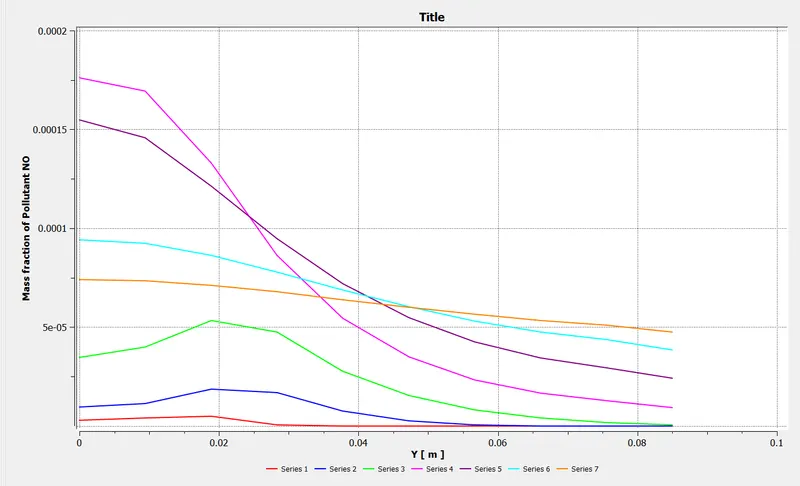
2.For 15% addition of water
Residual Plot:
Temperature Counter:
CO Mass fraction
CO2 Mass fraction
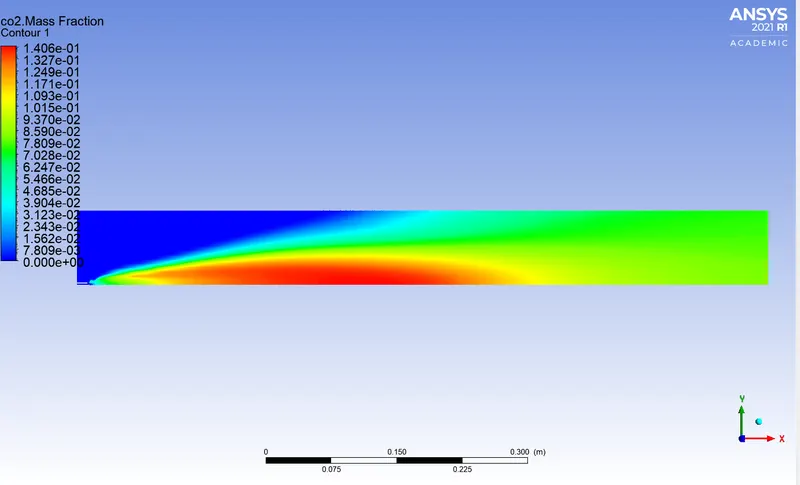
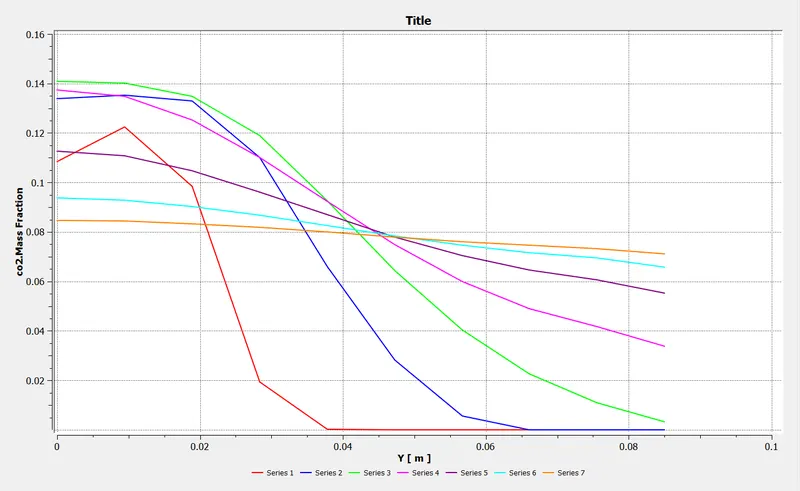
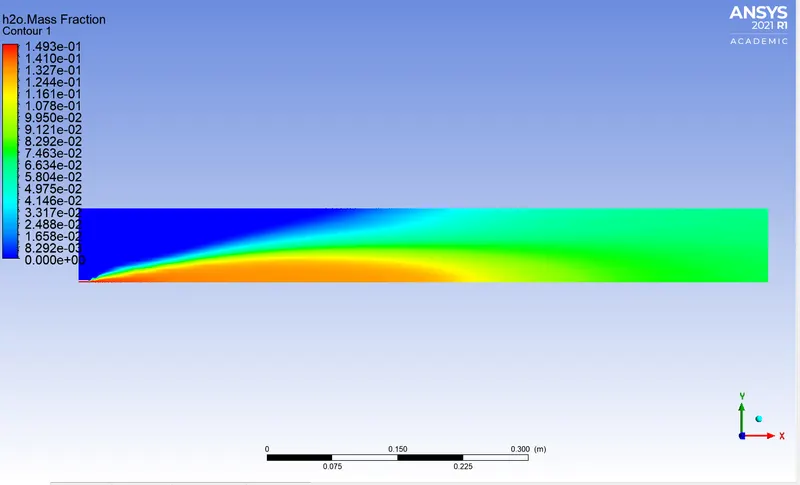
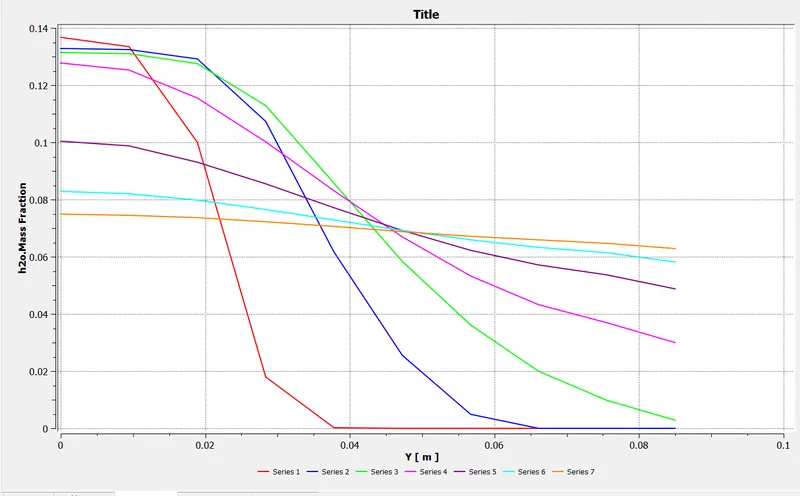
H2O Mass fraction
O2 Mass fraction
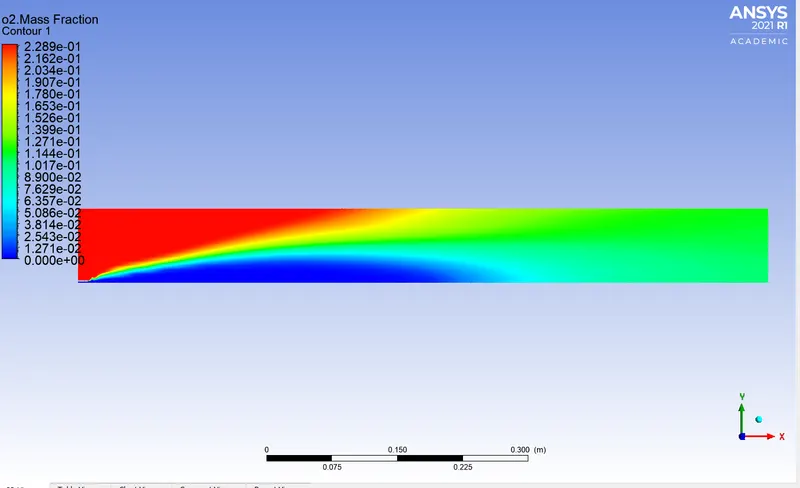
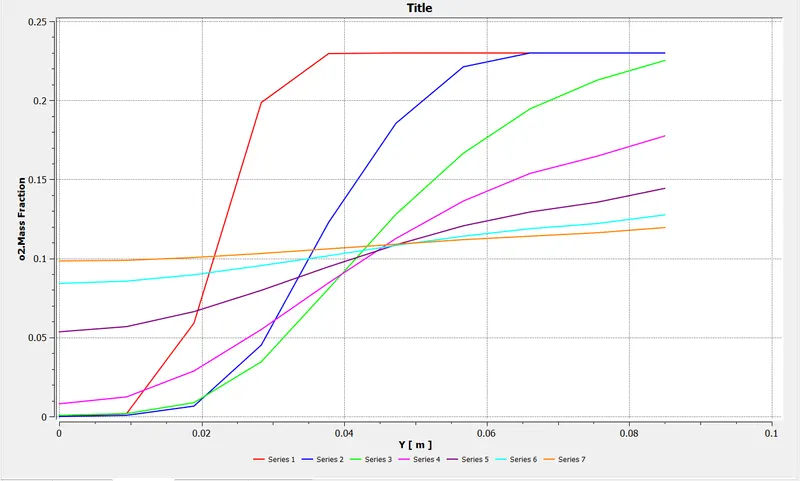
N2 Mass fraction
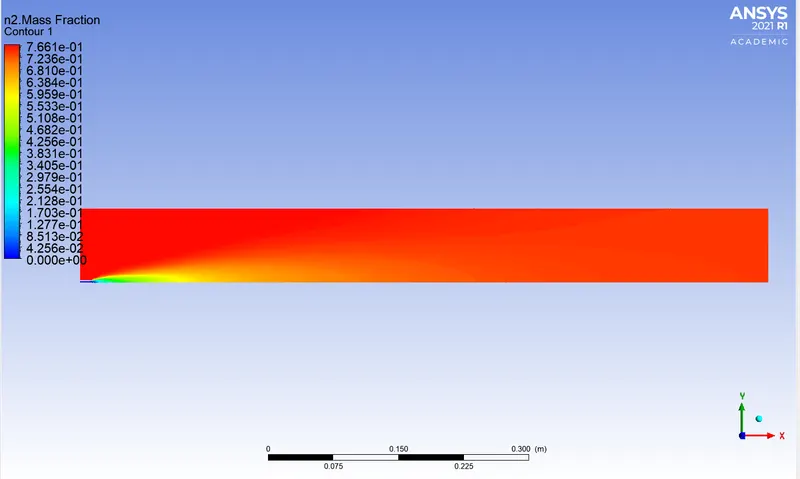
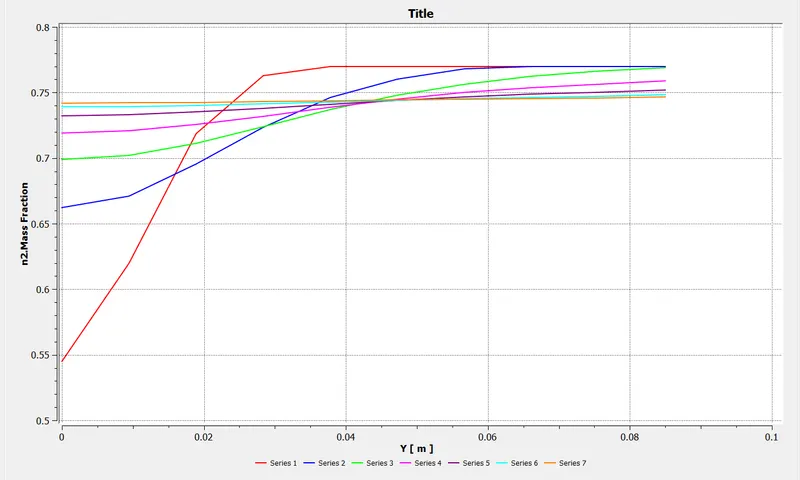
CH4 Mass fraction
Nox Mass fraction
Soot Mass fraction
3.For 25% addition of water
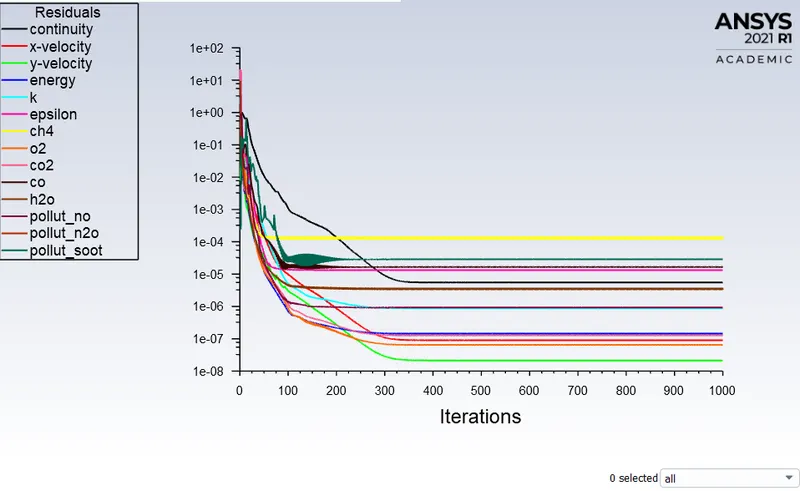
Residual Plot:
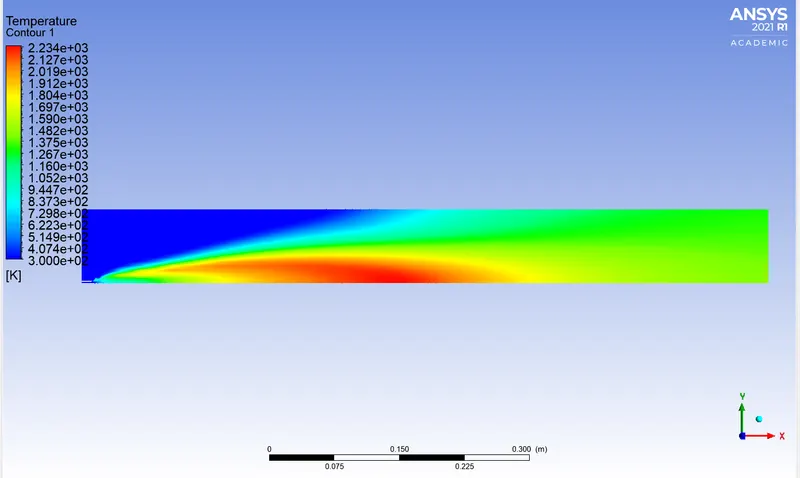
Temperature Counter:
CO Mass fraction
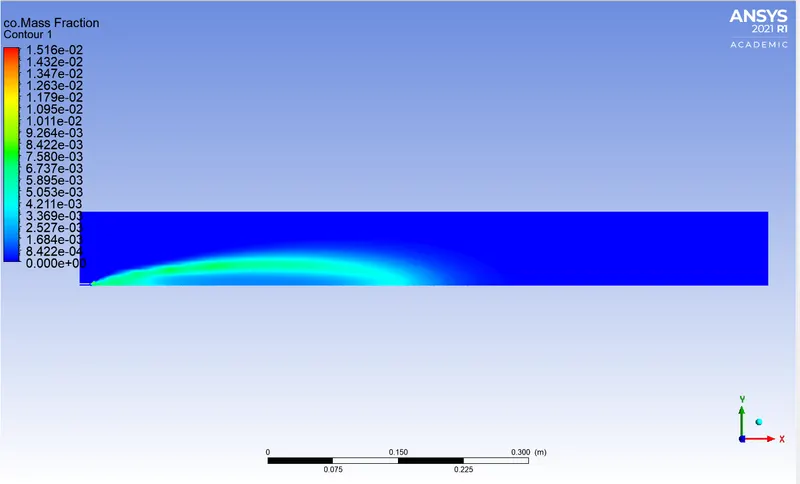
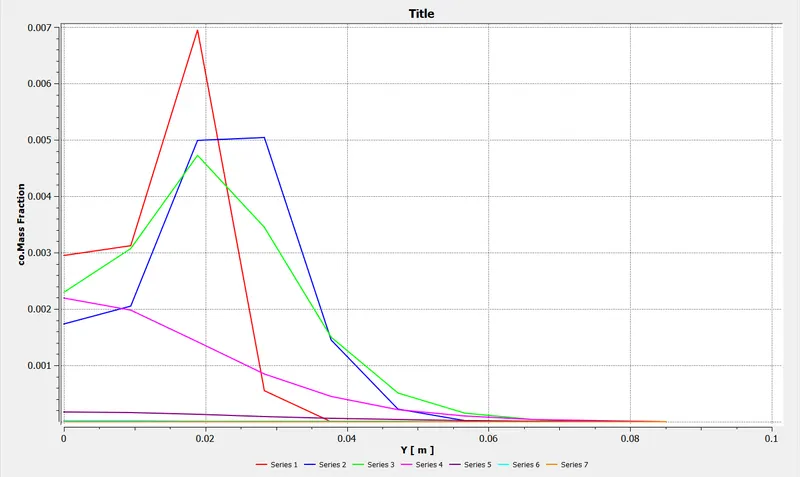
CO2 Mass fraction
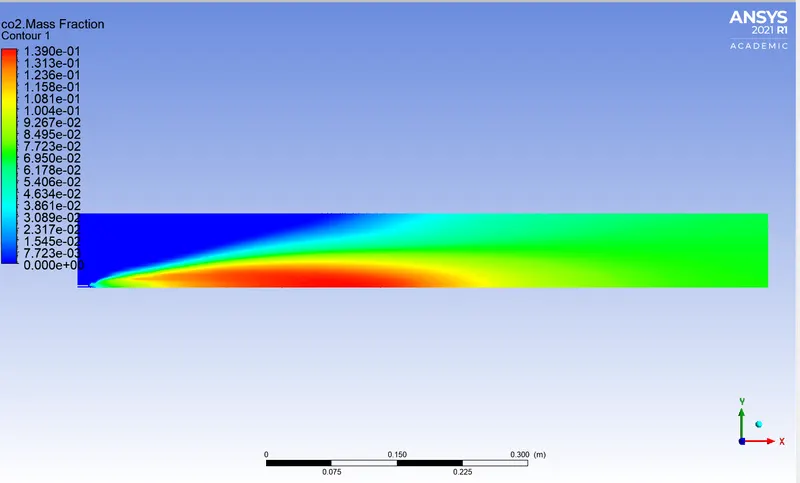
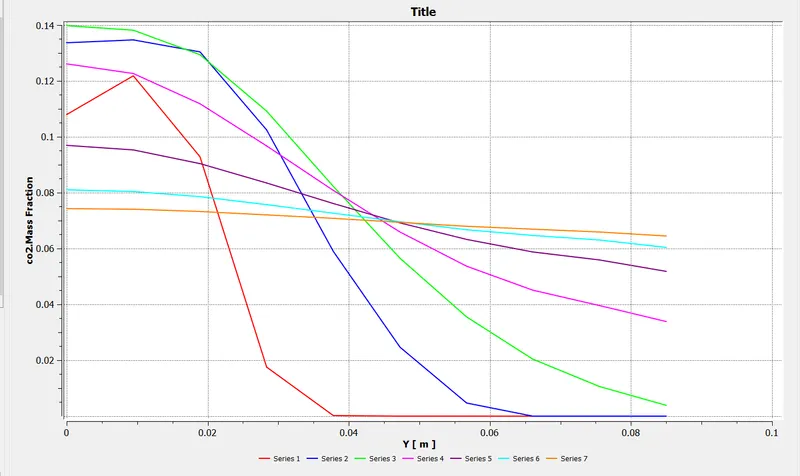
H2O Mass fraction
O2 Mass fraction
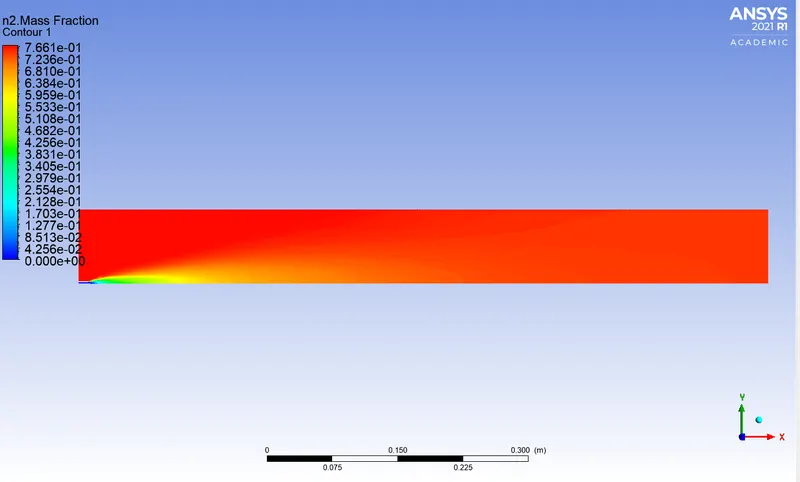
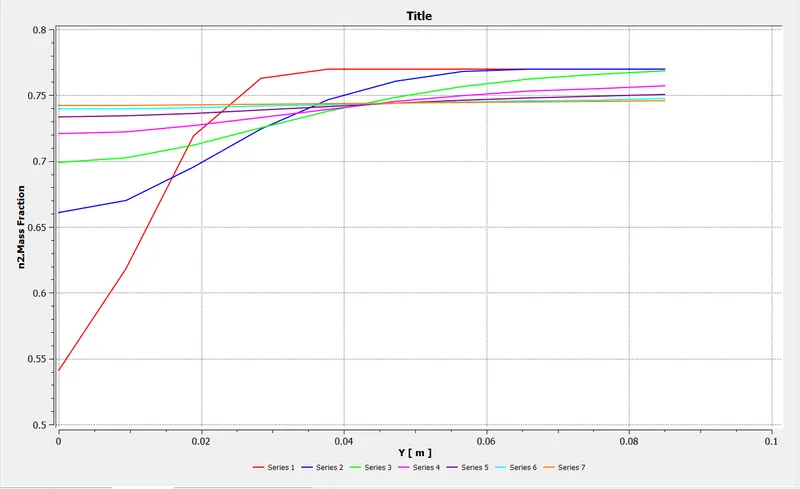
N2 Mass fraction
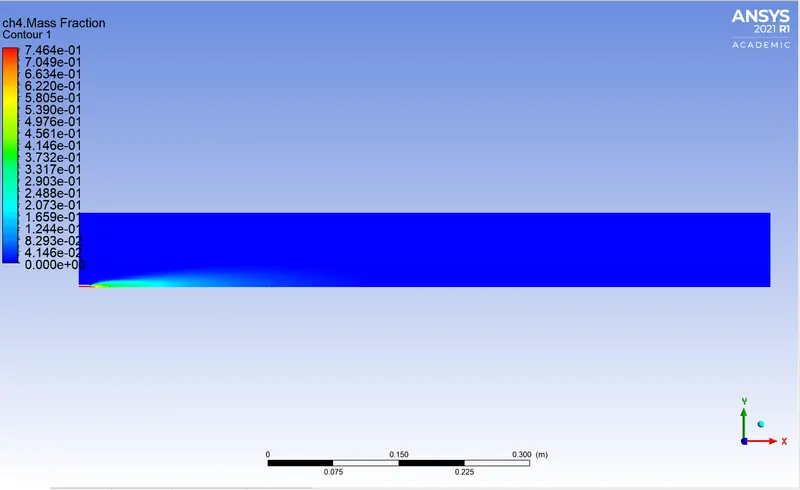
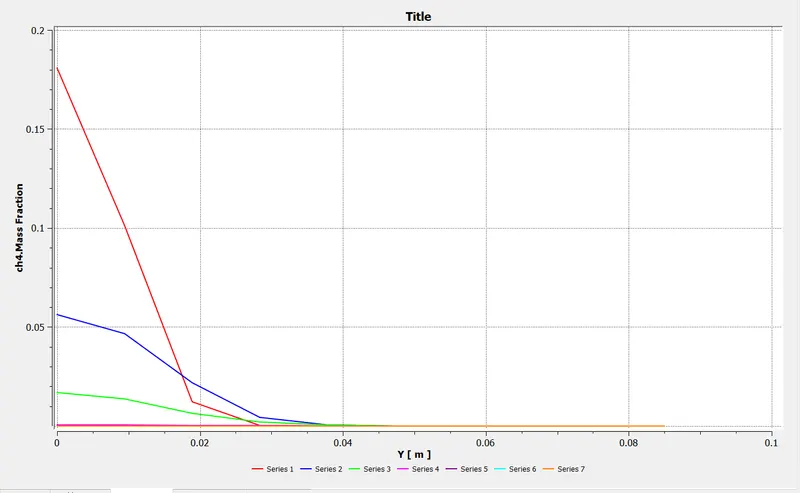
CH4 Mass fraction
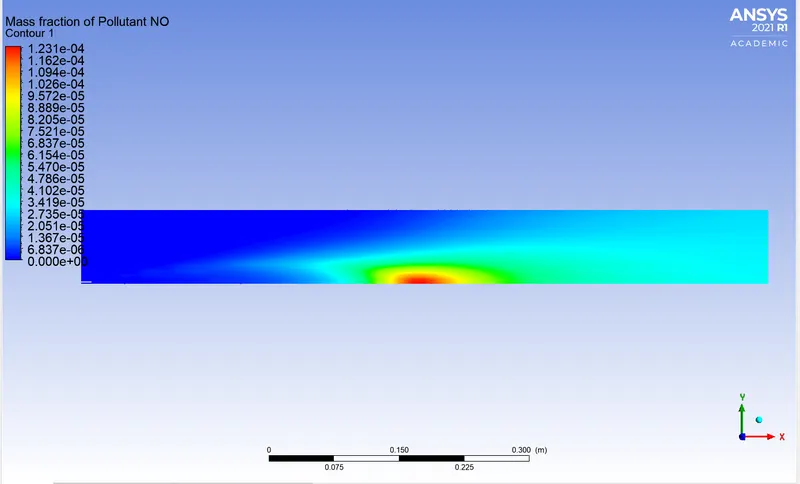
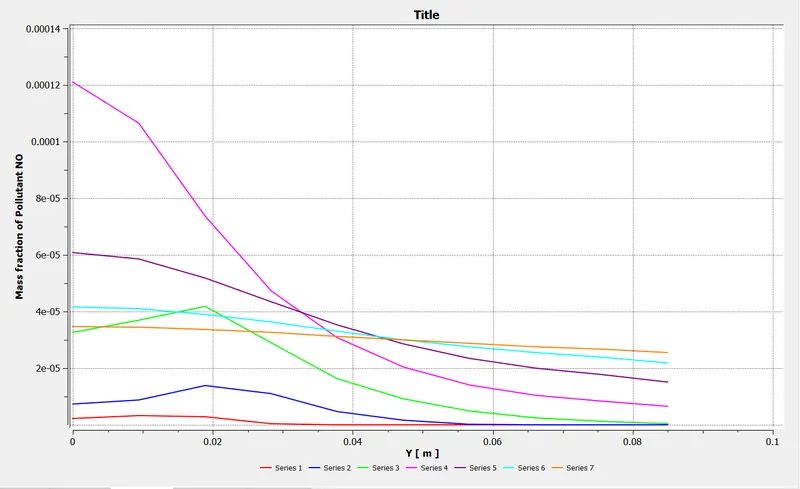
Nox Mass fraction
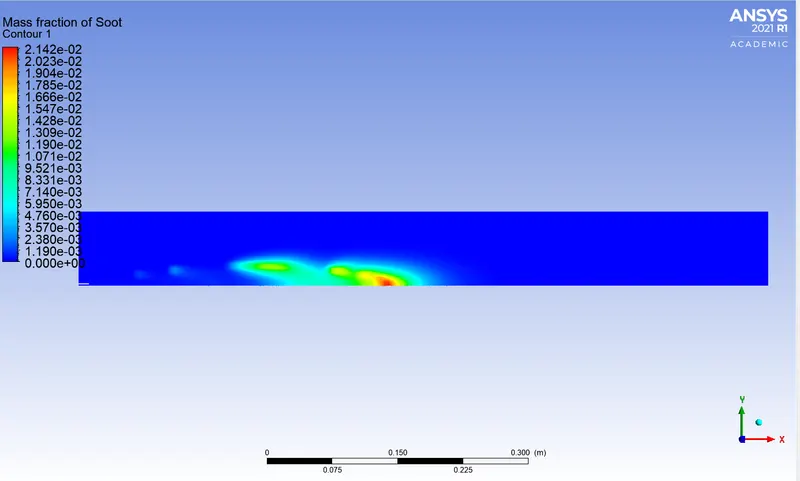
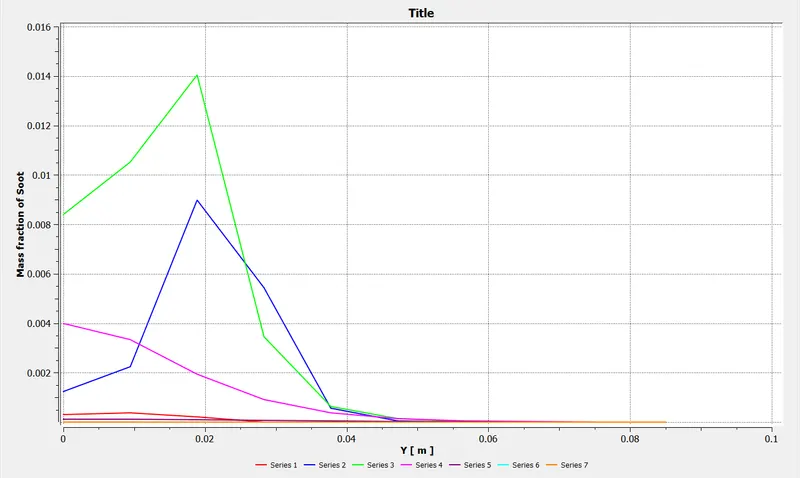
Soot Mass fraction
4.For 30% addition of water
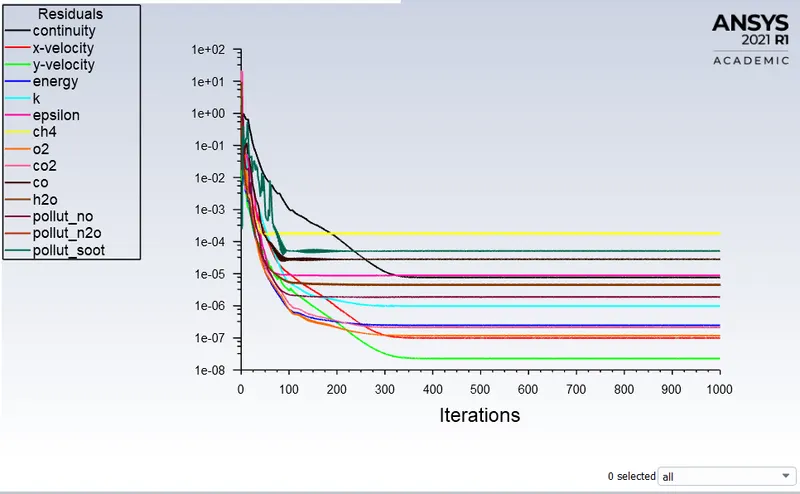
Residual Plot:
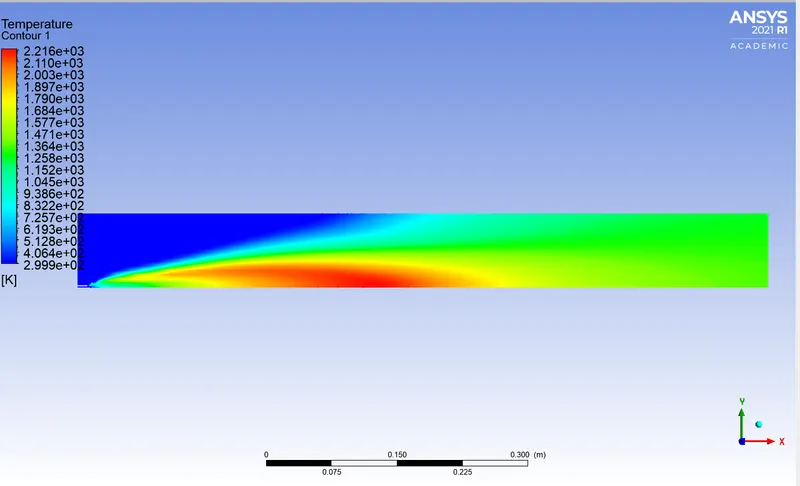
Temperature Counter:
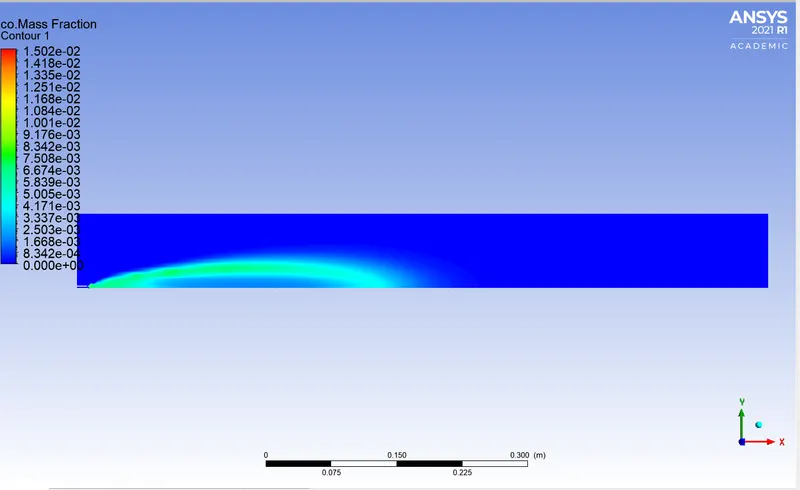
CO Mass fraction
CO2 Mass fraction
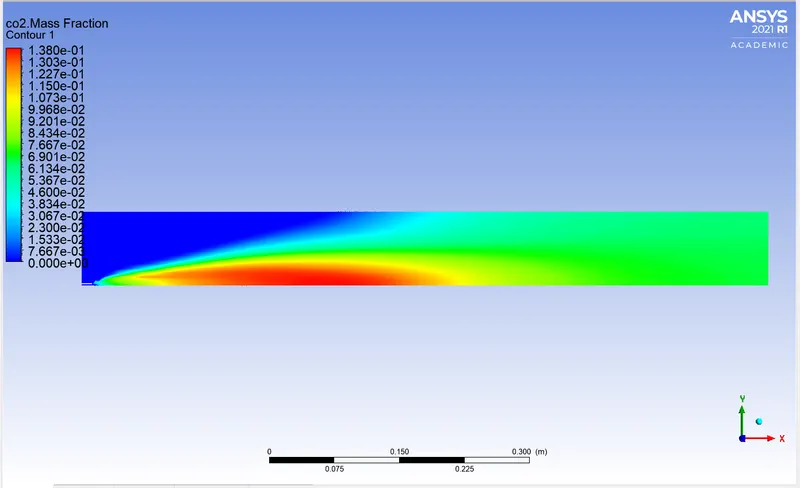
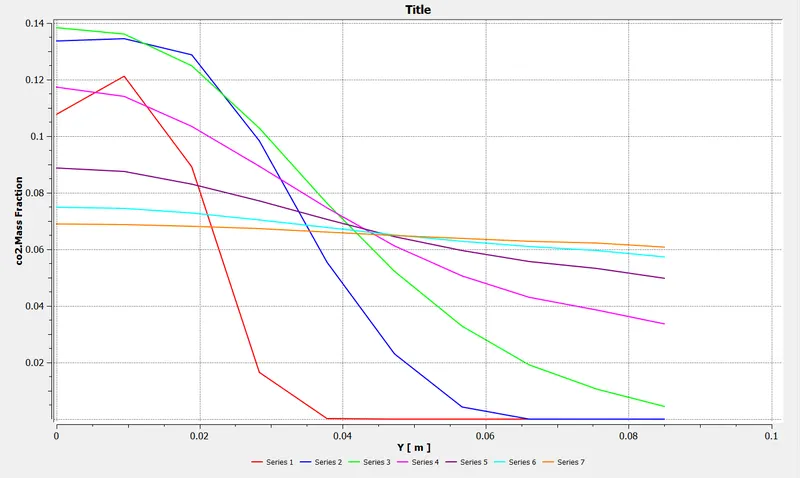
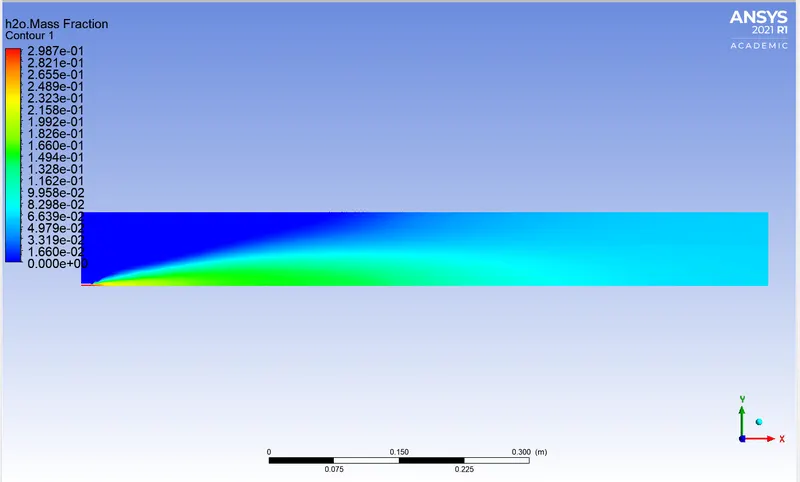
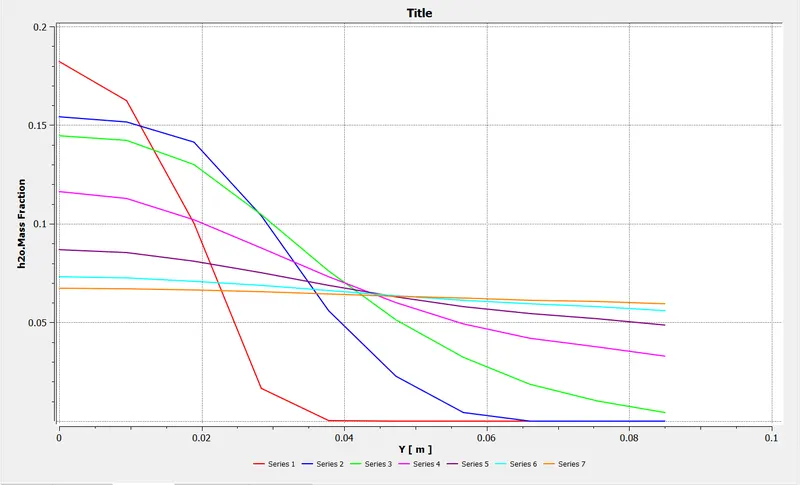
H2O Mass fraction
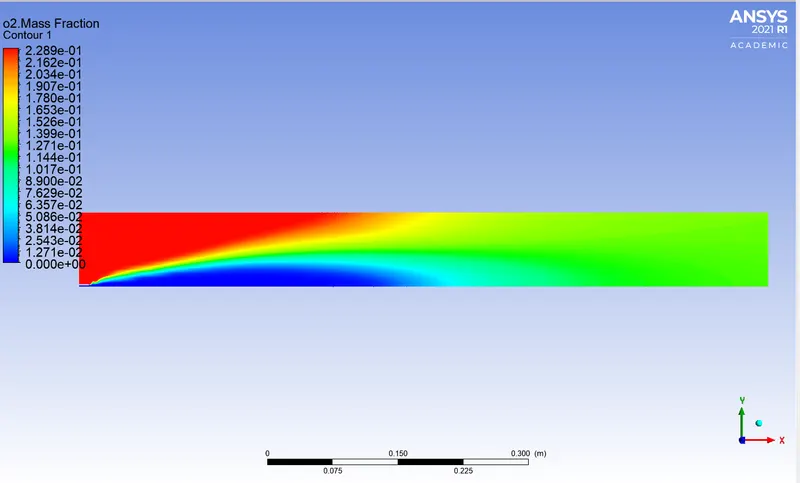
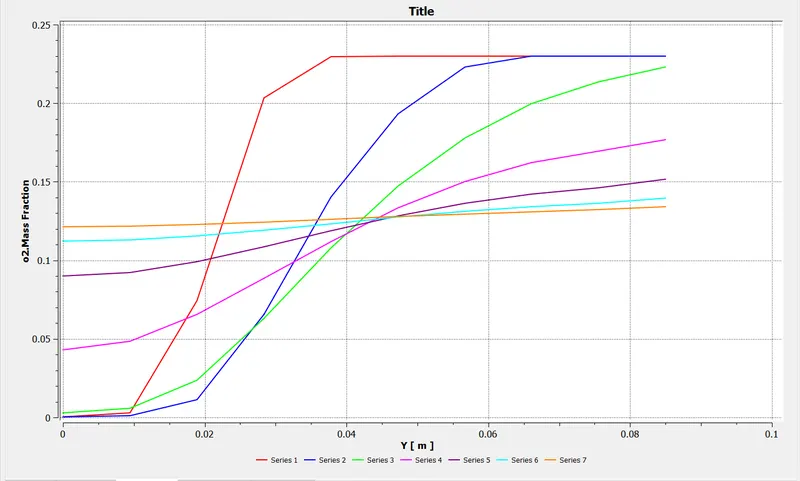
O2 Mass fraction
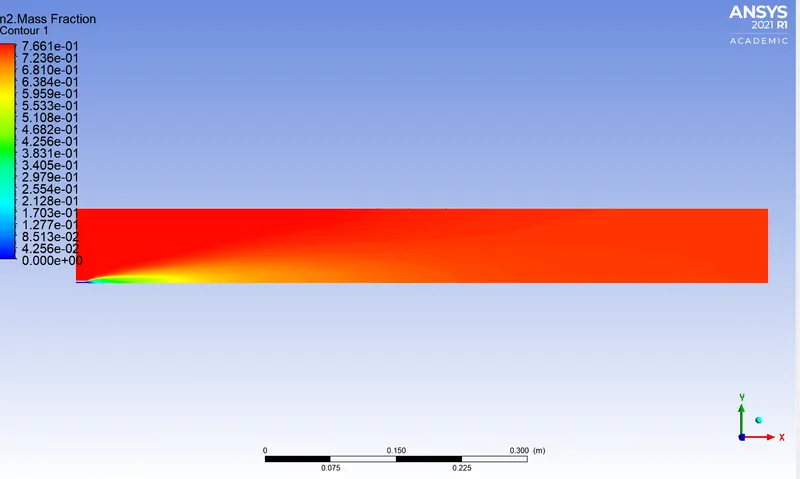
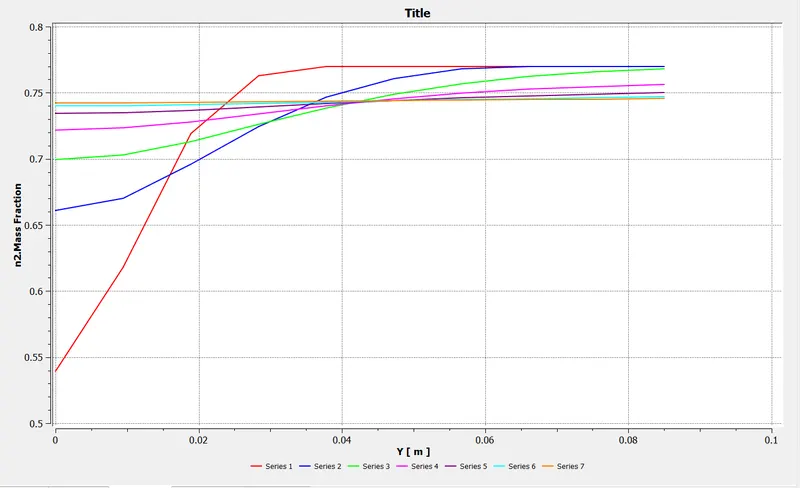
N2 Mass fraction
CH4 Mass fraction
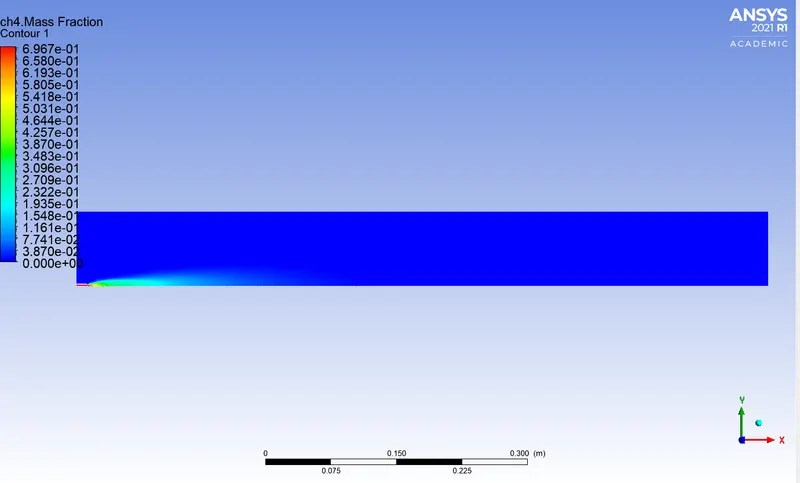
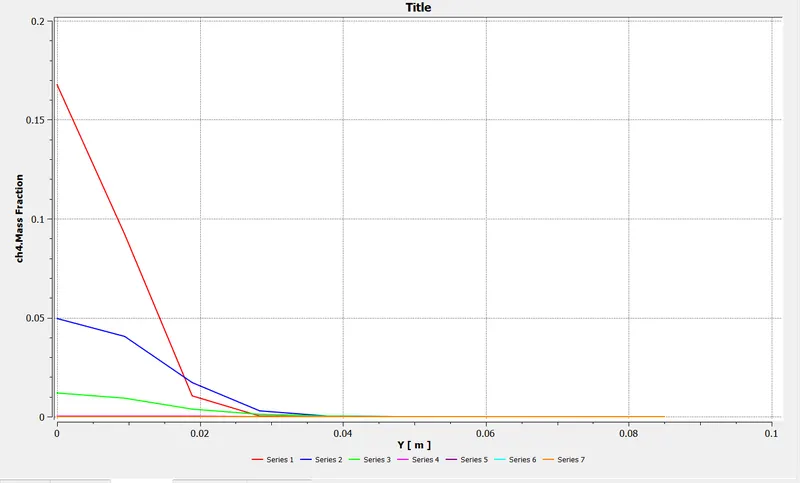
Nox Mass fraction
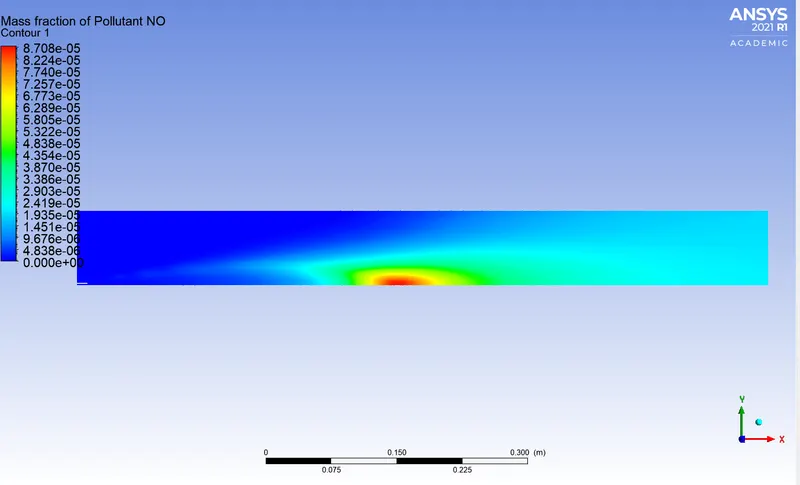
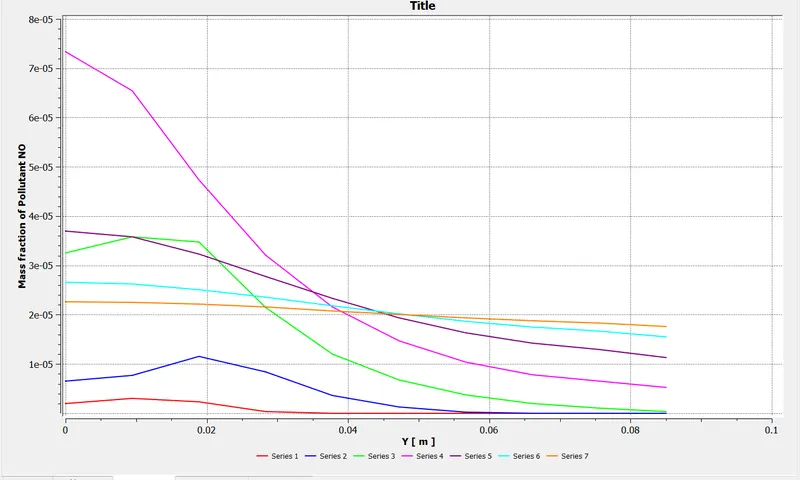
Soot Mass fraction
CONCLUSION:
1. With the increase in the Mass fraction of water in the fuel-air mixture NOx pollutant is reduced.
2. With the increase in the Mass fraction of water in the fuel-air mixture Soot formation is reduced.
3. With the increase in the Mass fraction of water in the fuel-air efficient mixture of fuel-air is achieved.
4. With the increase in the Mass fraction of water in the fuel-air mixture temperature of the exhaust gases is reduced.
5. With the increase in the Mass fraction of water in the fuel-air mixture velocity of the exhaust gas is reduced.