Week 10 - Simulating Combustion of Natural Gas.
AIM:
The objective of the report is to perform a combustion simulation using Ansys fluent and validate the results. In the combustor, due to combustion, various flue gases are produced and the mass fractions of the flue gases are plotted.
THEORY:
Combustion -
Combustion is an exothermic process where, organic compounds are completely burnt in the presence of oxygen and get oxidized to CO2 and water. In combustion, oxidation of organic compound occurs that happen after a series of complex reactions. The main difference between combustion and fuel oxidation is that in combustion, a large amount of heat is released which increases the temperature of the system. Therefore combustion is self-accelerating process.
So, in combustion, the end state products depends on the intermediate reactions which makes the process more complex and it requires a lot of computational power to model combustion process using CFD packages.
Combustion models-
1) Finite rate chemistry model- In this model, the data of intermediate/elementary reactions are inputed in the form of thermodynamic and mech data files. These files contains the elementary reaction information such as temperature limits, molecular composition of species, products formed after each elementary reaction and combustion delay time. So, the finite rate chemistry model is the most accurate model for modelling combustion process and it requires huge computational power.
2) Mixing based models- In this model, the ignition delay time is not computed as per the finite rate chemistry model. This model uses turbulence parameters such as k and epsilon to compute the ignition delay time so, this model is also known as turbulent chemistry interaction model. This model is not accurate as finite rate chemistry model but its take less computational time and power.
3) Finite rate eddy dissipation model - This model is a combination of both finite rate chemistry and eddy dissipation model. This model is used to overcome the errors that occurs in the turbulence dissipation model. This model is used to overcome the instantaneous burning problem.
In ANSYS FLUENT, the combustion modelling is classified into the following types-
1) Based on mixing of air and fuel -
- Non-Premixed combustion - In this model, the air and fuel is injected into the combustion chamber without premixing. In diesel engine this type of modelling is used.
- Premixed combustion - In this model, the premixed air and fuel is injected into the combustion chamber. In petrol engine this type of modelling is used. Generally, in carburetor, premixng takes place.
- Partially premixed - In this model, partial premixing of air and fuel takes place.
2) Based on the phase where combustion occurs -
- Fluid phase - In this model, the combustion occurs in the fluid phase which indicates that fuel material is fluid. The volumetric reactions models are used to perform these kind of simulations.
- Wall - In this model, combustion occurs on the wall surfaces. The surface reactions models are used to perform these kind of simulations.
- Particles - In this model, combustion occurs on the particle surfaces. The surface reactions models are used to perform these kind of simulations. Coal combustion is one of the application of this type of model.
Equations need to be solved in combustion process -
In modelling combustion process, along with the regular Navier stokes equations like mass, momentum and energy equations, species transport equations are also solved such that reactants and product terms are analysed.
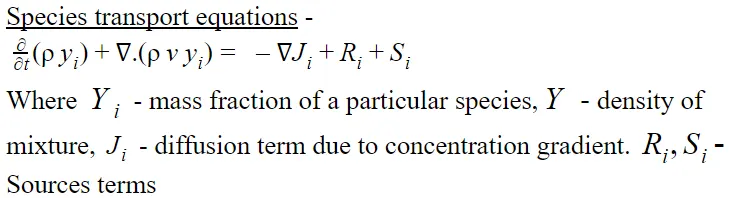
Generally, the diffusion term is comprised of two types of terms namely - laminar and turbulent diffusion.
In engineering applications, the laminar diffusion term is neglected as the effect of laminar diffusion is negligible compared to turbulent diffusion.
Methods to minimize nitrogen oxides in exhaust gases -
In recent years, due to industrial revolution and modernization, air pollution has significantly increased. The exhaust gases contains species like cabon oxides, nitrogen oxides, unburnt fuel compunds, sooth etc. Out of all these species, oxides of nitrogen are more toxic in nature. So, by adding water to the fuel, the nitrogen oxides can be minimized and this method is discussed in the paper.
PROCEDURE:
In this report, combustion simulation is performed in two different case setups.
In case 1, methane gas combustion simulation is performed and mass fraction of species in flue gases such as CO2, H2O, CH4, N2, O2, NOx emissions & Soot formation are plotted.
In case2, methane gas combustion simulation is performed by adding water content to the fuel and mass fraction of species in flue gases are plotted.
In order to perform combustion simulation, certain steps has to be followed.
Step 1 - Geometry
First import the cad model in space claim.
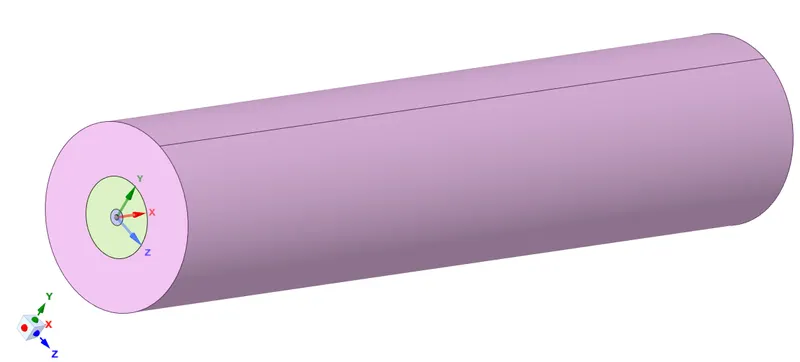
The combustion occurs in the gas combustor that is cylindrical in shape. The fuel gas is inputted at the center of the cylinder. Since, the model is axi-symmetric one and variables gradient along theta is neglected, the simulation is performed by using axi symmetric wedge boundary conditions.
So, extract the 2D surface by splitting the model as shown in the fig.

Next, in order to generate conformal meshing, enable share topology by Workbench -> Share.
Step 2 - Mesh
First, before generating the mesh, assign names to the parts and boundaries in named selection as shown in the fig.

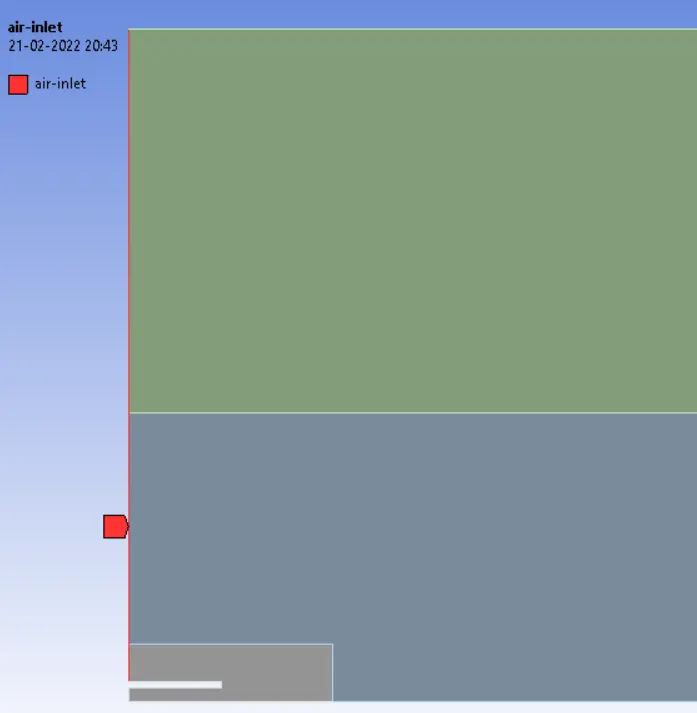



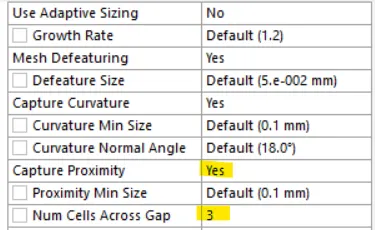
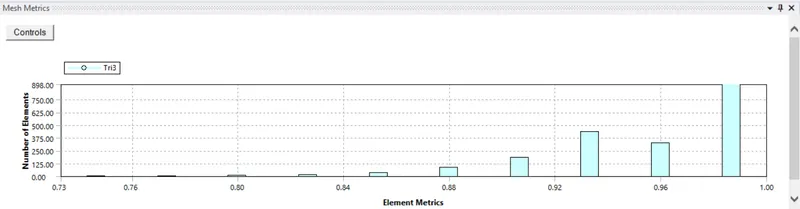
Next, generate traingular mesh of element size 10mm. A total of 1,972 elements are generated
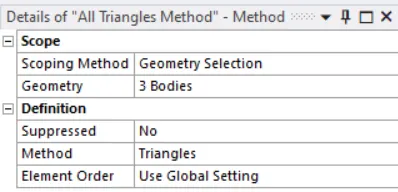

Since, the minimum element quality is 74.6%, the generated mesh is can produce accurate results.
Step 3 - Setup
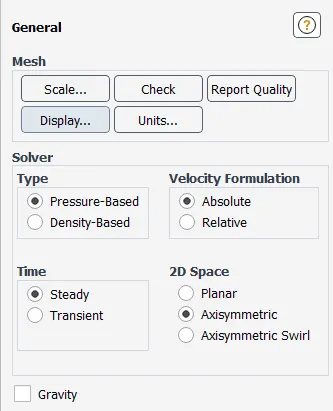
Solver type - Pressure based, Velocity formulation - Absolute, Time - Steady, enable axisymmetry conditions.
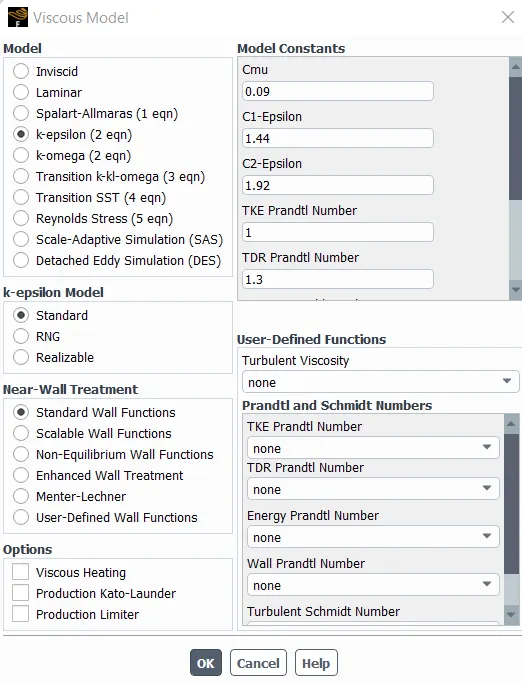
Viscous model - k - epsilon Turbulence model, with wall functions is used.
Since, combustion occurs in liquid phase, volumetric reaction model is selected.
Turbulence chemistry interactions - Eddy dissipation model
Mixture material - methane-air
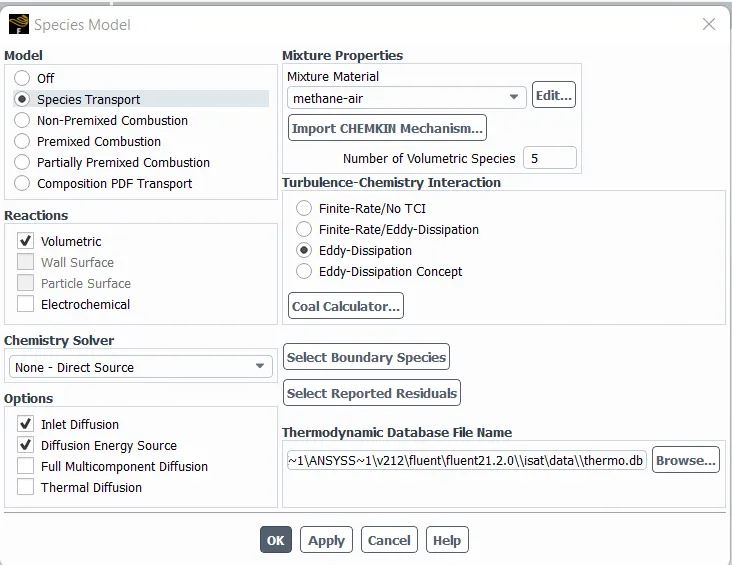
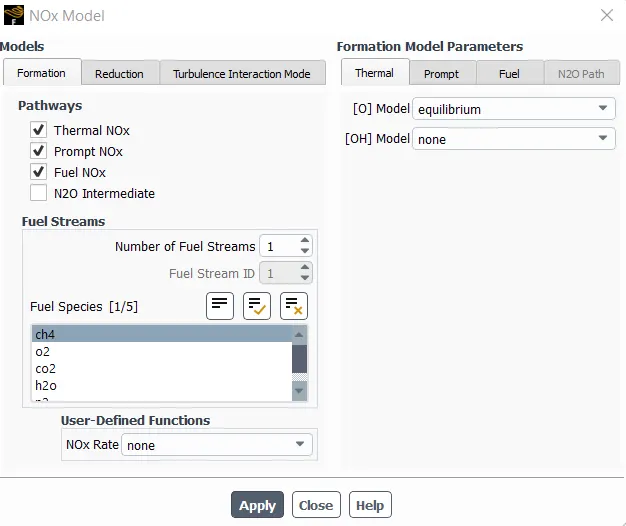
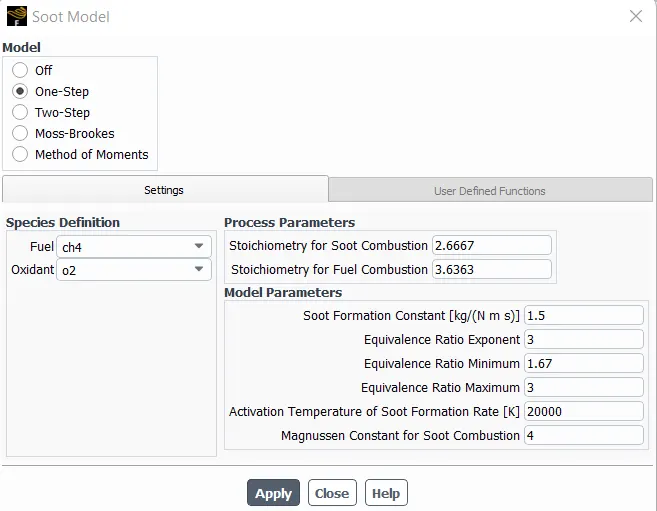
In order to plot oxides of nitrogen and soot species after combustion, enable NOX and soot models as shown in fig.
Fuel - CH4, Oxidant - o2
Chemical reaction occuring in the combustor -

Boundaries -
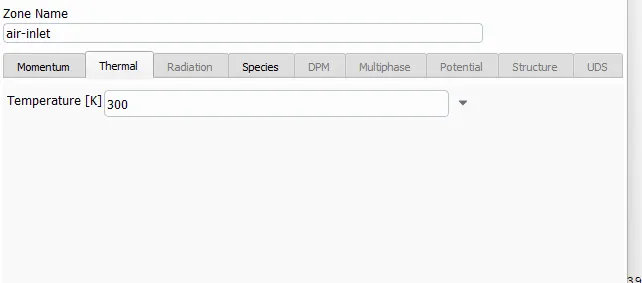
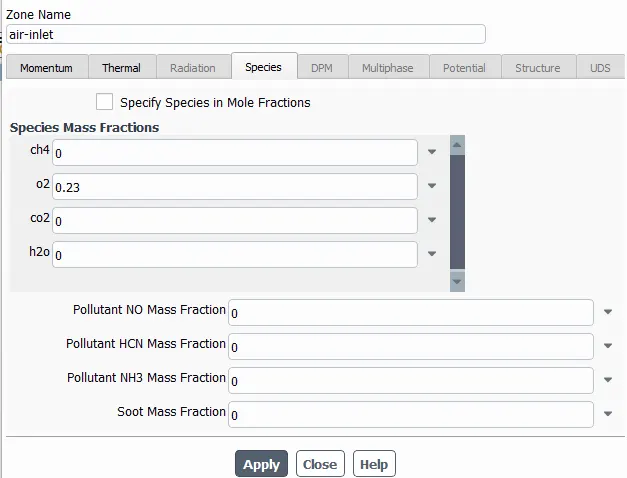
1) Air Inlet - inlet velocity = 0.5m/s, T = 300k, species O2 = 0.23 mass fraction
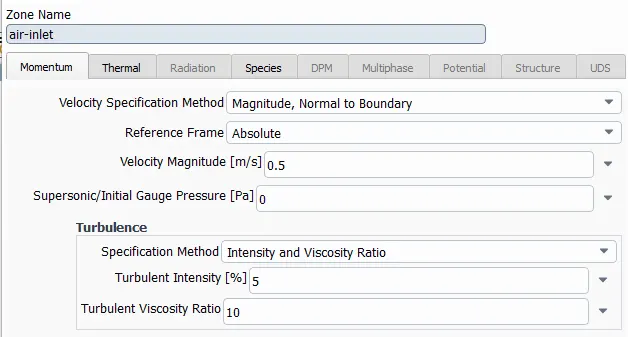
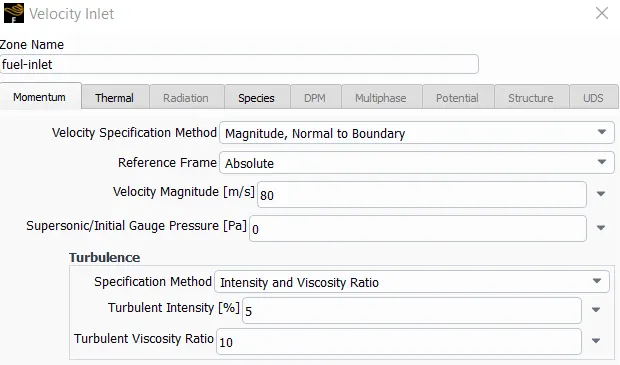
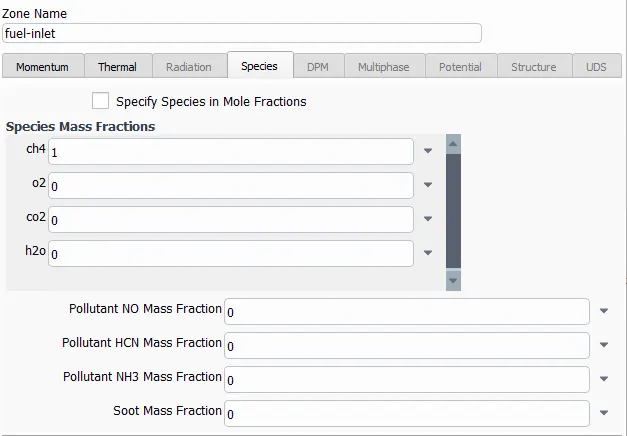
2) Fuel Inlet - inlet velocity = 80 m/s, T = 300k, species CH4 mass fraction = 1
3) oulet - Pressure = 0 gauge
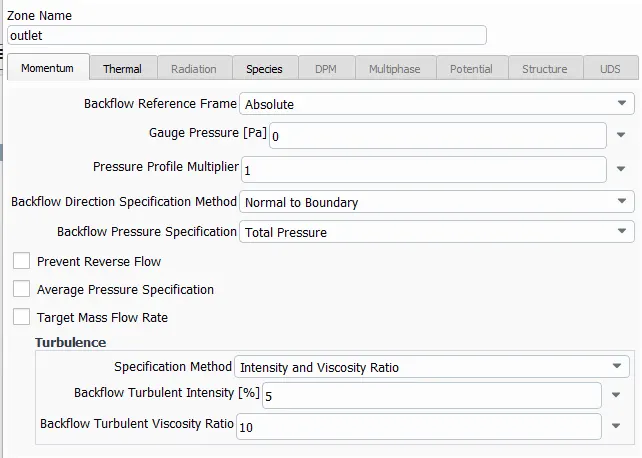
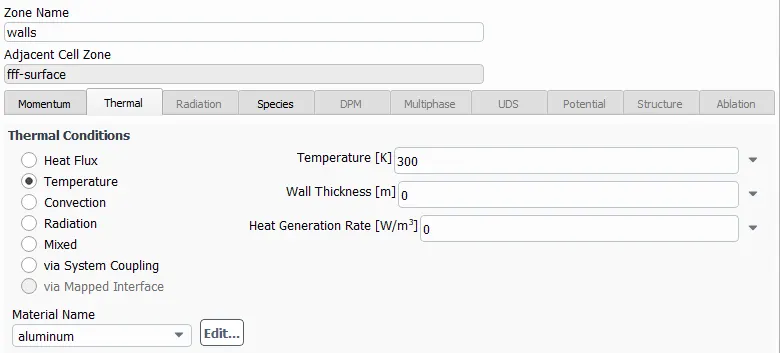
4) Wall - Temperature = 300K
Initialize the model with hybrid initialization method
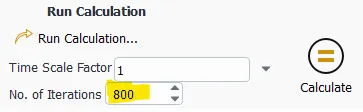
Run the model with 800 iterations
SOLUTIONS:
In CFD post, the exhaust gases are plotted for the two cases as discussed
Case 1 - No water added to fuel
The following fig shows the temperature contour plot. A maximum temperature of 2294.55K is achieved in the combustion process.
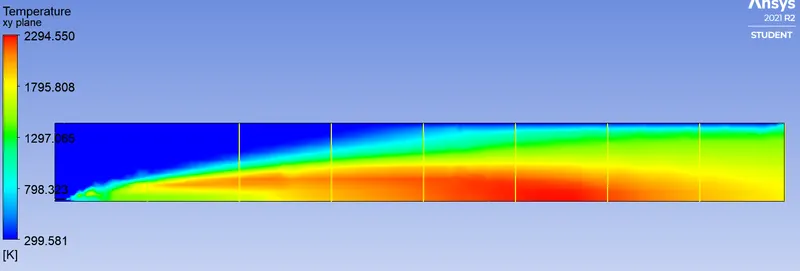
Next, the mass fraction of the different species obtained in the simulation using line probes at different locations of the combustor are plotted. The line probes are placed at a distance of 0.1 m from inlet and a total of 8 line probes are placed as shown in the fig.

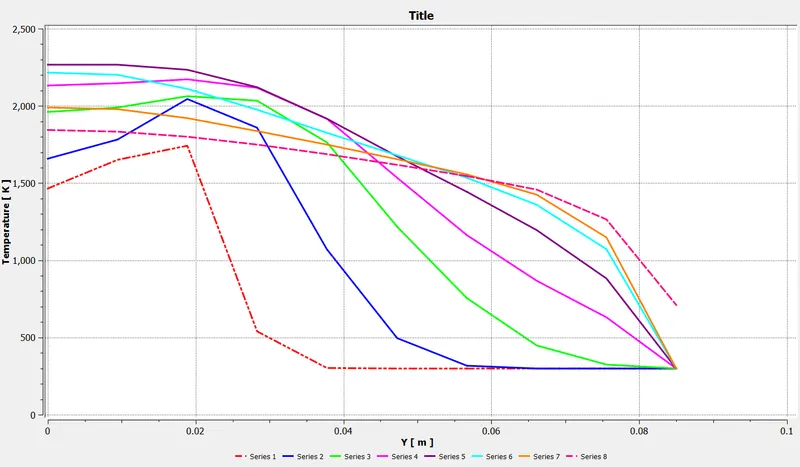
The line probe present in the combustor chamber are represented as from series 1 to series 8.
The line probe present at the outlet of combustion chamber is represented in dash line and the line probe present at 0.1m from inlet is represented in dash-dot line format.
Temperature at different line probes -
1) CO2 mass fraction -
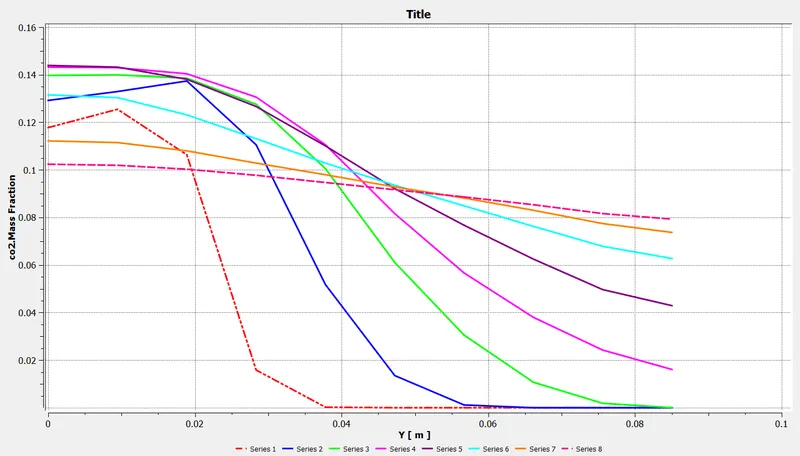
The total width of the combustion chamber is about 0.085m. From the plot, it is observed that, at line 1 probe, the mass fraction of CO2 is more at 0.01m width. The co2 species takes some time to diffuse to the top of the combustion chamber, it is observed that as we go from inlet to the outlet of combustion chamber, a smooth curve is obtained.
For line probe1, max co2 mass fraction is around 0.13 and at oulet, max co2 mass fraction is around 0.1
In the combustion chamber, max mass concentration of co2 is obtained at line probe5 and is of value around 0.14
2) H20 mass fraction -
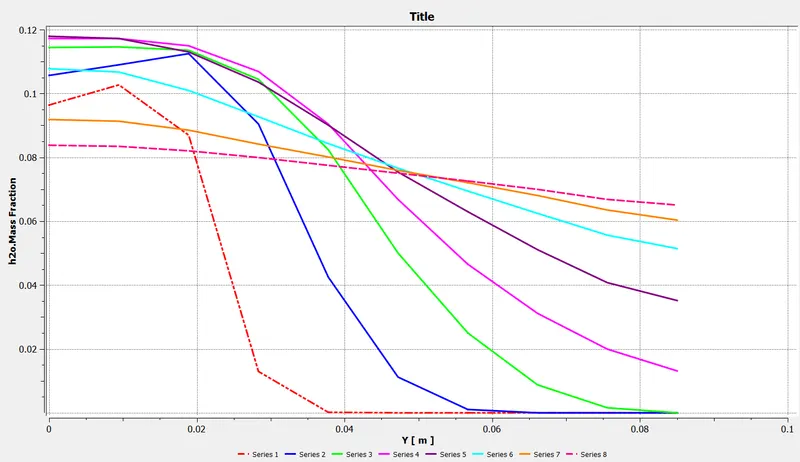
For line probe1, max H20 mass fraction is around 0.1 and at outlet, max H20 mass fraction is around 0.08
In the combustion chamber, max mass concentration of H20 is obtained at line probe5 and is of value around 0.12
3) CH4 mass fraction -
From the plot, it is observed that, since fuel is burned in the combustion chamber, the mass concentration of CH4 continuously decreases along the length of the combustion chamber. After line probe 5, the CH4 is completely burned as the mass fraction is zero for line probes 6 to 8. 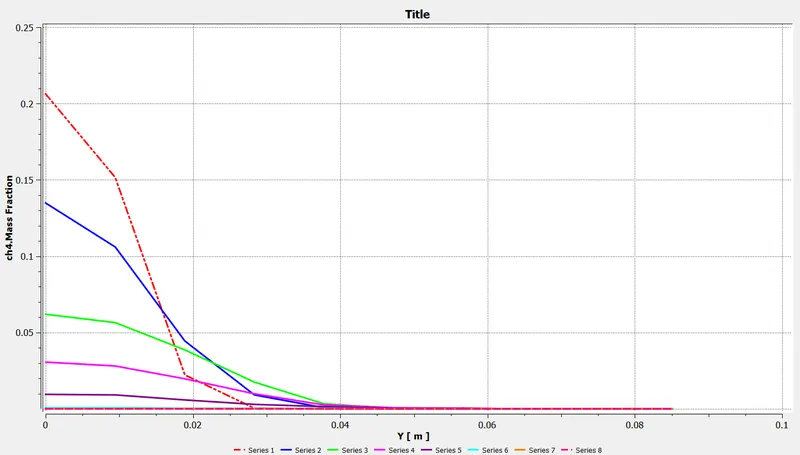
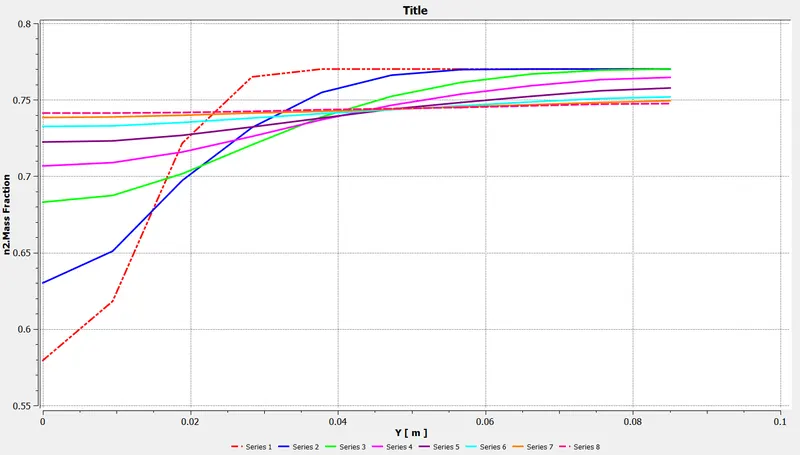
4) n2 mass fraction -
For line probe1, max n2 mass fraction is around 0.77 and at outlet, max H20 mass fraction is around 0.74
5) 02 mass fraction -
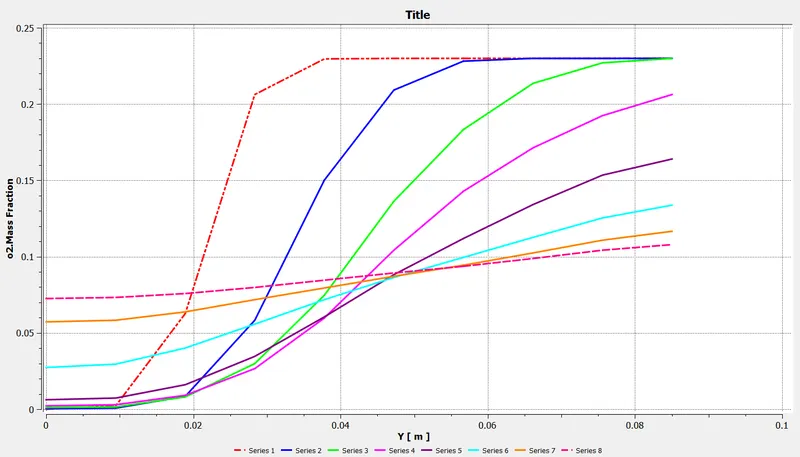
From the plot, it is observed that, since for oxidation of fuel, oxygen is required, the mass concentration of O2 continuously decreases untill oxidation process occurs.
6) NO mass fraction -
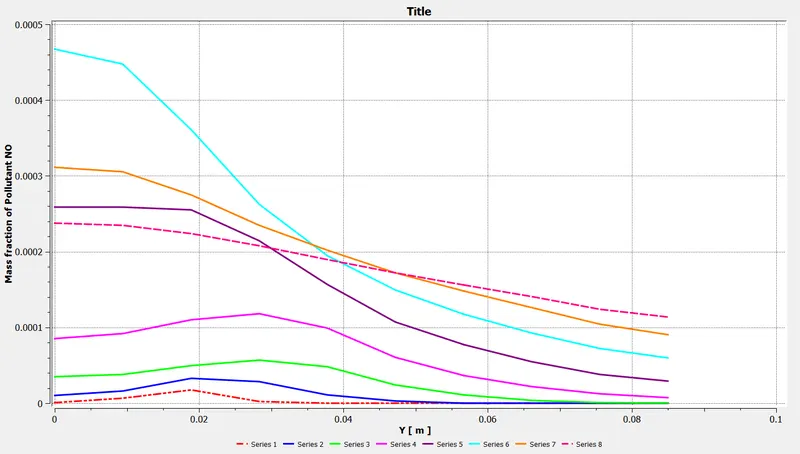
From the plot, it is observed that, in the combustion chamber, max mass concentration of nitrogen oxidants is obtained at line probe6. Since, from the temperature contour, the maximum temperature occurs at line probe 6 of value 2200K, nitrogen is oxidized at high temperature.
7) SOOT mass fraction -
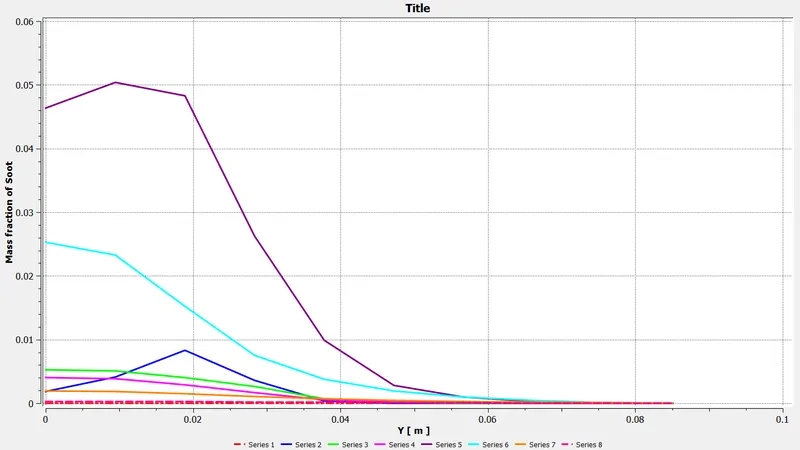
From the plot, it is observed that, in the combustion chamber, max mass concentration of soot is formed at line probe5 of maximum mass concentration value 0.05
Case 2 - Water added to fuel about 5%, 10%, 15%, 20%, 25%, 30%
The following fig shows the NOX mass fraction values for various % water added.
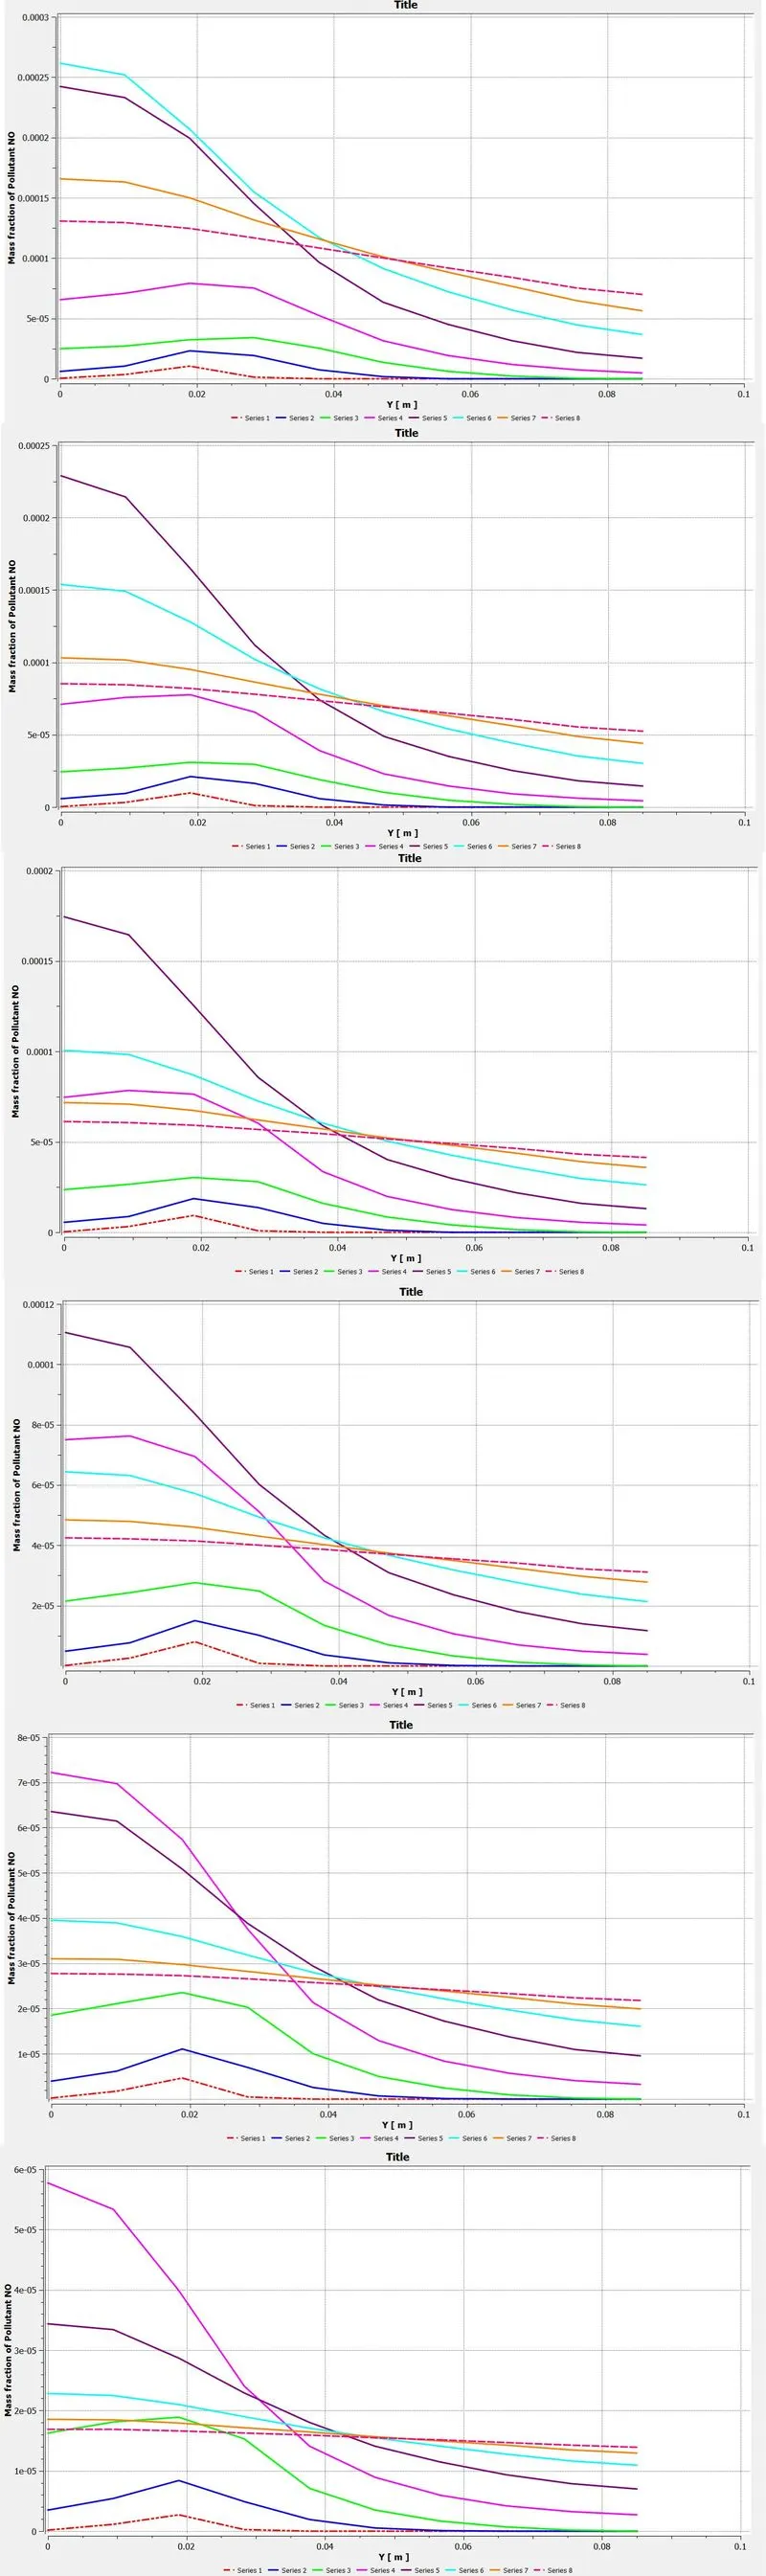
From the above plot, it is observed that as due to water addition in the fuel, the mass fraction of NOX pollutant is reduced.
For 5% water added, maximum NOX mass fraction is about 0.026 and for 30% water added, maximum NOX mass fraction is about 6e-5.So, as the water content is increased by a factor of 6, there is a total decrease in NOX mass fraction by a factor of 0.0023.
The following fig shows the SOOT mass fraction values for various % water added.
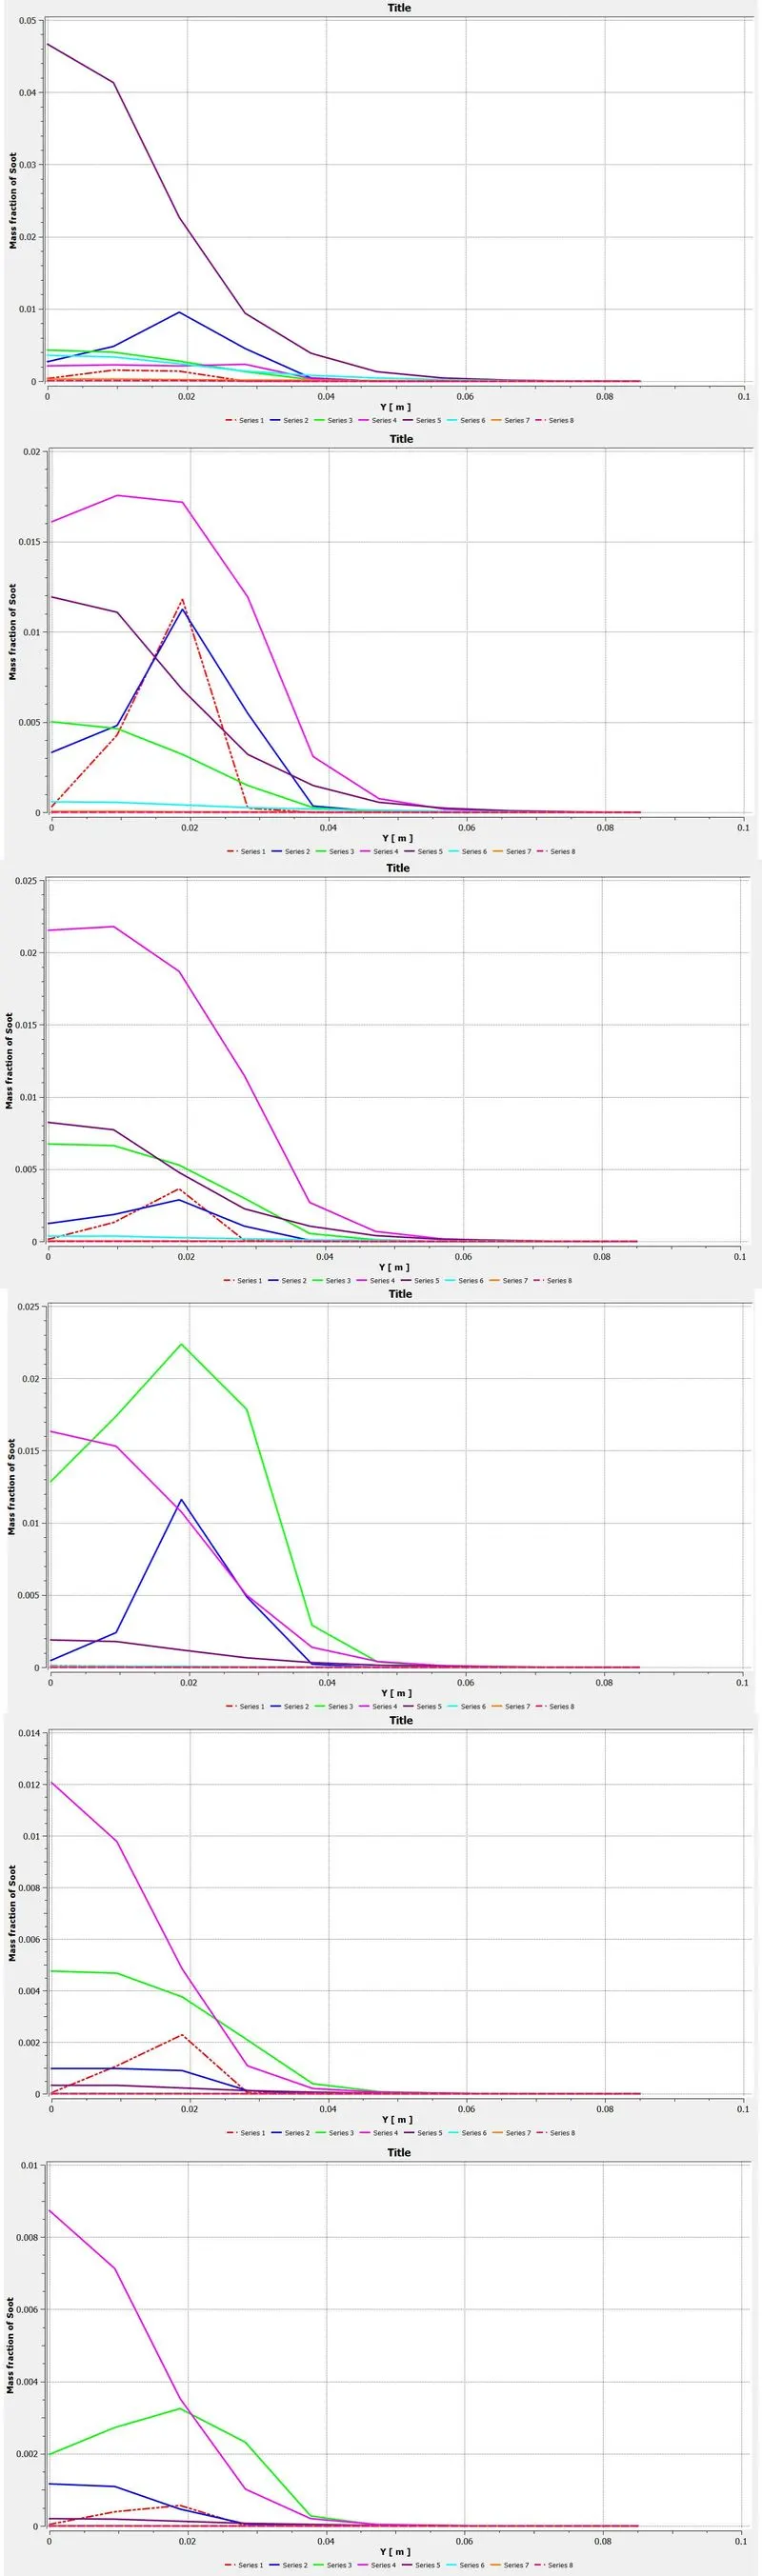
From the above plot, it is observed that as due to water addition in the fuel, the mass fraction of SOOT pollutant is reduced.
For 5% water added, maximum SOOT mass fraction is about 0.048 and for 30% water added, maximum SOOT mass fraction is about 0.0089. So, as the water content is increased by a factor of 6, there is a total decrease in SOOT mass fraction by a factor of 0.185
The following fig shows the temperature values for various % water added.
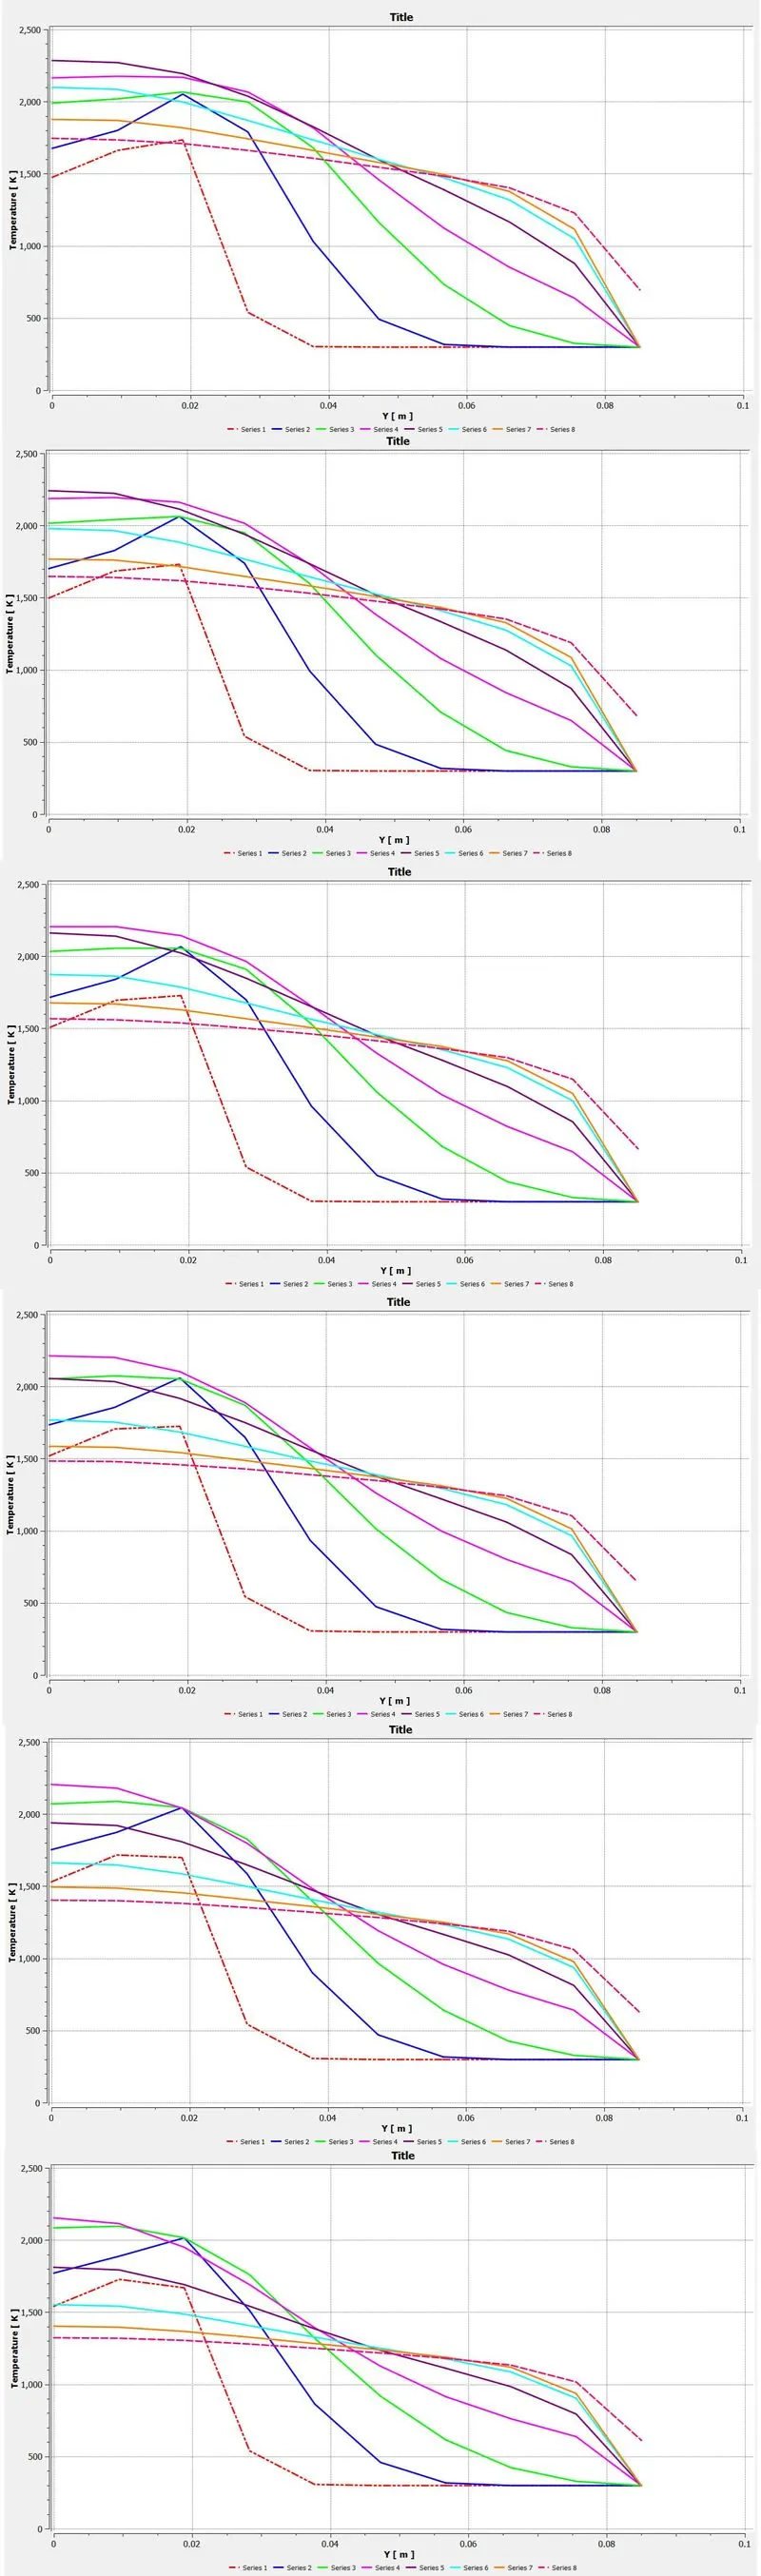
The following fig shows the co2 mass fraction values for various % water added.
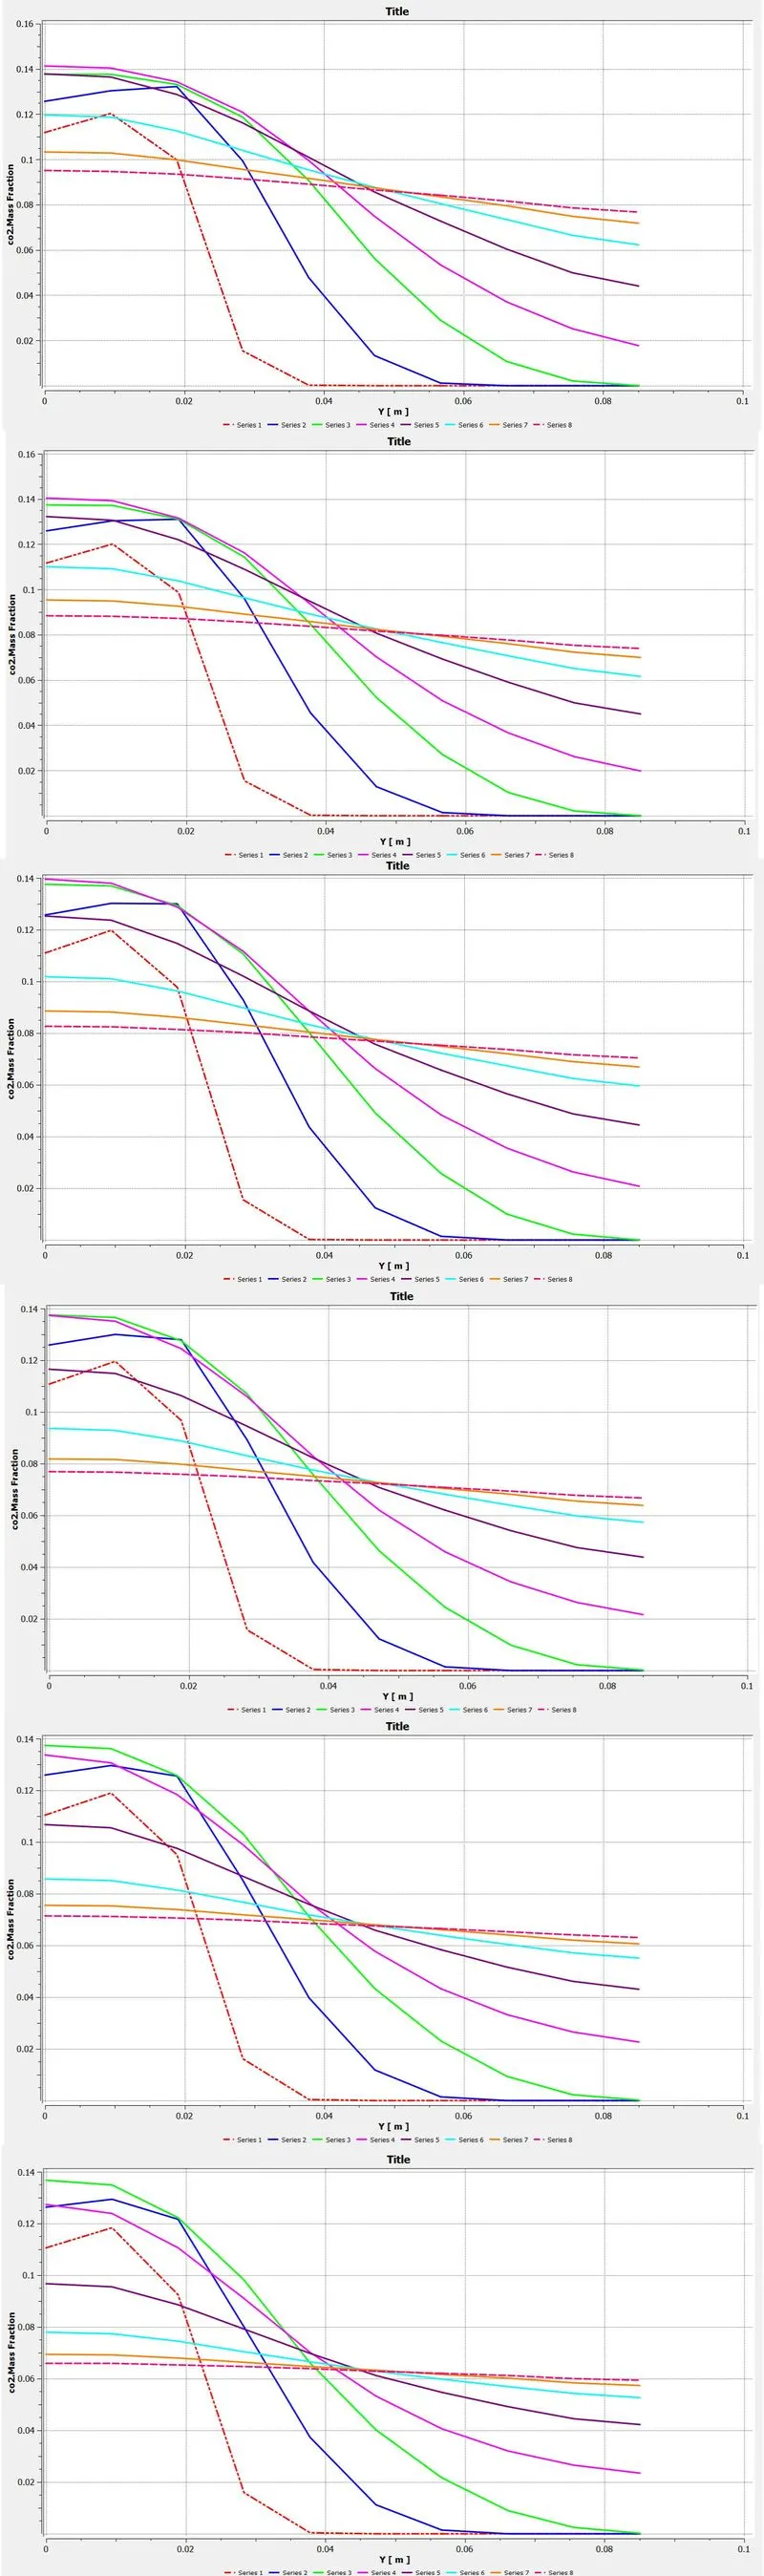
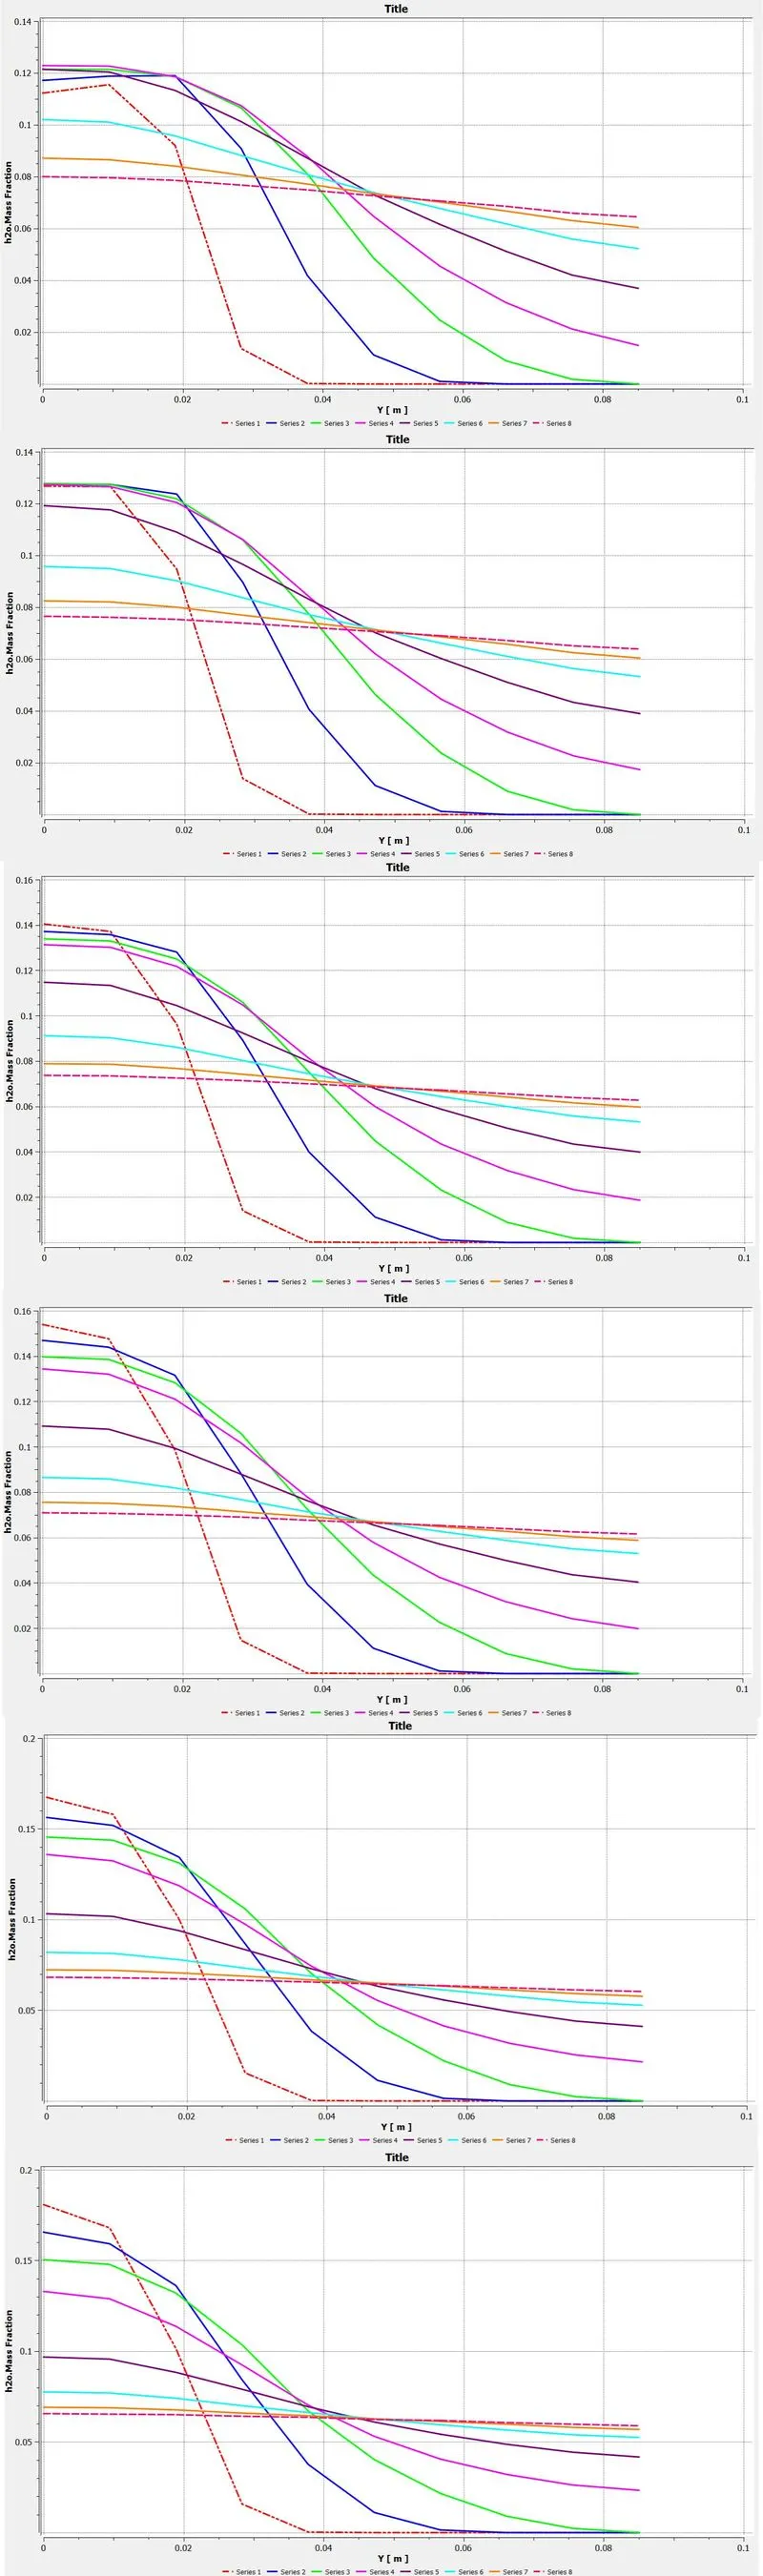
The following fig shows the H2O mass fraction values for various % water added.
The following fig shows the CH4 mass fraction values for various % water added.
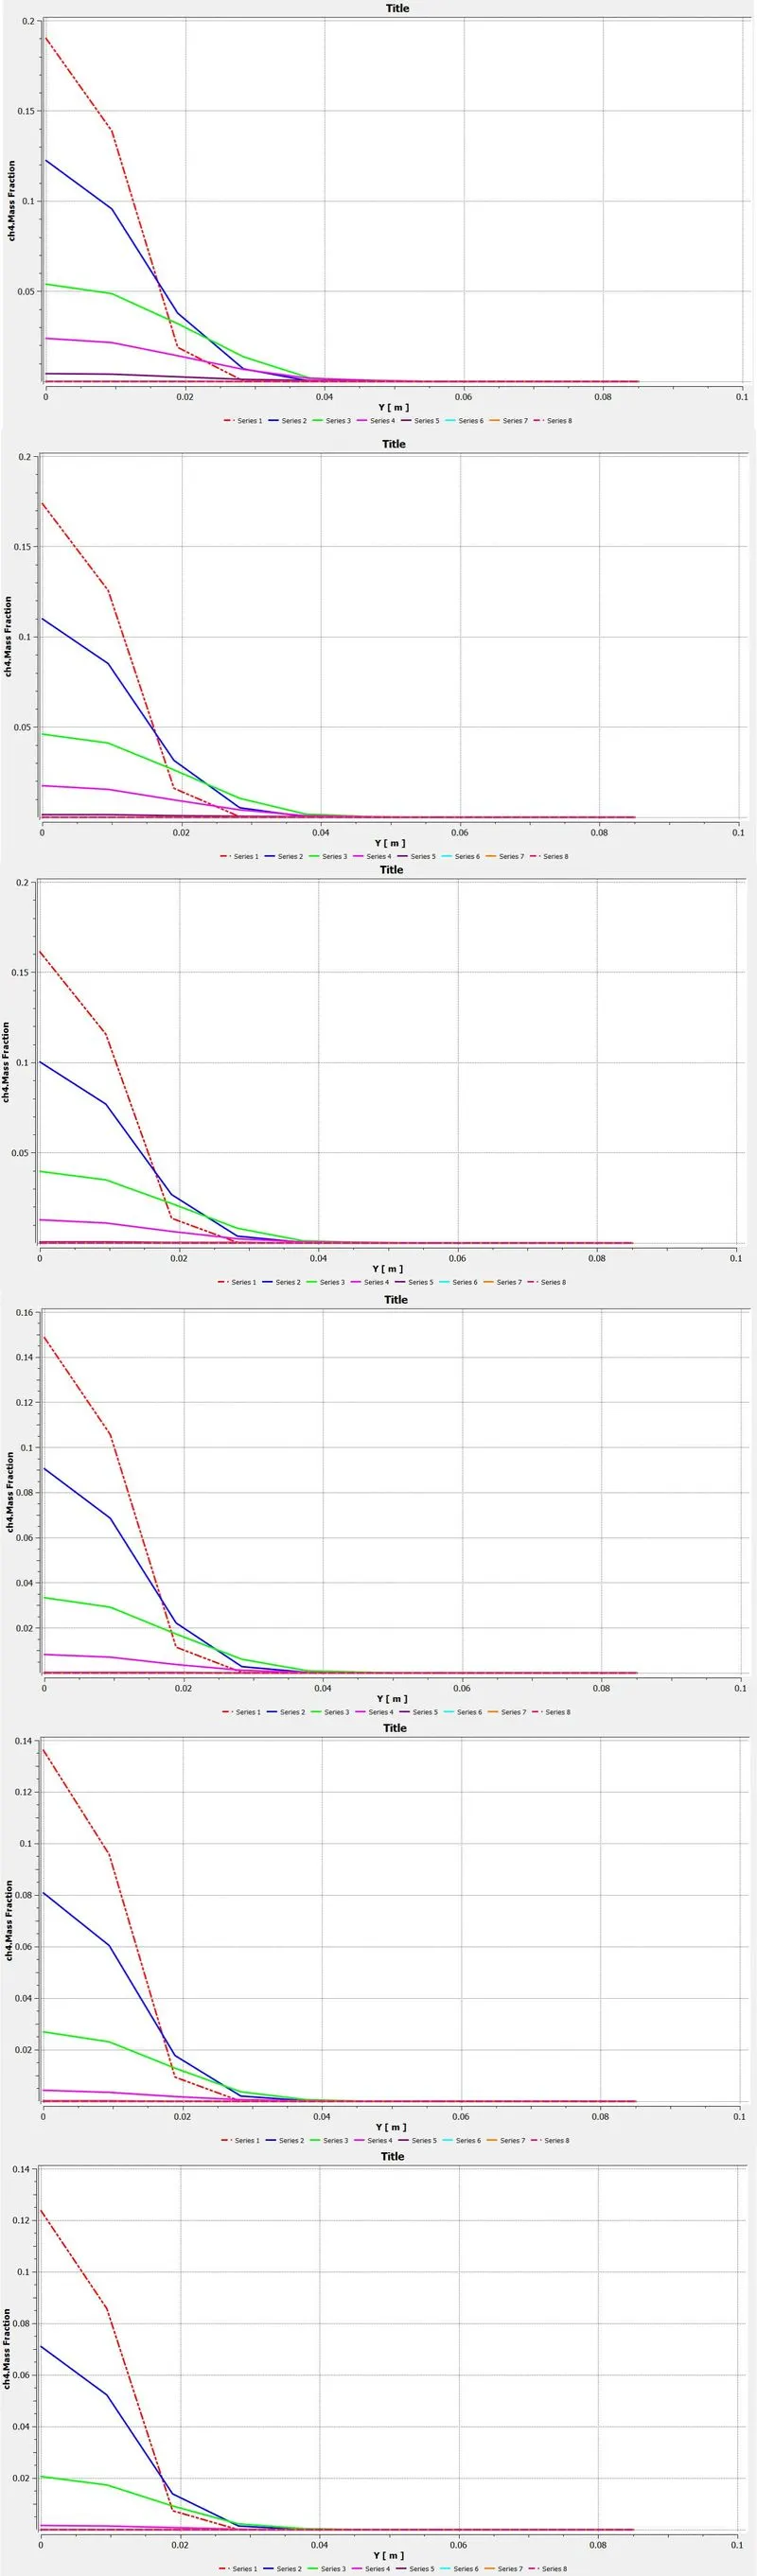
From the above plots, it is observed that due to addition of water content to the fuel, there is no significant change in the maximum temperature, CO2, H2O, CH4 mass concentartion.
CONCLUSION:
It is concluded that due to the addition of water content to the fuel from 5% to 30% , the concentration of NOX is reduced from 0.026 to 6e-5 and SOOT pollutant is reduced from 0.048 to 0.0089. The temperature distribution in the combustion chamber is not affected due to addition of water content.
REFERENCES -
[1] Chybowski, Leszek, Rafał Laskowski, and Katarzyna Gawdzińska. "An overview of systems supplying water into the combustion chamber of diesel engines to decrease the amount of nitrogen oxides in exhaust gas." Journal of Marine Science and Technology 20.3 (2015): 393-405.
[2] Mazzei, Lorenzo, et al. "Modelling soot production and thermal radiation for turbulent diffusion flames." Energy Procedia 126 (2017): 826-833.