Week 10: Project 1 - FULL HYDRO case set up (PFI)
Aim: Simulate full hydro simulation for a Port Fuel Injection engine using converge and post process results using paraview.
The geometry used in the simulation.
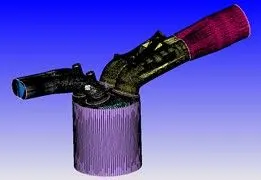
Setup-
Application Type
Crank angle-based IC engine
Physical Parameters:
Bore =0.086 m
Stroke = 0.09 m
Connecting rod length = 0.18 m
RPM = 3000
Materials
Gas Simulation- The therm.dat file was uploaded to import the thermodynamic properties of the fuel.
Reaction Mechanism – mech.dat file was imported for the simulation.
Parcel Simulation:
IC8H18 was selected from predefined liquid data.
Species: IC8H18 was selected from the parcel data.
Simulation Parameters
Run Parameters:
Transient, Crank angle based engine simulation, full hydrodynamic solver.
Simulation Time Parameters:
Start time : -480 deg
end time : 240 deg
initial time step/min time step: 1e-7/1e-8
max time step:0.0001
max convection/diffusion CFL limit: 1.0 / 2.0
Solver Parameters:
PISO Navier stokes solver scheme
Boundary Conditions:
Law of wall for velocity & temperature boundary conditions
- Piston-Velocity-piston motion, temperature - 450K
- Exhaust valve top – wall, translating, moving, temperature - 525K, Exhaust lift profile is imported
- Exhaust valve angle temperature - wall, translating, moving, temperature - 525K, Exhaust lift profile is imported
- Exhaust valve bottom - wall, translating, moving, temperature - 525K, Exhaust lift profile is imported
- Intake valve top - wall, translating, moving, temperature - 480K, intake lift profile is imported
- Intake valve angle - wall, translating, moving, temperature - 480K, intake lift profile is imported
- Intake valve bottom - wall, translating, moving, temperature - 480K, intake lift profile is imported
- Liner – wall, stationary, fixed, temperature - 450K
- Head - wall, stationary, fixed, temperature - 450K
- Spark Plug - wall, stationary, fixed, temperature - 550K
- Spark Plug terminal - wall, stationary, fixed, temperature - 600K
- Exhaust port - wall, stationary, fixed, temperature - 500K
- Intake port – 1 - wall, stationary, fixed, temperature 425K
- Intake port – 2 - wall, stationary, fixed, temperature 425K
- INFLOW - pressure - 1 bar total pressure, temperature - 363K, species - Air
- OUTFLOW- Pressure - 1 bar, temperature - 800k, species concentration – CO2(0.192304), H2O(.088559), N2(0.719137)
Initial conditions and Events
Regions and Initial conditions:
- Intake port - 1
IC8H18 - 0.025508
O2 - 0.20157
N2 - 0.77292
Temperature - 390k
pressure – 101325pa
- Intake port - 2
Air
Temperature - 370K
Pressure – 101325pa
- Cylinder region
Pressure – 101325k
Temperature - 300K
Species - CO2(0.192304), H2O(.088559), N2(0.719137)
- Exhaust region
Temperature – 1360K
Pressure – 185731pa
Species - CO2(0.192304), H2O(.088559), N2(0.719137)
Events:
Cyclic
Cylinder region – intake port 1 – Valve
Cylinder region – exhaust region – Valve
Permanent
Intake port 1 – Intake port 2 - open
Physical Models
Spray Modeling:
Turbulent Dispersion: O’rourke model, Wall Interaction>Spray-wall interaction-Film Splash model – O’Rourke Model
Injectors Addition, parcel species – IC8H18, rate shape profile given
Cycle injection temporal type
Start Of injection - -480 deg
Injection Duration – 191.2 deg
Total Injected Mass – 3e-05 kg
Temperature - 330K
Nozzles-
Nozzle diameter – 0.00025m
Circular Injection Radius - 0.000125m
Location and orientation provided
Total no of nozzles – 4
Combustion Modeling:
Fuel Species Name: IC8H18
Temporal type: Cyclic
Start time: -17 deg
End: 130 deg
SAGE detailed chemistry solver
Turbulence Modeling:
RANS k-epsilon RNG model
Source/Sink Modeling:
Source Addition
Mode: cyclic
Start time: -15.0 deg
End time: -14.5 deg
Period: 720’
Shape: Sphere
Sphere radius: 0.0005m
Two sources added
Second source:
Start time: -15.0 deg
End time: -5.0 deg
Grid Control
Base Grid:
dx=dy=dz=0.004m
Adaptive Mesh Refinement:
Active regions
Intake Port-1
Intake Port-2
Cylinder region
Max cells - 2000000
Velocity-
Embed type: Sub grid scale
Max embedding level: 3.0
Sub-grid criterion: 1.0
Time control: Permanent
Temperature-
Embed type: Sub grid scale
Max embedding level: 3.0
Sub-grid criterion: 2.5
Time Control: Cyclic
Start: -17.0 deg
End:135.0 deg
Cycle Period: 720 deg
Fixed Embedding:
Spherical Embedding
Entity: sphere
Mode: cyclic
Period: 720 deg
Scale: 5
Start: -16 deg
End: 7 deg
Radius: 0.001
Large sphere
Entity: Sphere
Mode: cyclic
Period: 720 deg
Scale: 3
Start: -16 deg
End: 7 deg
Radius: 0.003
Injector
Mode: cyclic
Period: 720 deg
Scale: 4
Entity: Injector
Start: -482 deg
End: -286 deg
Radius 1: 0.002
Radius 2: 0.004
Length: 0.02
Mesh
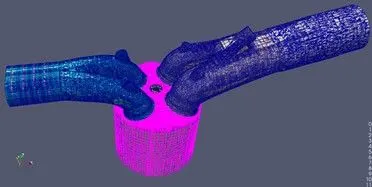
Question Answers
What is the compression ratio of this engine?
The ratio of the maximum volume when piston is at bdc and the volume available when piston reaches tdc.
- Calculate the combustion efficiency of this engine.
The combustion efficiency can be defined as the ratio of total energy released during combustion to the amount of energy contained in the fuel. The energy present in the fuel is called total heating value, calorific value.
Mass of Fuel=3e-5 kg/cycle
Lower heating value of isoctane=43.44 MI/kg=43.44*3e-5=1303.2 J
Energy released= 1241.15 J
Combustion efficiency=energy released/LCV=1241.15/1303.2=0.952
Combustion efficiency=95.2 %
- Use the engine performance calculator, to determine the power and torque for this engine.
Speed =3000 rpm=3000/60 rps
= 50 revolution/sec
=360*50 degree/sec
Combustion time= 240.199 degree
Combustion time in seconds=240.199/(360*50)=0.0133 s
Now,
Work=468.646 N.m
Power=work/time
Power=468.646/0.0133
Power = 2*Pi*NT/60
T=Power * 60/2*Pi*N
T=112.2 Nm
- What is the significance of ca10, ca50 and ca90?
Ca10, ca 50, ca90 refers to the crank angles at which 10%, 50% and 90% of fuel is burnt.
Graphs
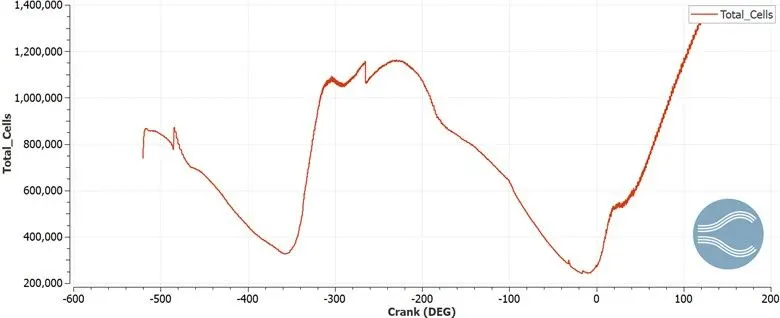
The total no of cells are shown in the graph above. It varies from 800000 to 1300000 cells as the piston moves from TDC to BDC through the crank angle degrees. As the piston moves from bdc to tdc and as combustion occurs and injection occurs through power stroke. The cell size increase to compensate for adaptive mesh refinement and fixed embedding.
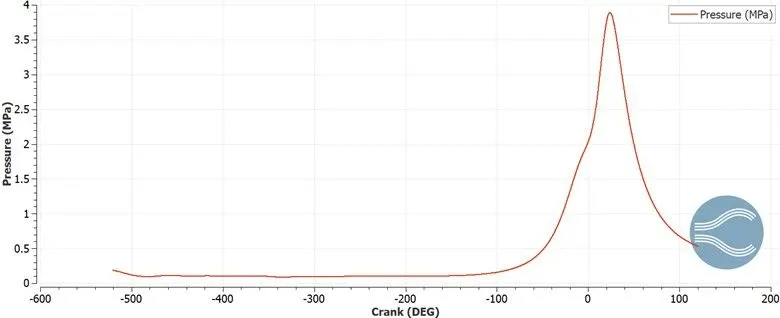
The pressure graph shows pressure variation across the crank angles. It can be seen it reaches 4MPa pressure values during the combustion and injection. As the suction and compression stroke occurs, the pressure remains low and it increases gradually to 4MPa during the power stroke and as the exhaust stroke commences the pressure decreases.
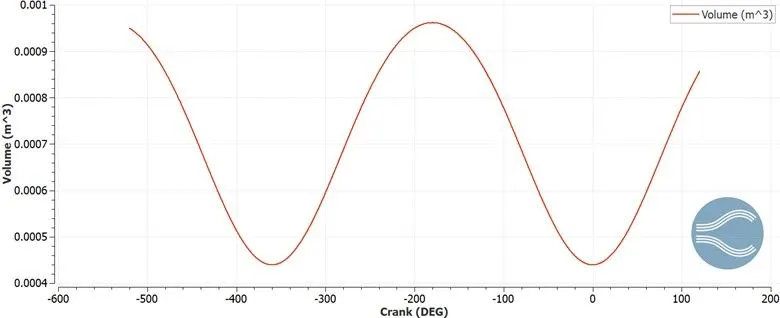
The volume graph shows variation of volume continuously through the crank angle degree or the piston movement in the chamber. It varies from 0.00044m3 to 0.00096 m3. As the piston moves from bdc to tdc, the volume keeps varying. The graph is similar to sine curve, during the piston movement, the volume keeps increasing and decreasing and thus the curve shows such behaviour.
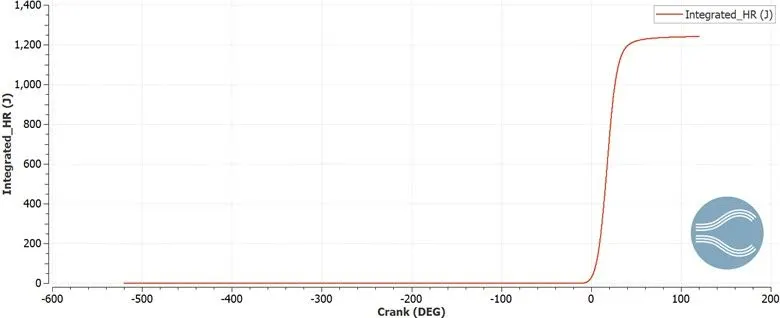
The Integrated heat release graph shows the heat release in Joules. The graph shows 1250 joules peak heat release values through the crank degree as the reactions are happening. These reactions happen during the combustion, during the power stroke. As the through suction and compression, there are no reactions, no combustion, the heat release remains zero, while as the combustion occurs and injection occus, the energy is released and heat is released. The curve shows this scenario and as the combustion happens, there is increase in heat release and reaches a peak value.
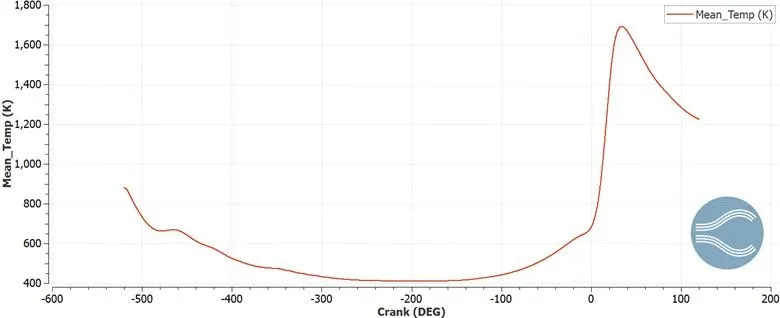
The mean temperature graph shows variation of temperature through the crank angle degree as the piston moves from TDC to BDC and vice versa. The max value is reached about 1700K and it is reached during the combustion at the power stroke as the injection happens and fuel combusts. The mean temperature remains low during suction and compression, while as the pressure, temperature increases during the power stroke(combustion), the peak mean temperature is reached and the value decreases as the exhaust stroke is reached.
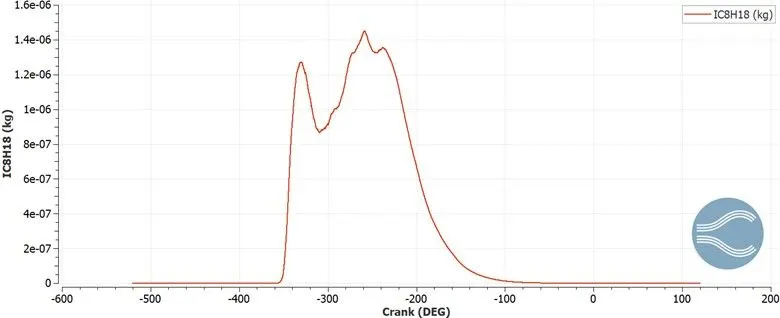
The graph above shows the amount of IC8H18 produced with respect to the crank angle degrees. It can be seen the amount remains low before and after injection points. While at the injection point around -450, the amount of IC8H18 starts increasing and reaches a peak value of 1.4e-06kg. As the combustion occurs, fuel vapors are combusted and heat is released. This causes the amount of IC8H18 to decrease.
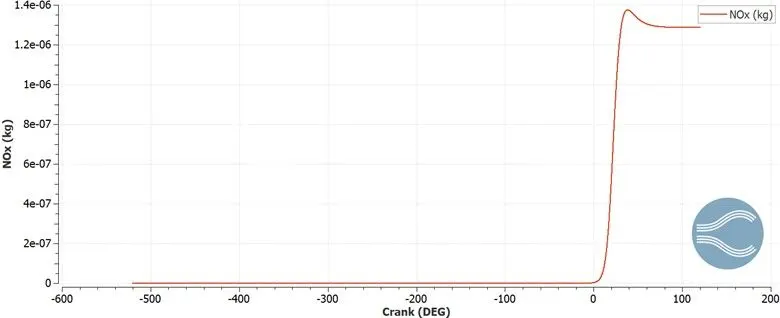
The graph shows the NOx content present with respect to the crank angle degree. It can be seen the NOx increases during the combustion, during the power stroke. As the suction and compression stroke occurs, the NOx content remains low and it increases as the combustion occurs. As the power stroke occurs, the NOx content starts increasing and reaches peak value of 1.4e-06 kg and starts decreasing after this stroke. The NOx is temperature dependent and shows a behavior similar to temperature curve.
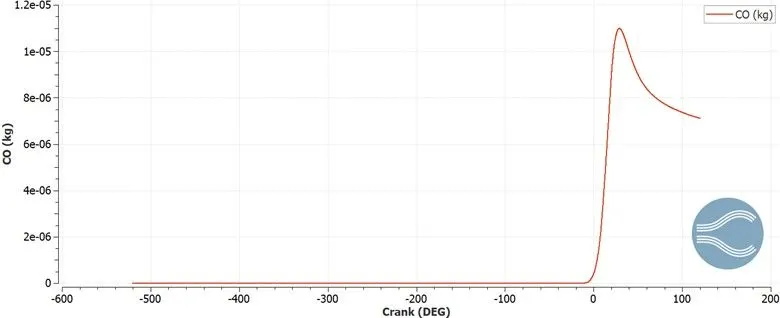
The CO shows a similar pattern as the NOx curve. It can be seen the CO increases during the combustion, during the power stroke. As the suction and compression stroke occurs, the CO content remains low and it increases as the combustion occurs. As the power stroke occurs, the CO content starts increasing and reaches peak value of 1.1e-06 kg and starts decreasing after this stroke. The CO is also temperature dependent and thus shows a pattern similar to temperature curve.
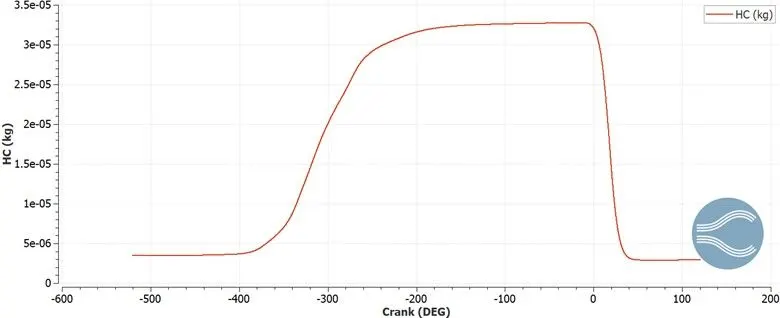
It can be seen the HCs increases during the injection points, during the compression stroke and power storke. As the suction and compression stroke occurs, the HCs content remains low and it increases as the injection occurs. The peak value remains constant at 3.3e-05kg for some crank degrees. As the fuel is combusted, the HC content starts decreasing and becomes low after the power stroke.
Conclusion:
The Full hydro setup for a PFI engine was simulated using converge.
This full hydro setup was to check and simulate the setup with combustion and spray modeling. The pressure, temperature, Volume and heat release graphs were monitored as well as the emission and mesh cells were observed with respect to crank angle degrees.
It was seen the power stroke, during which the combustion occurs, injection occurs affects a number of parameters such as pressure, temperature, heat release as well as emission formation and remains a phenomena of importance.
The setup was run successfully without any errors.
Youtube Animation Link: