Week 10: Modeling and Simulation of flow around an Ahmed Body
AIM:
To conduct a simulation of the flow around an Ahmed Body using Converge CFD software and compare the results with experimental data. The simulation aims to determine the aerodynamic forces acting on the body, specifically the drag and lift coefficients.4
By setting up and running the simulation, we hope to gain insight into the behavior of the fluid dynamics around the Ahmed Body, and evaluate the accuracy of the computational model by comparing its results with the experimental data.
THEORY:
Ahmed Body
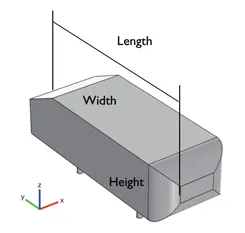
The Ahmed Body is a model vehicle body that has been designed to investigate the aerodynamic properties of bluff bodies. Specifically, it has been used to study the impact of the slant angle at the back of the body on the resulting flow field and aerodynamic forces. One key feature of the Ahmed Body is that it minimizes the interactions between the front and rear sections of the body, allowing for more focused analysis of the rear section. This makes it a useful tool for studying the aerodynamics of vehicles and other bluff bodies.
GEOMETRY
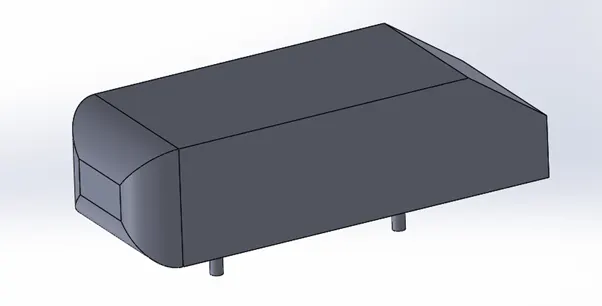
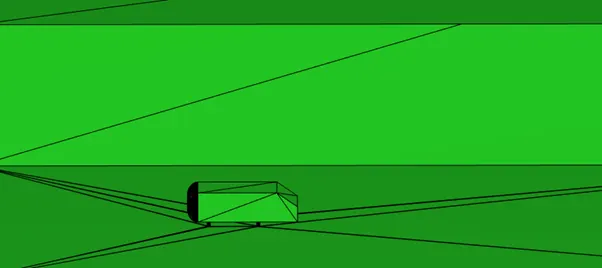
The below Ahmed Geometry was created using CATIA.
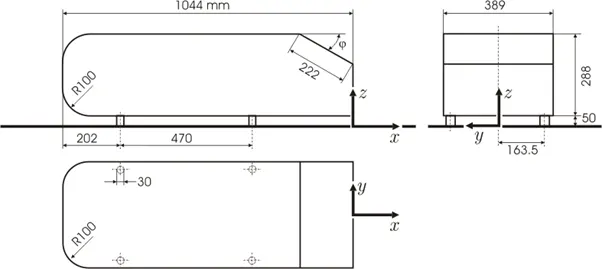
Slant angle used is 35°
PROCEDURE:
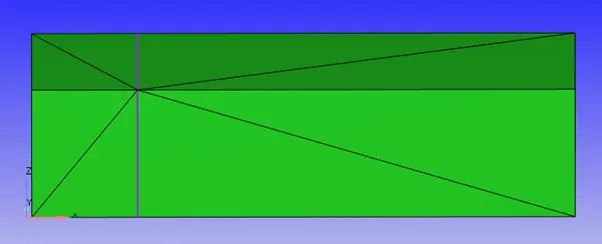
A virtual wind tunnel is created as per the below measurements:
- Let 'L' be the length of Ahmed body,
- Hence, Height of the wind tunnel: 2*L
- Width: 2*L
- Length: 10*L
Calculation
We have,
Boundary layer thickness = 30mm at 400mm in front of Ahmed body,
Inlet velocity: 40m/s
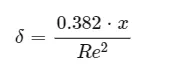
Boundary layer thickness in mm (δ) = 30mm
X: Length of the plate in m
Re: Reynolds number
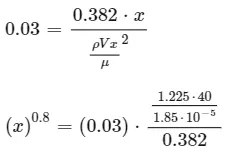
Thus, X=1.67m
It has been determined that, with the Ahmed Body positioned 1.67 meters from the front, there will be a boundary layer of approximately 30mm in thickness. This means that the actual no-slip region in front of the body should be :
1.67 meters + 0.4 meters = 2.07 meters
As a result, the slip region has been defined as 2 meters for the purposes of this analysis.
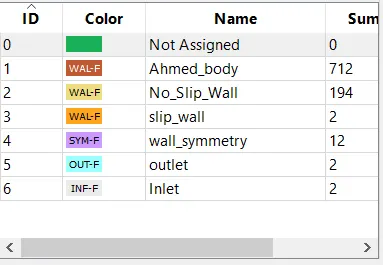
Boundary Naming
CASE SETUP
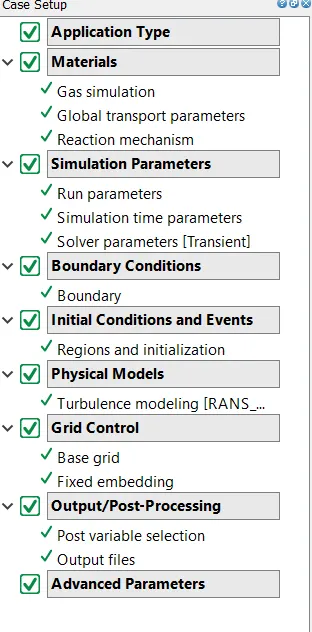
1.Application type: Time based
2. Materials: Air
3. Run parameters:
- Solver: Transient
- Simulation mode: Full hydrodynamic
- Gas flow solver: Compressible
4.Simulation time parameters:
Start time: 0s
End time: 1s
Initial time-step: 0.0001
Minimum time-step: 0.0001
Maximum time-step: 1s
Maximum convection CFL limit: 1
5. Solver parameters:
Navier-Stokes solver scheme= PISO
Navier-Stokes solver type= Density-based
6. Regions and initialization:
Velocity(x, y, z): (40, 0, 0)m/s
Temperature: 300K
Pressure: 101325Pa
Species: Air
7. Boundary:
7.1 Outlet
Outflow boundary condition
- Pressure= 101325Pa
- Velocity= Zero normal gradient (Neumann BC)
- Species backflow= air
- Temperature backflow= 300K
7.2 Inlet
Inflow Boundary Condition:
- Velocity(x, y, z)= (40, 0, 0)m/s
- Pressure= Zero normal gradient(Neumann BC)
- Temperature= 300K
- Species= air
7.3 Wall & Boundary:
- Symmetry boundary condition
- No slip wall: Stationary wall boundary condition(law of wall)
- Slip_wall: Stationary wall boundary condition (slip wall)
In order to achieve a boundary layer thickness of 30mm at a distance of 400mm in front of the Ahmed Body, the slip wall boundary condition has been applied. This boundary condition is chosen because it does not introduce any boundary layer effects that could interfere with the analysis. To determine the appropriate length for the plate, calculations have been performed and the excess length has been defined as the slip wall boundary condition. By using this approach, we can accurately simulate the flow around the Ahmed Body and obtain meaningful results for the aerodynamic forces acting on the body.
7.4 Ahmed body: Stationary wall boundary condition(law of wall)
8. Turbulence Modeling: K-omega SST
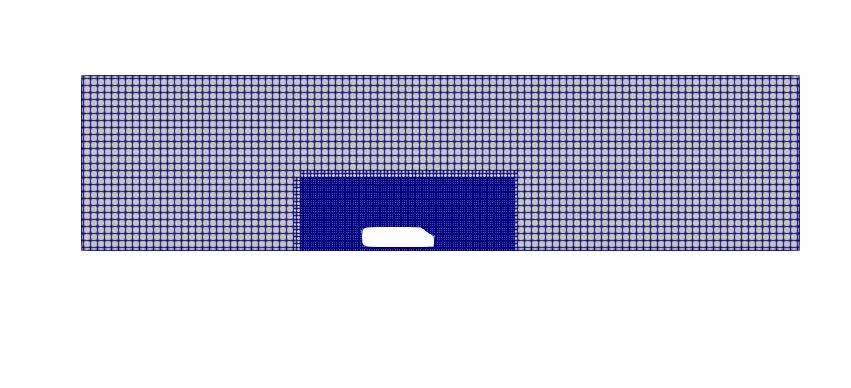
9. Grid control:
- Base grid size(x, y, z): (0.1 0.1, 0.1)m
- Fixed embedding
9.1 Embedding 1:
- Entity: Box enclosing the Ahmed body
- Dimensions(x, y, z): (3, 0.6, 1)m
- Permanent Mode
- Scale: 2
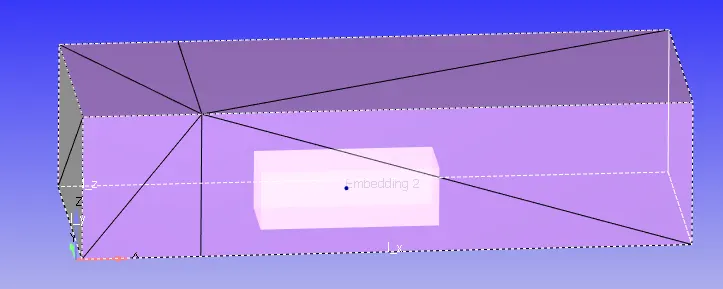
9.2 Embedding 2
- Entity: Boundary
- Boundary ID= Ahmed body
- Permanent Mode
- Scale: 3
- Embed layers: 5
10.Output files:
Wall output: Only Boundaries
Time interval for writing 3D output data files: 0.01s
Time interval for writing text output: 0.001
Time interval for writing restarting output: 0.01s
For this study, the simulation was conducted using CYGWIN software, and the resulting data was post-processed using PARAVIEW. By using these tools, we were able to analyze the flow around the Ahmed Body and obtain detailed information about the resulting aerodynamic forces.
RESULT:
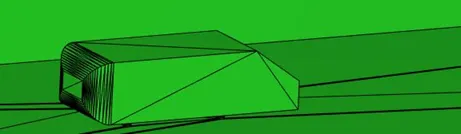
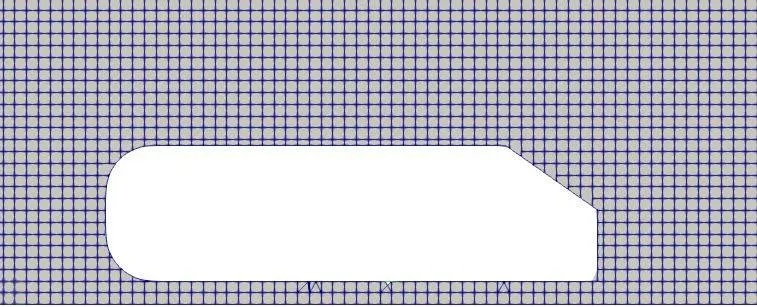
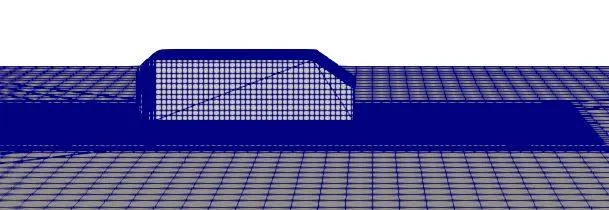
1. Meshing
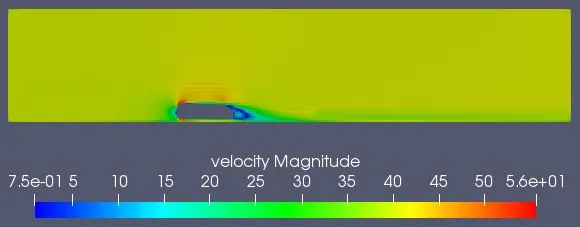
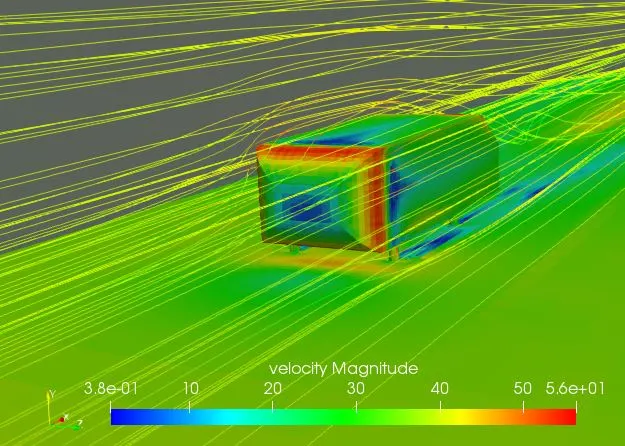
2. Velocity Contour
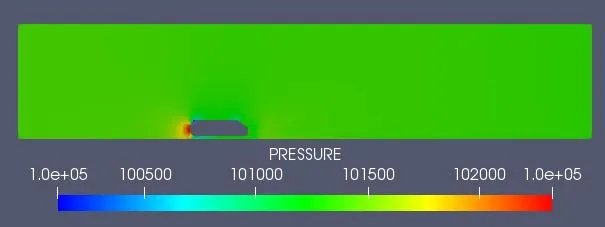
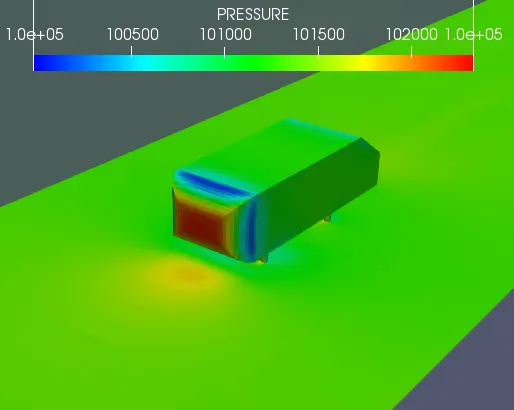
3. Pressure Contour
4. Converge Plots
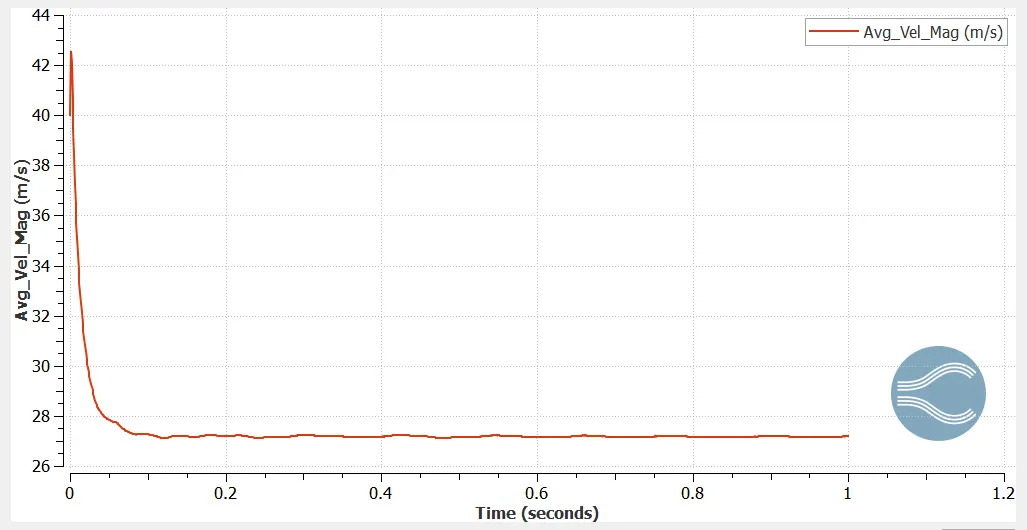
- Plot 1: Velocity plot
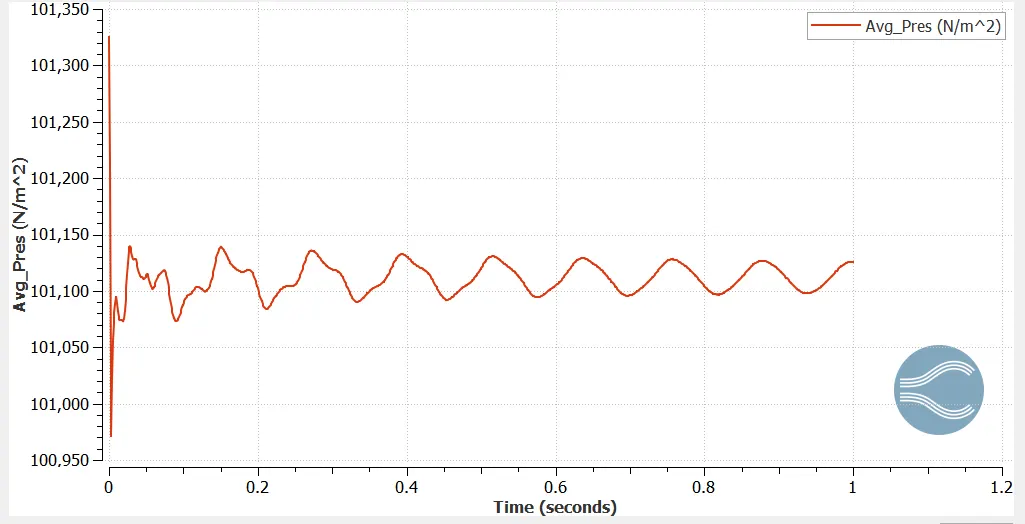
- Plot 2: Pressure plot
- Calculation of Drag & its Coefficient and Lift & its Coefficient Lift.
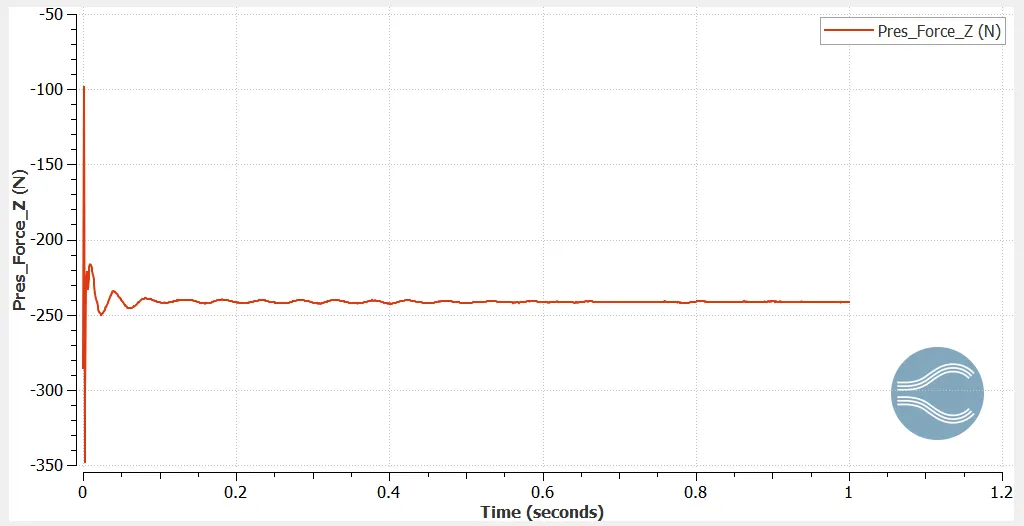
Along Z-axis, Pressure force is considered as Lift force
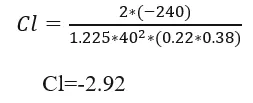
From the above graph L: -240N
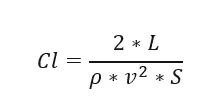
Coefficient of lift:
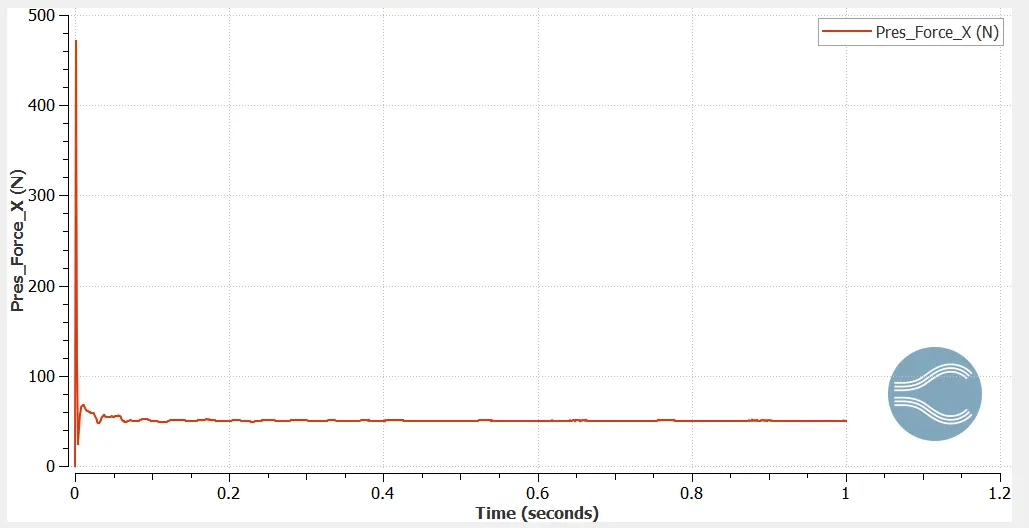
Along Z-axis Pressure force isconsidered as Drag force
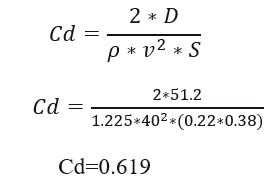
From above graph D: 51.2N
Velocity in X-axis along with different Z location:
Experimental data has been obtained for the Ahmed Body under specific conditions, and the results of our simulation will be compared to this data to evaluate the accuracy of our computational model. By comparing the simulation results to the experimental data, we can determine the effectiveness of our approach and identify areas where improvements can be made. This comparison will be an important step in validating our simulation and ensuring that our results are reliable and accurate.
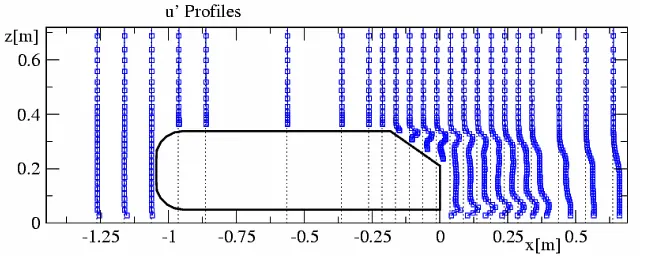
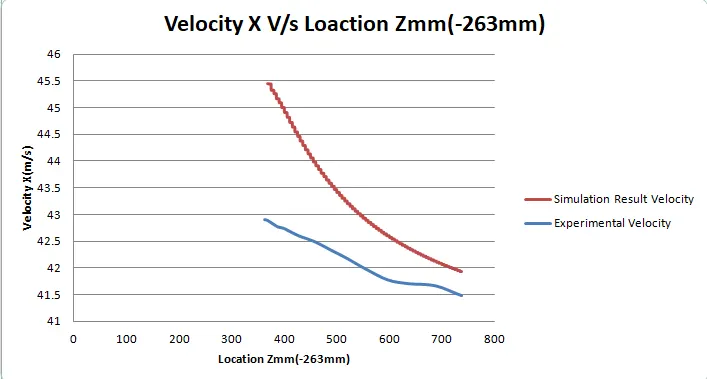
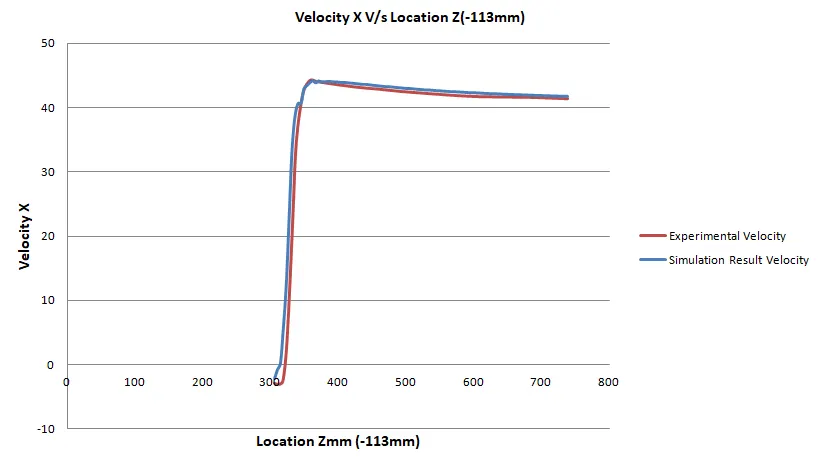
Due to its proximity to the top surface of the Ahmed Body, the probe experiences a higher velocity than it would if it were located elsewhere. However, the velocity at the top surface is still less than that at the front surface, which results in a reduction in the kinetic energy of the wind. This creates a high-pressure layer on the top surface that has a high velocity, but as the probe is moved up along the z-axis, this velocity and the resulting air disturbance are gradually reduced. This phenomenon is an important consideration when analyzing the flow around the Ahmed Body, as it can have a significant impact on the resulting aerodynamic forces.
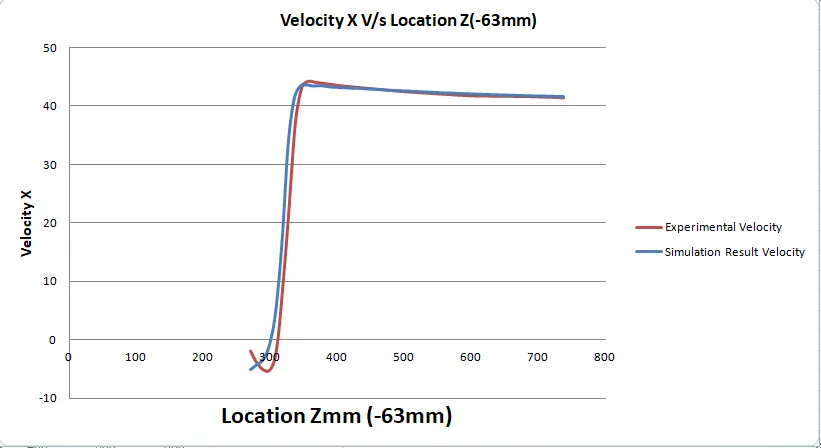
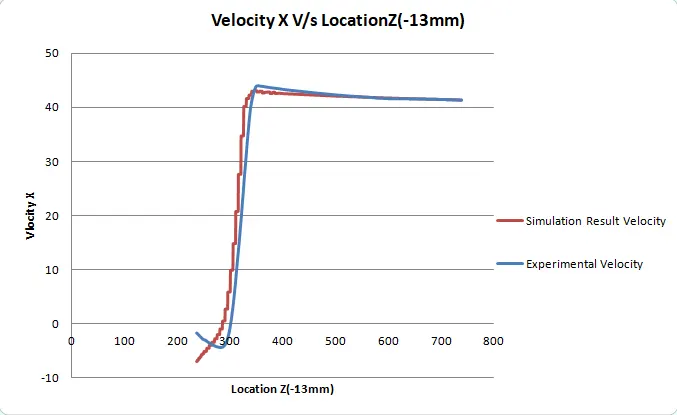
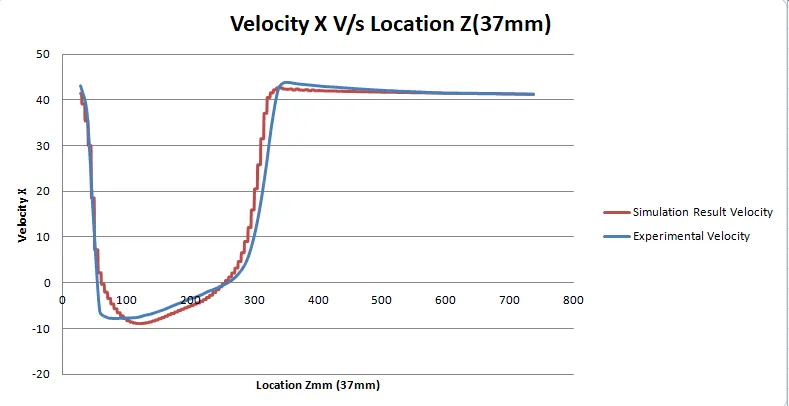
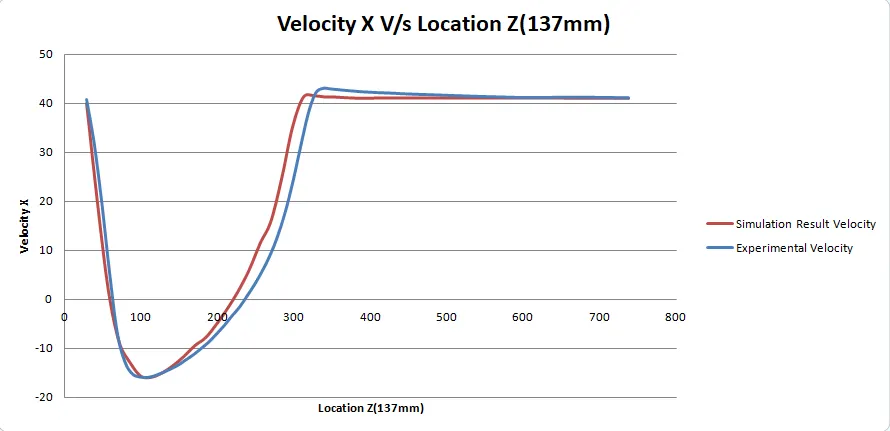
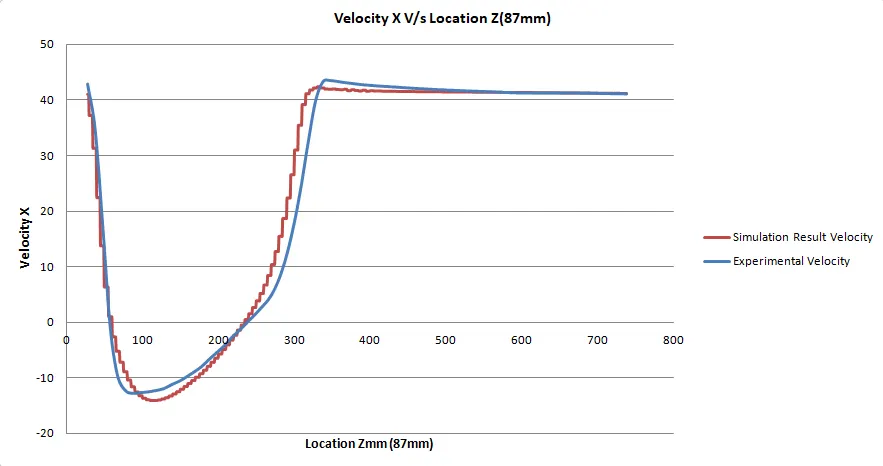
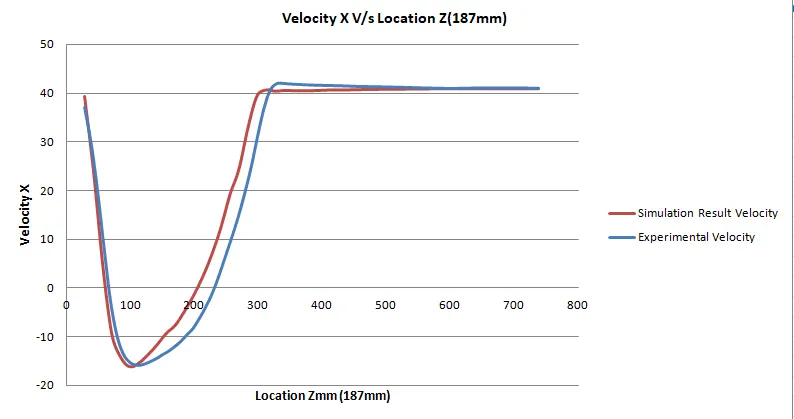
The final four plots in our analysis represent the region immediately behind the Ahmed Body, where a recirculation zone is formed. This zone is characterized by low pressure and low velocity, and can have a significant impact on the aerodynamic forces acting on the body. As the probe moves closer to the Ahmed Body from below, it experiences a high velocity, but as it approaches the recirculation zone, the velocity decreases due to the low pressure. Once the wake region ends, the velocity returns to normal levels. This behavior is important to consider when analyzing the flow around the Ahmed Body, as it can have a significant impact on the resulting aerodynamic forces.
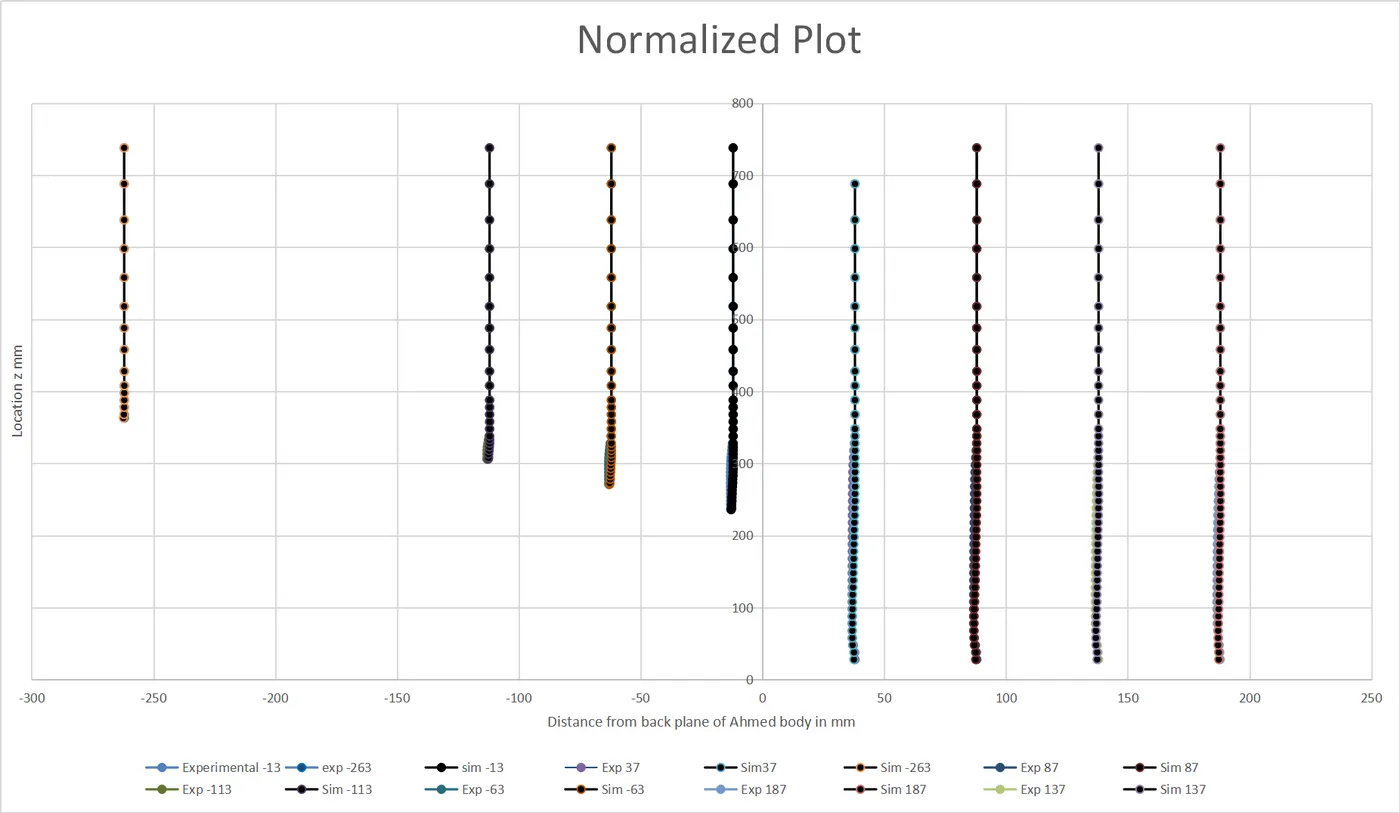
5. Normalized Plot
CONCLUSION
- To facilitate the comparison of our results, the velocity magnitude has been normalized. This allows for the easy comparison of multiple line plots on a single graph, making it easier to identify trends and patterns in the data.
- As the air moves past the Ahmed Body, a recirculation zone is formed behind it due to a drop in static pressure. This is an important consideration when analyzing the flow around the body, as it can have a significant impact on the resulting aerodynamic forces.
- To capture the viscous region near the Ahmed Body, the surface below it was kept as a Noslip wall. This approach was effective in identifying a recirculation zone just behind the Ahmed Body, where the velocity and pressure drop off sharply.
- Based on our simulations, we calculated the lift and drag coefficients for the Ahmed Body to be
- Cl: -2.92
- Cd=0.619, respectively.
- These values provide important insights into the aerodynamic performance of the body, and can be used to guide the design of future vehicles