Week 10: Modeling and Simulation of flow around an Ahmed Body
Aim
The major objective of this simulation was to set a simulation over an Ahmed body using Converge CFD and estimate and compare data with experimental data and post process results using paraview.
The geometry used in the simulation.
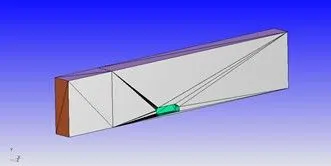
Setup-
Application Type
Time-based
Materials
Species: O2 and N2 were selected from the gas data.
Simulation Parameters:
Run Parameters:
Transient, Time based simulation, full hydrodynamic solver, compressible.
Simulation Time Parameters:
Start time : 0.0 s
end time : 1 s
initial time step/min time step: 1e-7/1e-8
max time step:1.0
max convection/diffusion CFL limit: 1.0 / 2.0
Solver Parameters:
PISO Navier stokes solver scheme
Boundary Conditions:
• Aerofoil Wall - wall, stationary, fixed, law of wall, temperature – zero normal gradient
• Back Symmetry – Symmetry
• Top Symmetry – Symmetry
• mid symmetry – Symmetry
• Bottom_law of wall - wall, stationary, fixed, law of wall, temperature – zero normal gradient
• Ahmed_Body_legs - wall, stationary, fixed, law of wall, temperature – zero normal gradient
• Ahmed_Body - wall, stationary, fixed, law of wall, temperature – zero normal gradient
• free_Slip_bottom - wall, stationary, fixed, slip, temperature – zero normal gradient
• INFLOW - pressure – zero normal gradient, temperature – 300K, velocity 40 m/s (x-dir),species – O2,N2
• OUTFLOW- Pressure – 101325Pa, velocity- zero normal gradient, temperature - 300k, species concentration – O2, N2
Initial conditions and Events
Regions and Initial conditions:
• Region 0
Velocity – 40 m/s (X-dir)
Pressure – 101325Pa
O2 - 0.23
N2 - 0.77
Temperature – 300k
Physical Models
Turbulence Modeling:
RANS k-epsilon RNG model
Grid Control
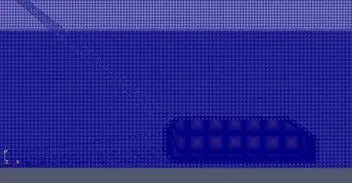
Base Grid:
dx=dy=dz=0.02m
Fixed Embedding:
Embedding 1
Entity: box
Mode: permanent
Scale: 2
Center of box and half length in each direction given
Embedding 2
Entity: Boundary
Boundary ID: Ahmed_Body
Mode: Permanent
Scale: 3
Embed Layers: 10
Mesh
Graphs
Total Cells
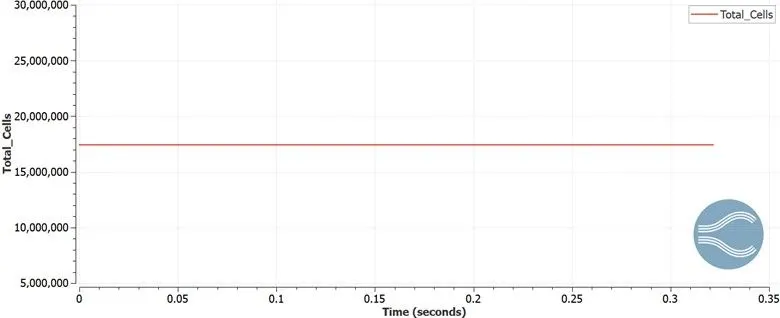
The graph shows the total no of cells present in the geometry. The total no of cells are 17,500,000.
Drag Force
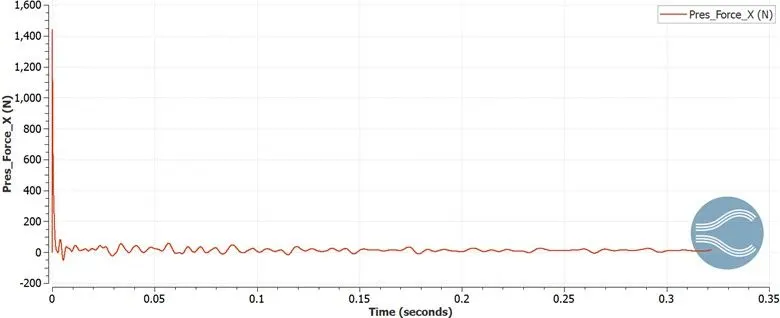
The Pressure force in the x direction or drag force is shown with respect to simulation time. It can be seen the drag force is about 38N at the end of the simulation and it varies through out the time, the simulation is being done.
Lift Force
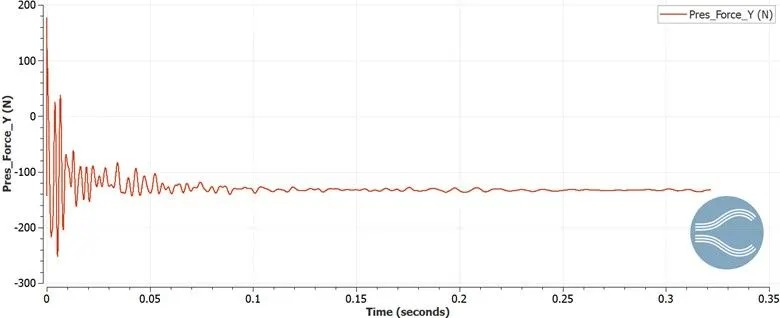
The Pressure force in the y direction or lift force is shown with respect to simulation time. It can be seen the lift force reaches a -135N at the end of simulation. It can be seen the values varies throughout the simulation with high initial changes and relatively less later.
Y plus
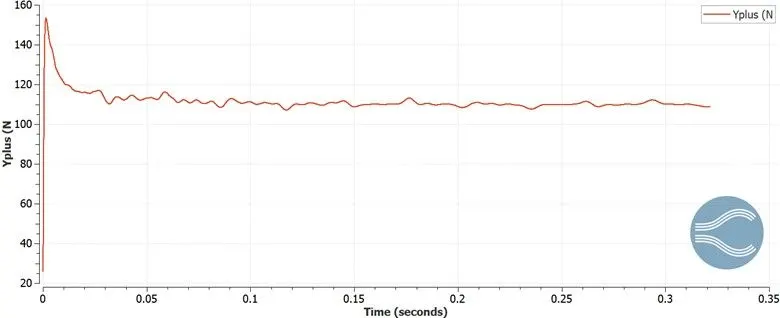
The Y plus is shown with respect to simulation time. It can be seen the Y plus varies throughout the simulation time. It reaches a value of 110 at the end of simulation. It reaches a higher value of over 150 initially and becomes less later.
Drag and Lift Coefficient:
A = 0.5289m2
ρ=1.225kg/m^3
V=40m/s
Drag Coefficient:
Cd=2 Fd/(ρ*V^2*A) = 2*38/(1.225*40^2*0.5289)
= 76/(1.225*40^2*0.5289)
=76/1036.644
=0.0733
Lift Coefficient:
Cl=2 Fl/(ρ*V^2*A) = 2*-135/(1.225*40^2*0.5289)
=-270/(1036.644)
=-0.2604
Velocity Contour
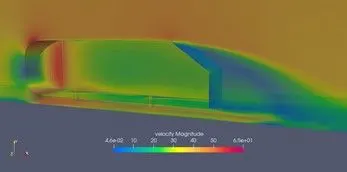
The velocity contour is shown in the figure above. It can be seen there is low velocity in the back of geometry while higher velocity on top and front regions.
Pressure Contour
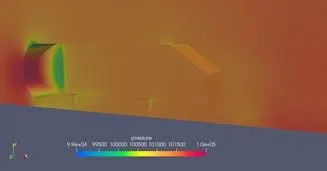
The pressure contour is shown in the figure above. The pressure value remains on high side on all regions, while the pressure is highest at the front and relatively less at top and back.
Turbulent Kinetic Energy
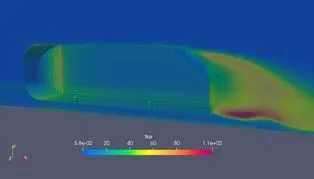
The Turbulent kinetic energy contour is shown in the figure above. It can be seen tke remains low throughout the body and it is high at back of body. It is low in top and front.
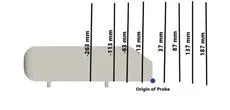
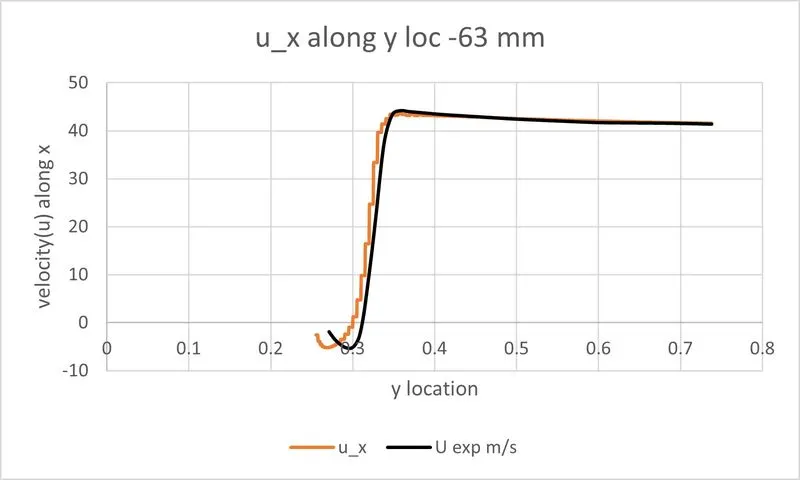
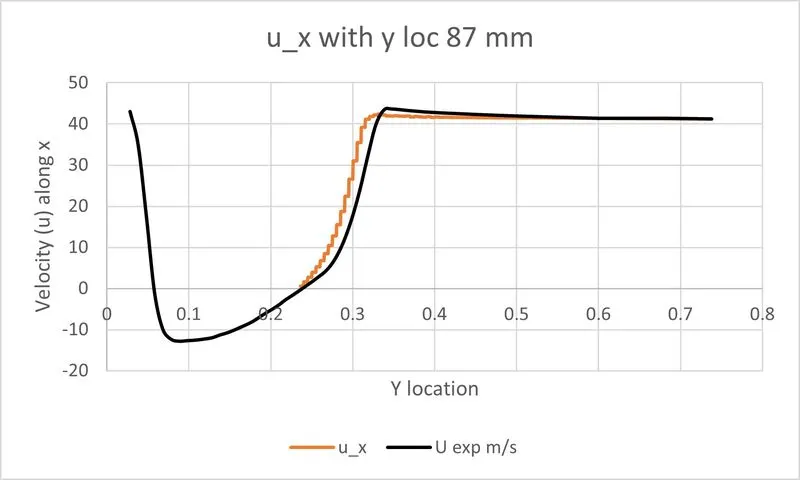
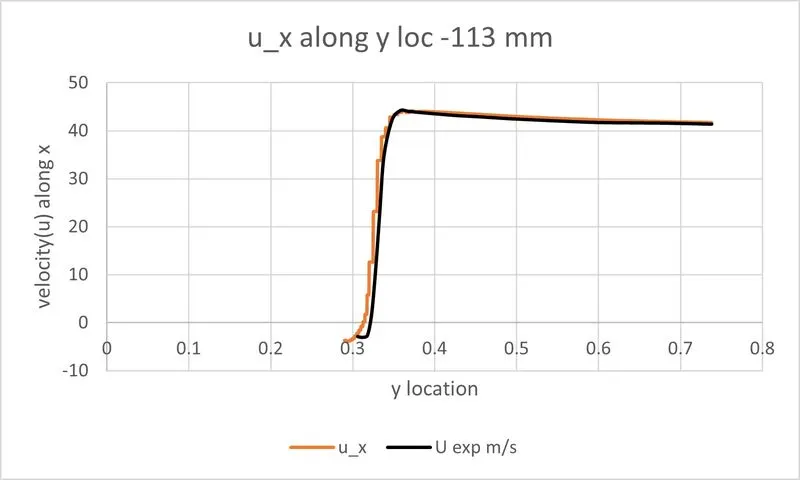
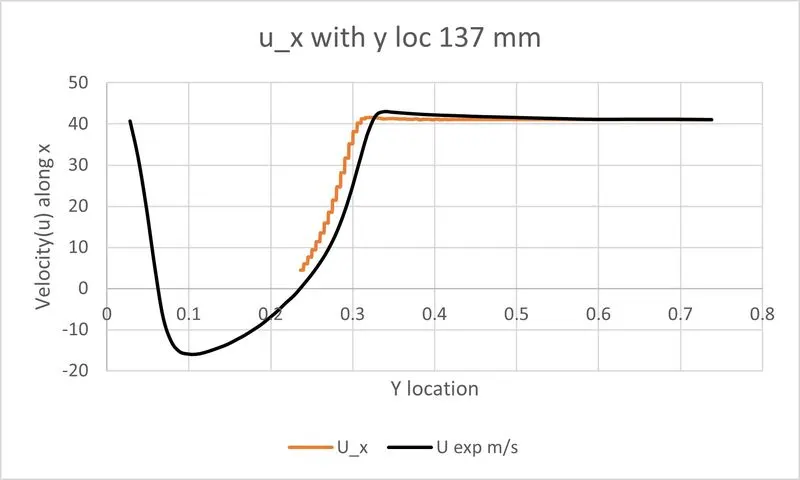
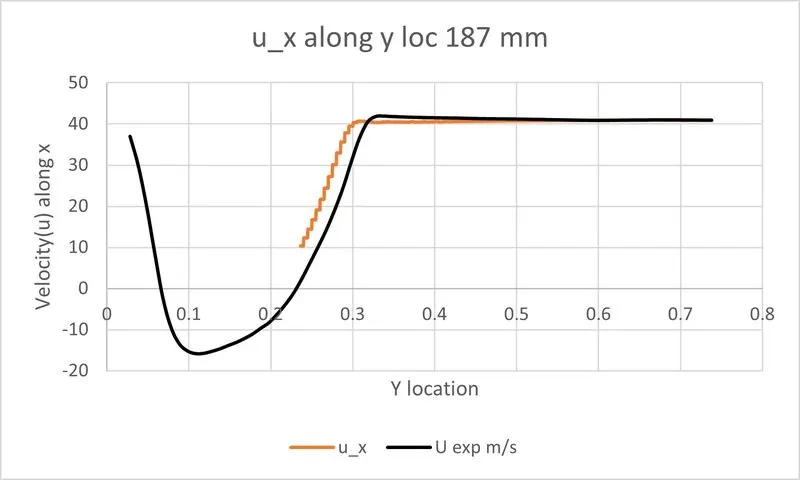
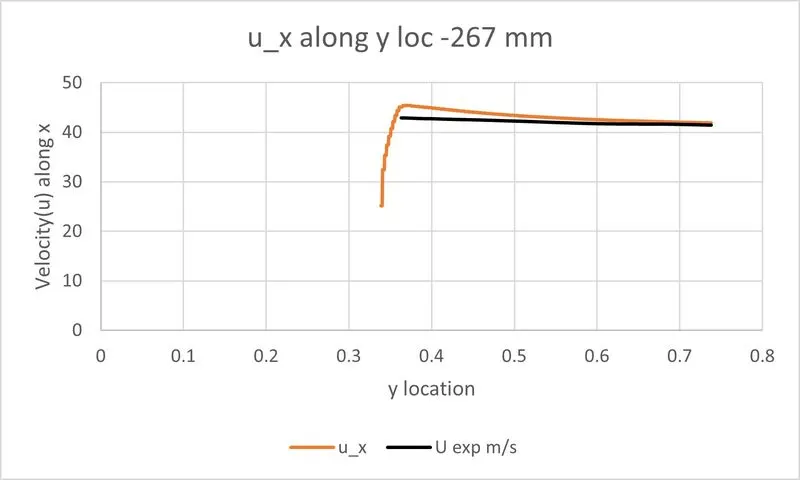
The velocity probe x locations are shown with the body for different y locations.
The graphs below show the comparison of experimental and simulation data of velocity along x for different y locations.
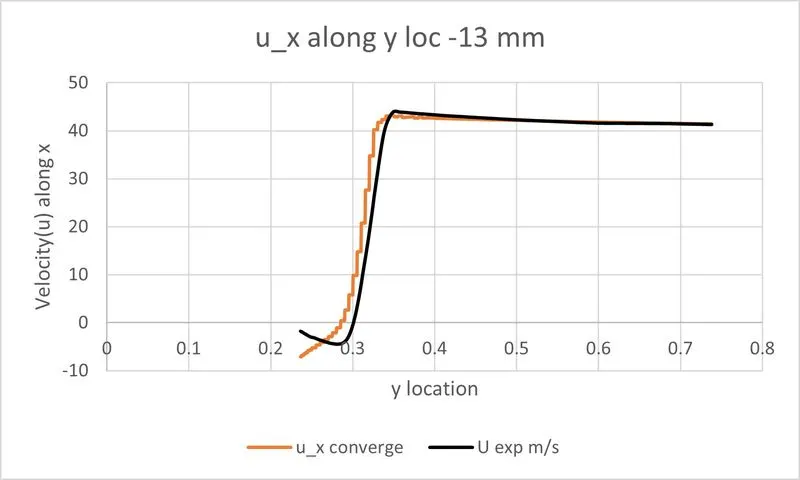
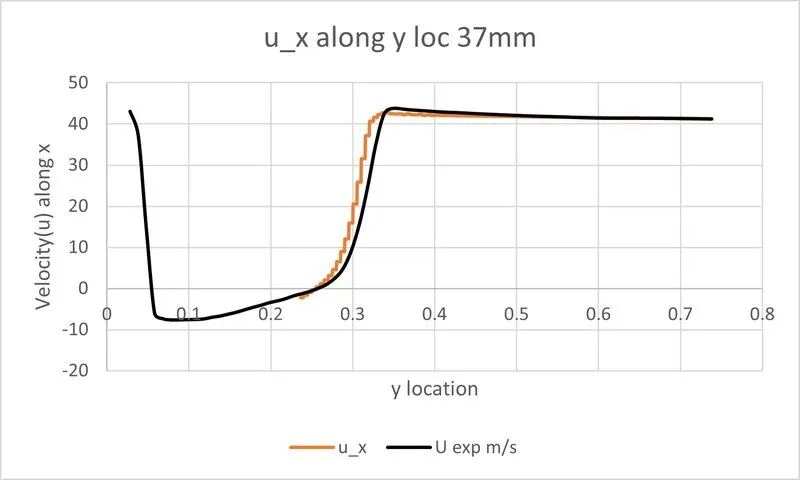
Conclusion:
The Ahmed body was simulated using Converge CFD and velocity along x for different y location were estimated and compared data with experimental data.
The pressure, velocity and tke contours were discussed.
The drag and lift forces and their coefficients were discussed.