Week - 10 Hyperelastic Material Models
AIM :
Material modelling of Hyperelastic rubber (MAT_077_H) and Ogden rubber (MAT_077_O) card from raw data and fit the experimental values to the raw data by the curve.
OBJECTIVE :
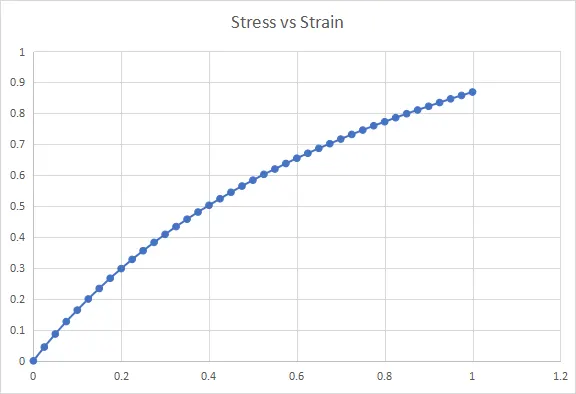
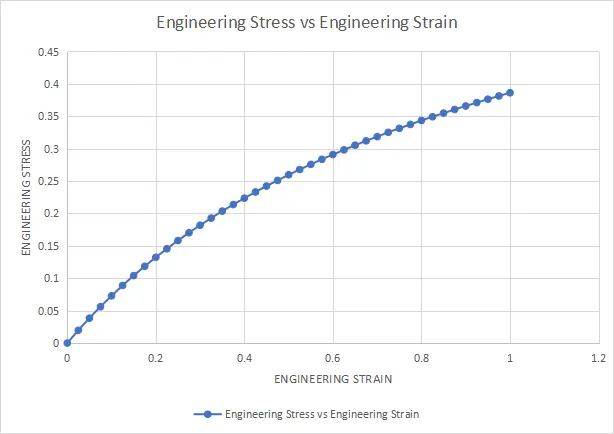
1. Extract the Engineering stress-strain curve from the given image.
2. Convert the data into mg-mm-ms units.
3. Plot the data as a curve to define in the material card.
4. Setup the simulation for the tensile test on the dogbone specimen to get the results.
5. Validate the output data by checking that it matches the original data.
INTRODUCTION :
HYPERELASTIC MATERIAL :
Hyperelastic material models are regularly used to represent the large deformation behaviour of materials with Finite Element Analysis. They are commonly used to model mechanical behaviours of unfilled/filled elastomers. In addition to elastomers, hyperelastic material models are also used to approximate the material behaviour of biological tissues, polymeric foams, etc.
OGDEN MATERIAL :
The Ogden material model is a hyperelastic material model used to describe the non-linear stress-strain behaviour of complex materials such as rubbers, polymers, and biological tissues. The model was developed by Raymond Ogden in 1972. The Ogden model, like other Hyperelastic material models, assumes that the material behaviour can be described by means of a Strain energy density function, from which the stress-strain relationships can be derived.
MOONEY-RIVLIN :
The Mooney-Rivlin material model is a hyperelastic material model and is available for 2D, brick, tetrahedral, membrane, and shell elements.
PROCEDURE :
1. Import the material curve raw data from the given image into an Excel sheet and save it in.CSV format.

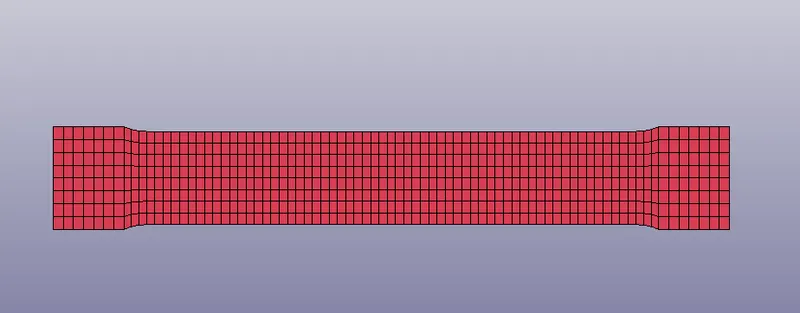
2. Open the Ls-prepost import the dogbone specimen.
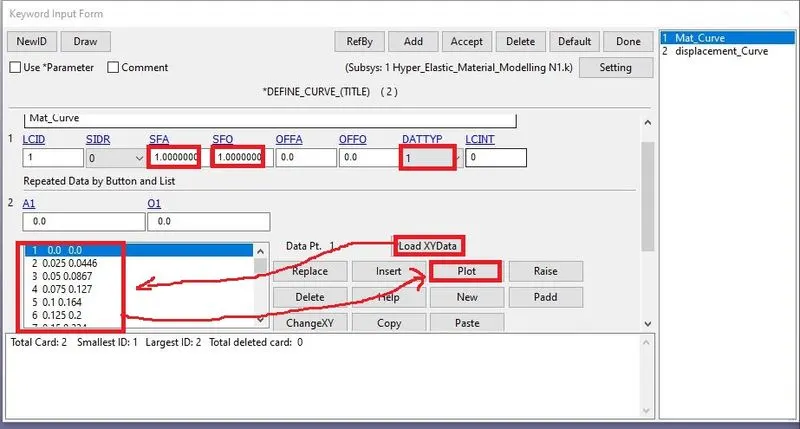
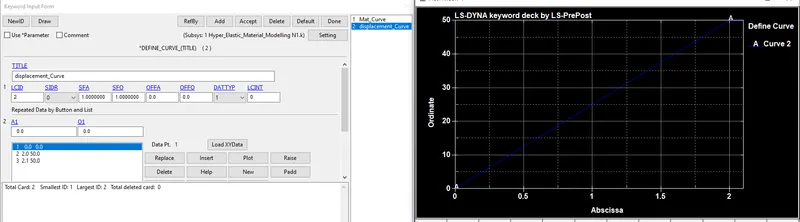
3. Create the material curve by using Excel .CSV file.
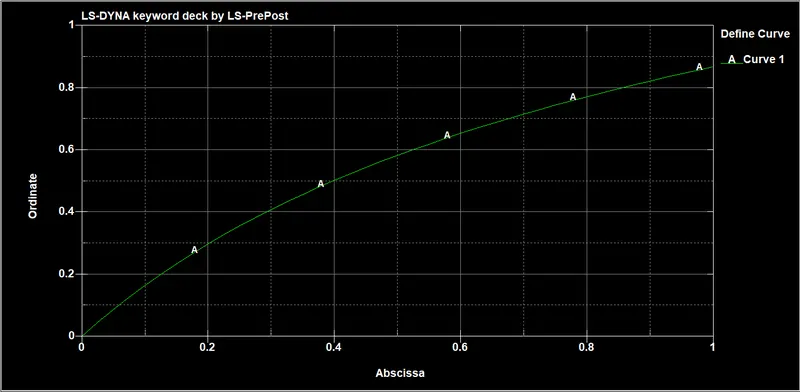
4. Select Keyword manager→All→Define→Curve→Load XYData →select .CSV file. See the Abscissa values and Ordinate values the data is imported.
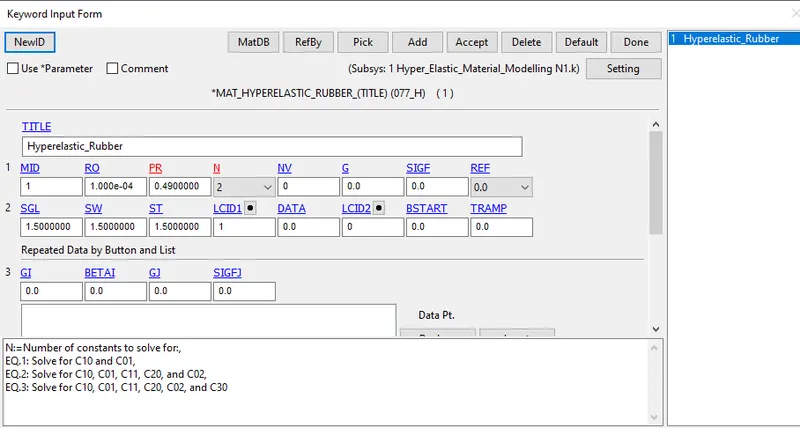
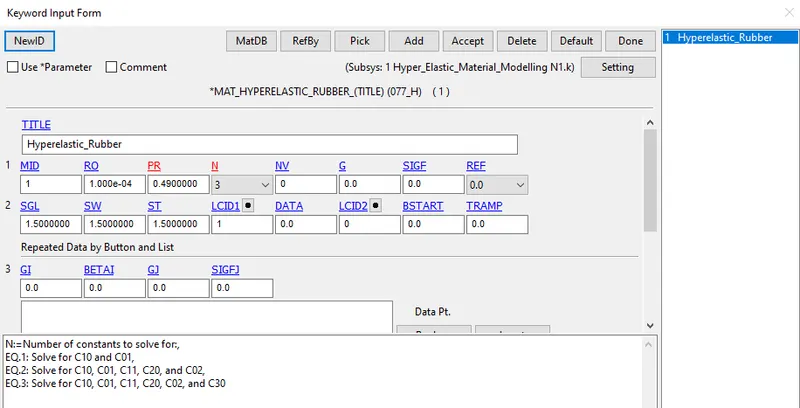
5. Next, create the material MAT_077_H Hyperelastic material assign the rubber material properties and material curve as shown below.
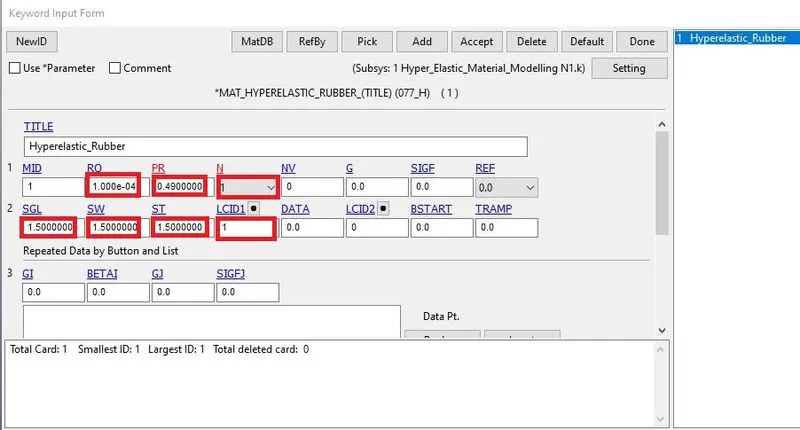
The N parameter in the *MAT77_H material card represents the order of polynomial for which the constants are required to solve. This involves N1, N2, and N3 cases where the constants are solved along with stretch and true stress data.
The Mooney-Rivlin constants for each polynomial order cases are:-
N1 Solves for Two Polynomials C10, C01
N2 Solves for Six Polynomials C10, C01, C11, C20, C02, C30
N3 Solves for Six Polynomials C10, C01, C11, C20, C02, C30
The SW, SGL, and ST parameters are set to unity as we have a stress-strain load curve unlike in the case of force-displacement data that requires specimen dimensions.
SW-Specimen Width
SGL-Specimen Gauge Length
ST-Specimen Thickness
6. Next create the Section for the dogbone specimen.
7.Select the Keyword manager→All→Section→Shell.
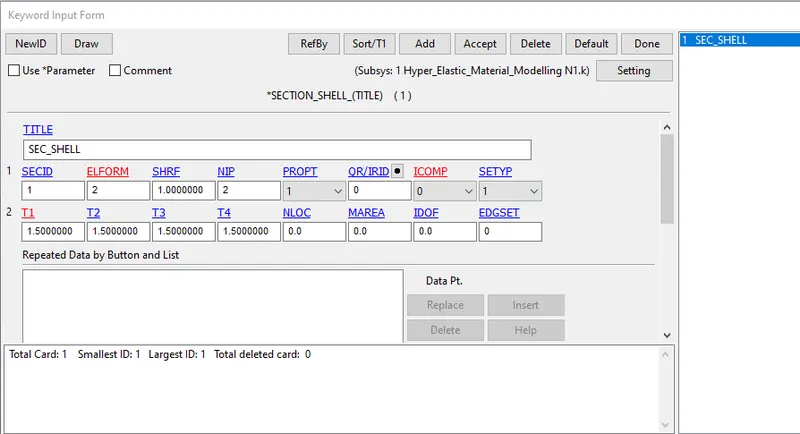
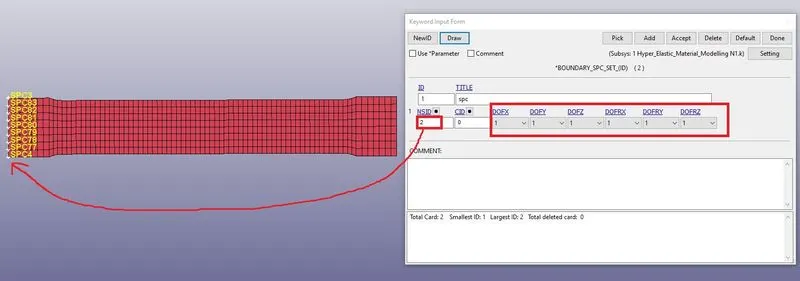
8. Next create the Boundary conditions
SPC
Constrained in all direction
Constrained in y-direction
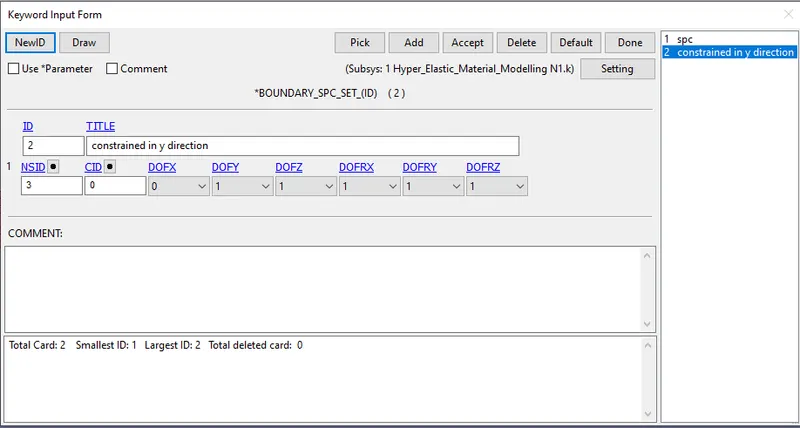
PRESCRIBED MOTION SET
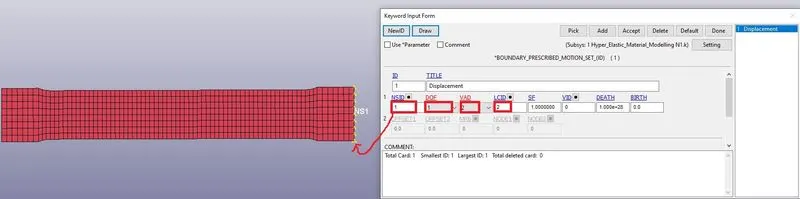
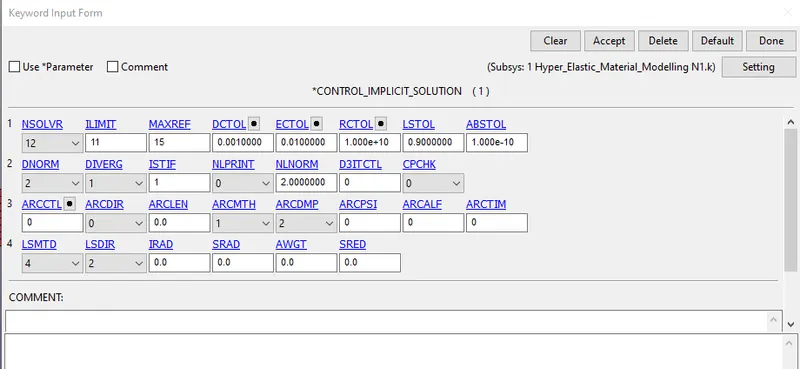
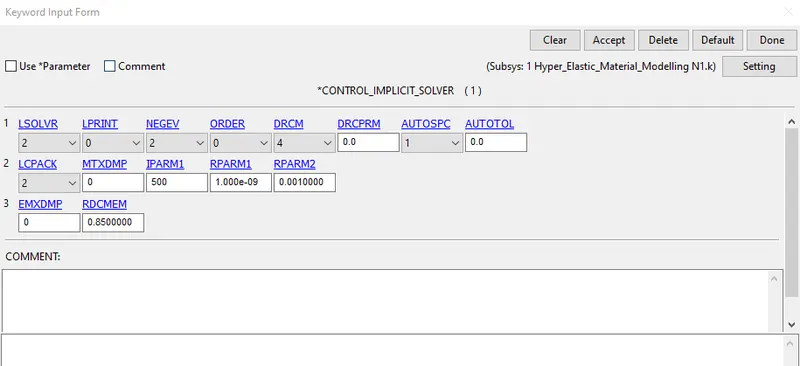
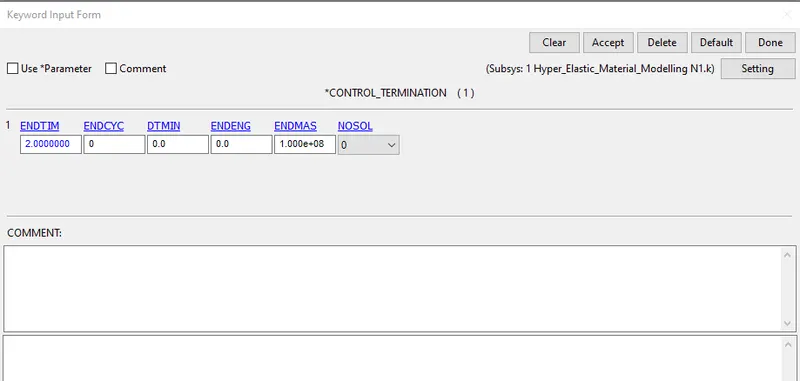
9. Next create the control card as shown below.
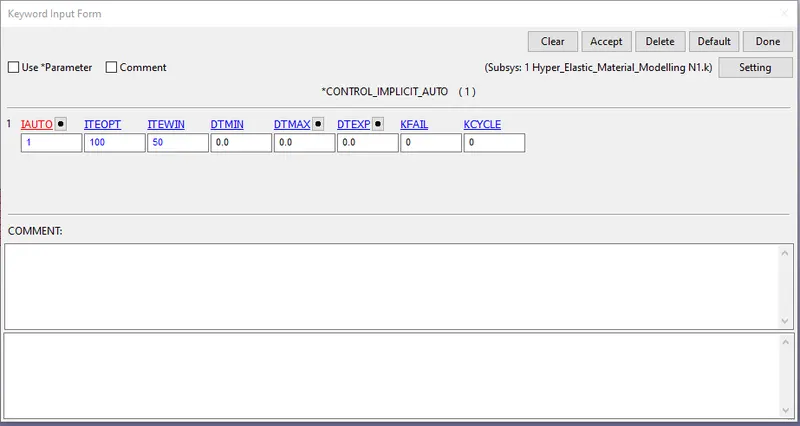
IMPLICIT_AUTO
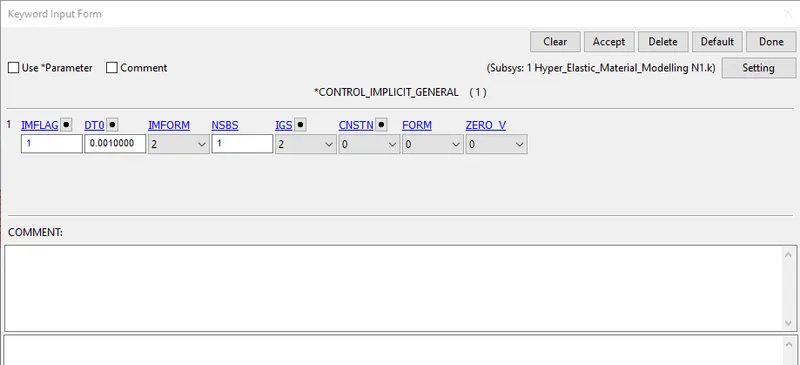
IMPLICIT_GENERAL
IMPLICT_SOLUTION
IMPLICIT_SOLVER
TERMINATION
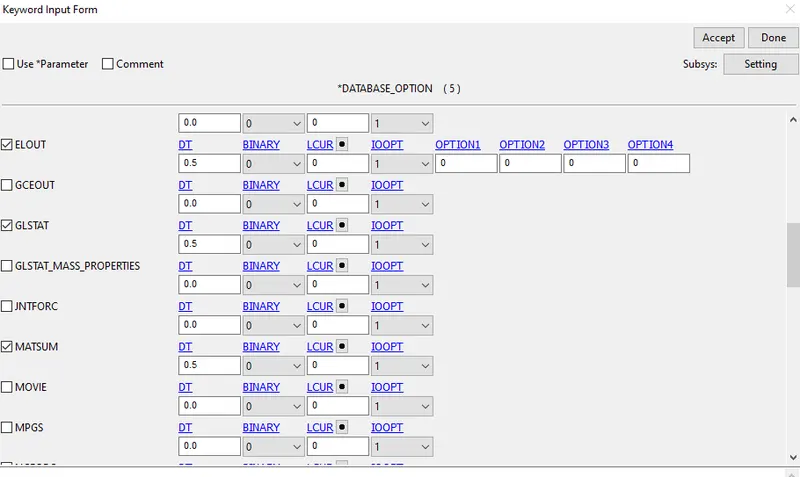
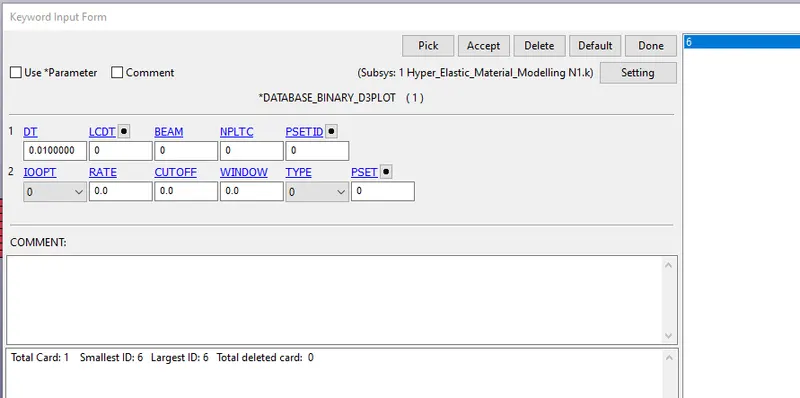
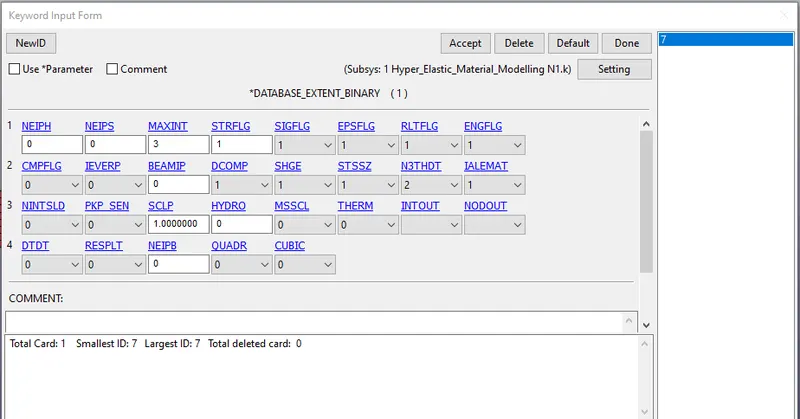
10. Create the Database files as shown below.
ASCII_option
BINARY_D3 PLOT
EXTENT_BINARY
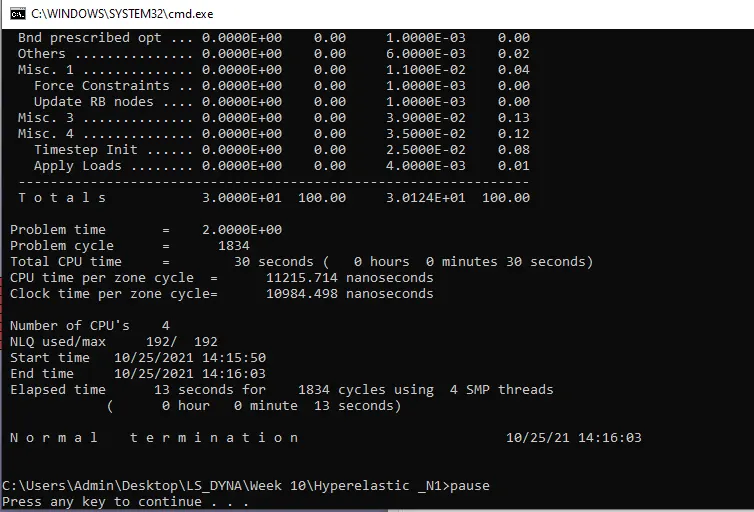
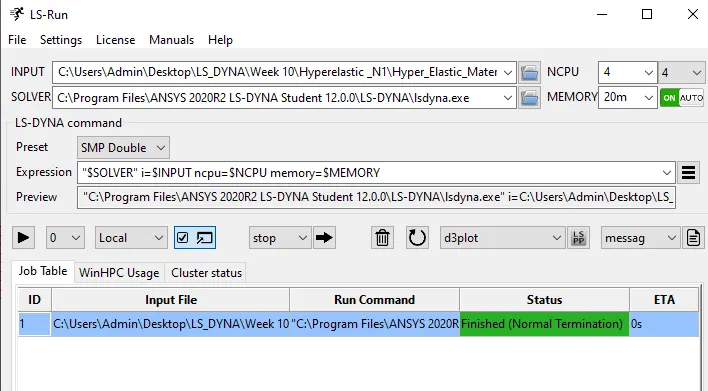
11. Save the file in a keyword and run the simulation in LS Run.
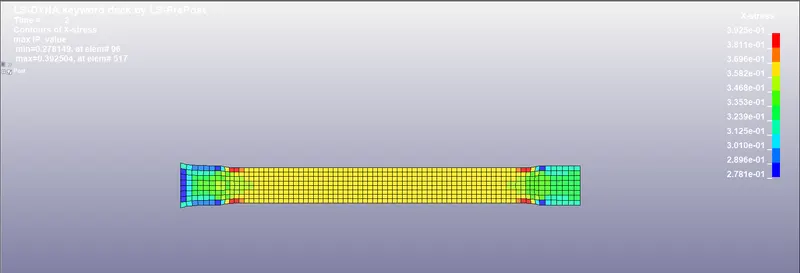
12. Next import the D3plot in LS-Pre post see the animation.
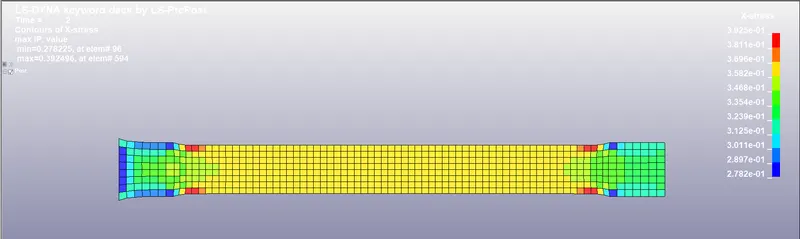
STRESS
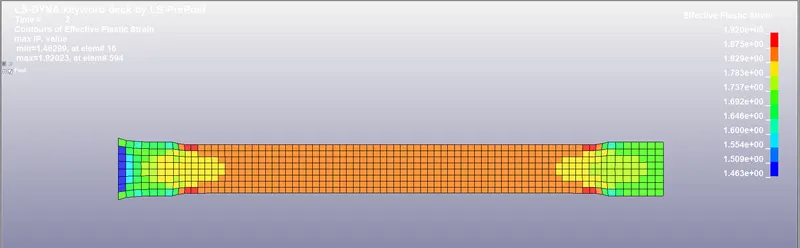
STRAIN
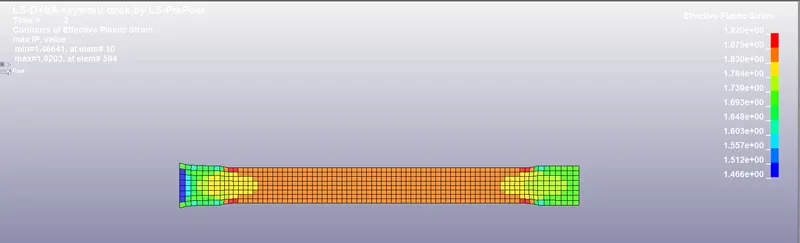
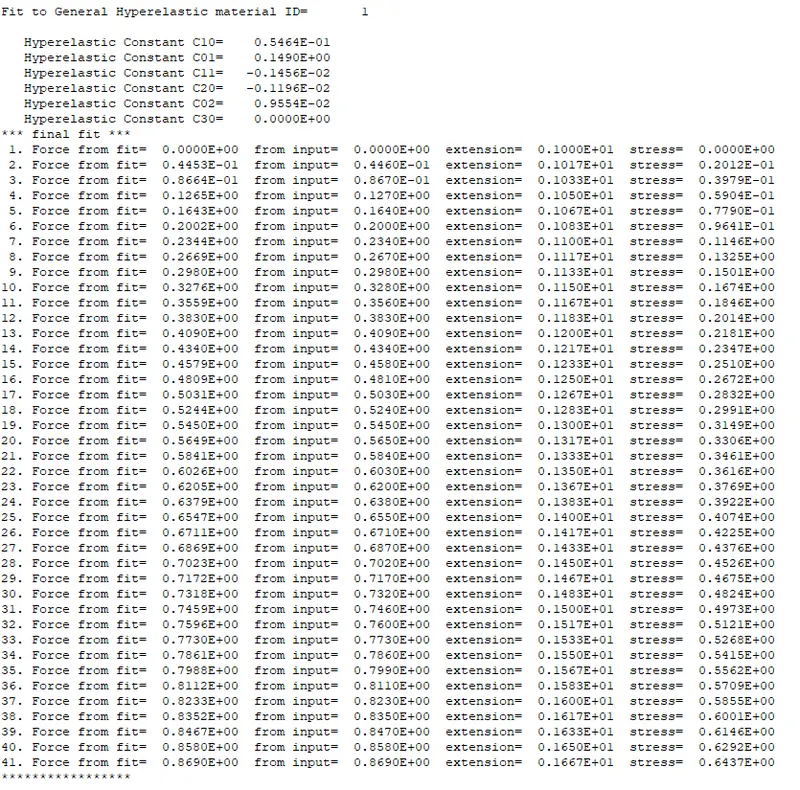
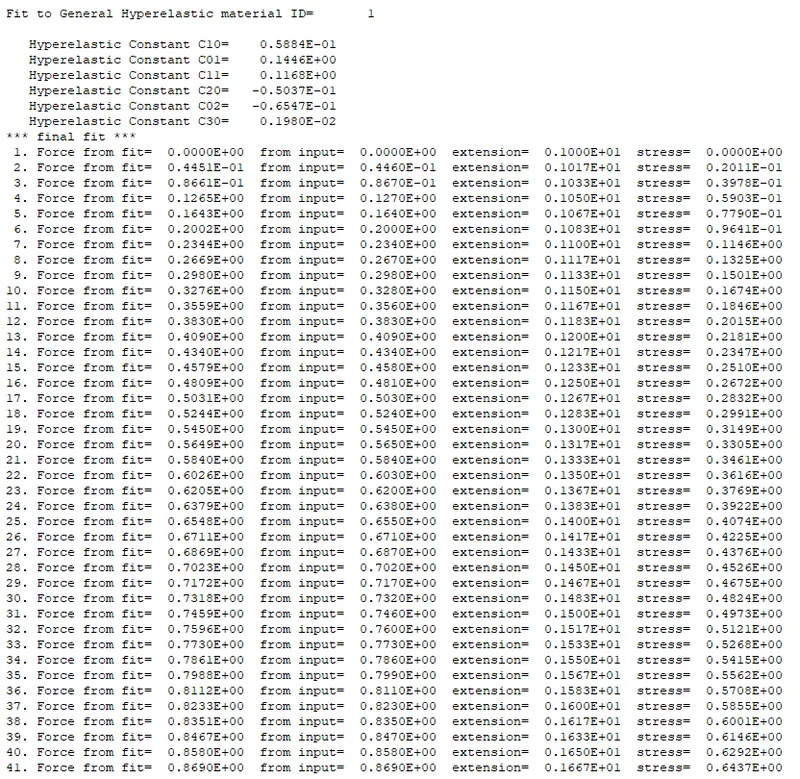
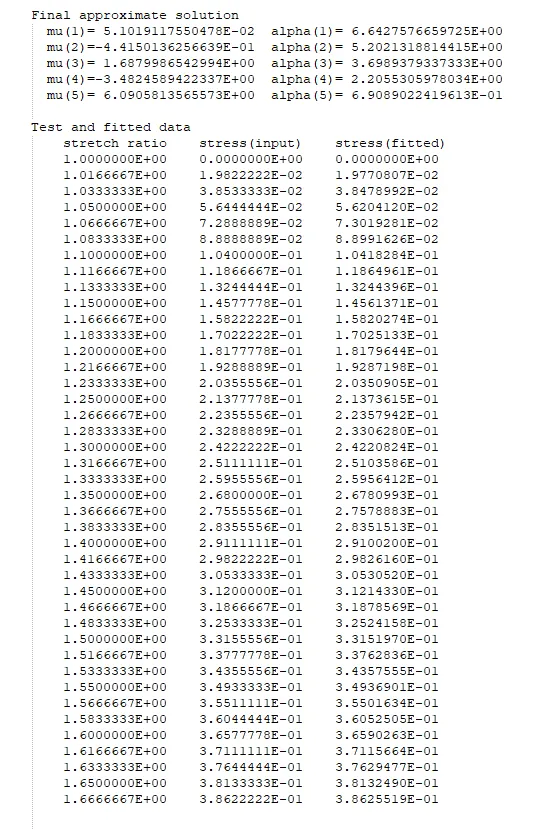
13. Open the d3shp in note pad see the Money Rivlin constant, stress and extension values as shown below.
N=1
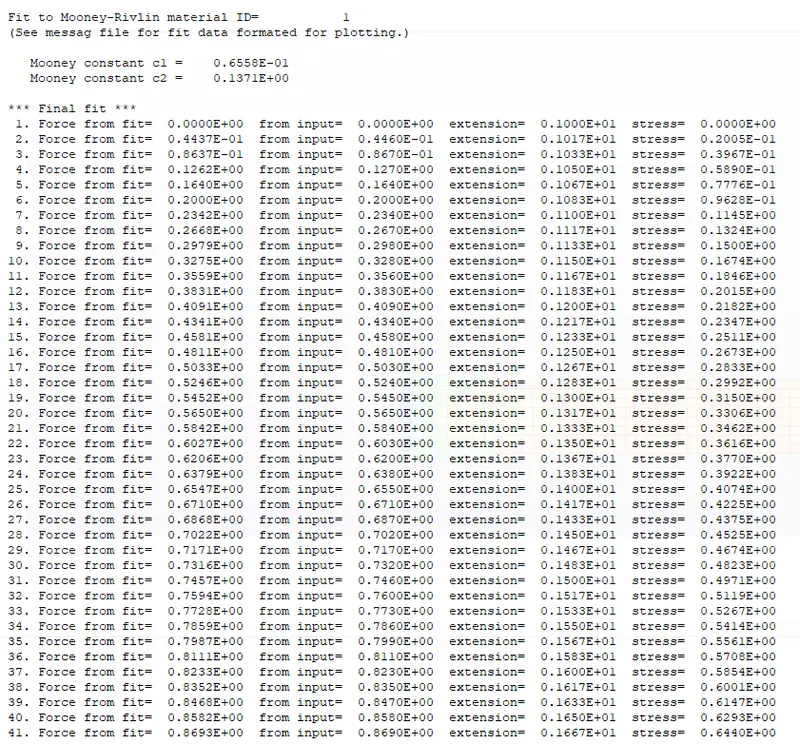
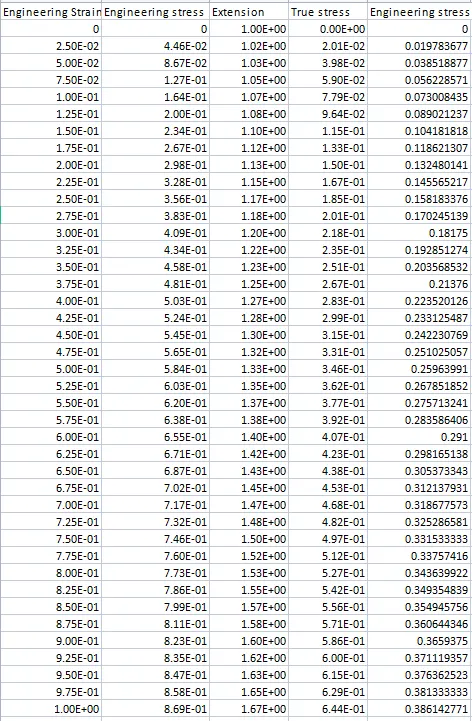
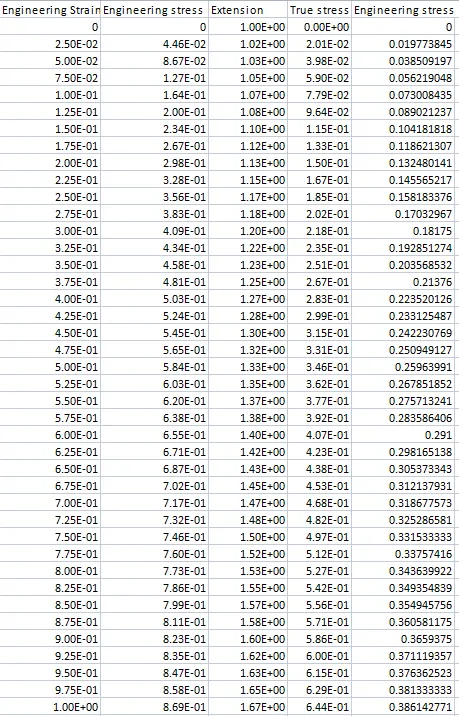
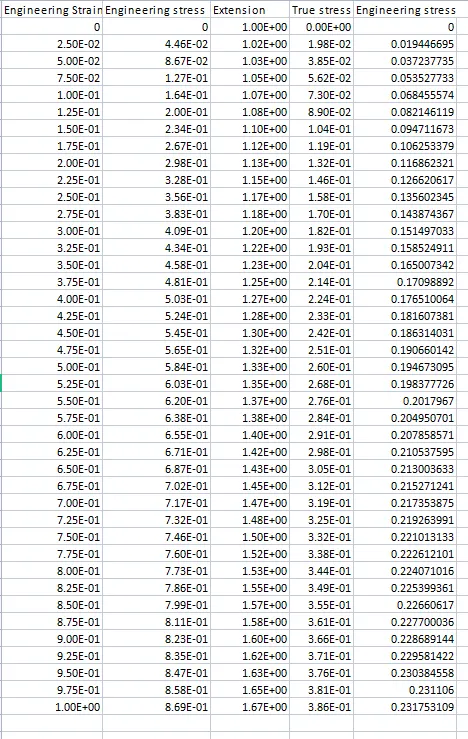
In the above image extension and true stress values by used these values to find the engineering stress.
Engineering Stress =True Stress/Stretch ratio or Extension
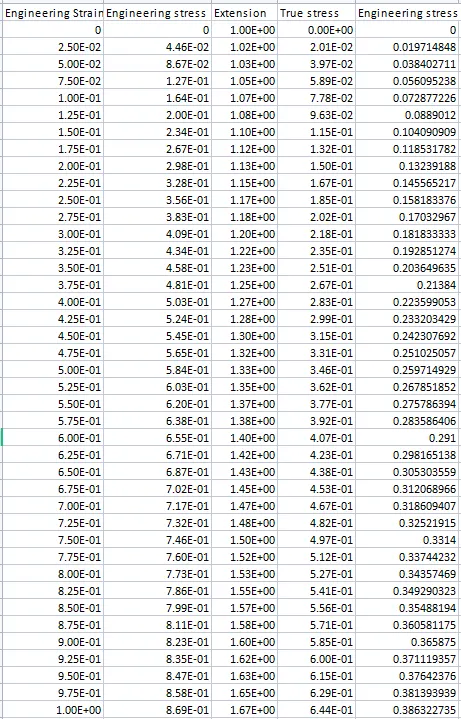
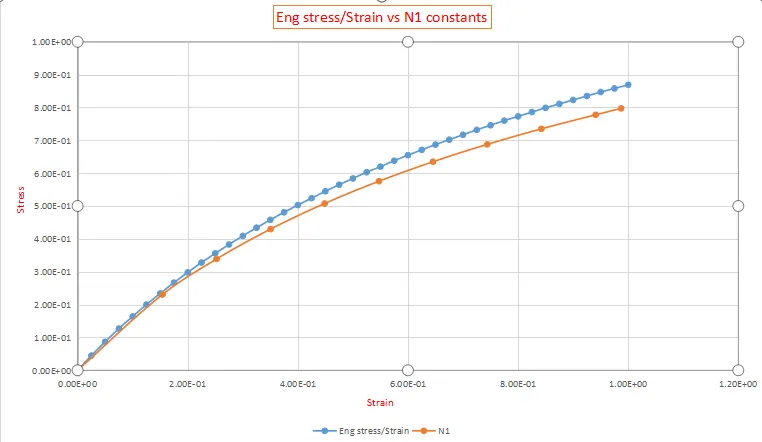
Comparison between Raw data and N1 constant data
N=2
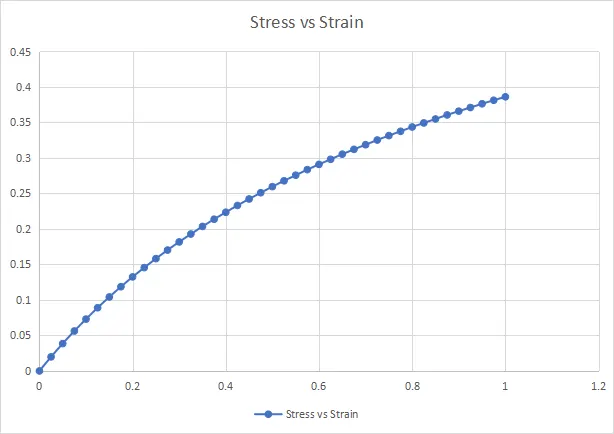
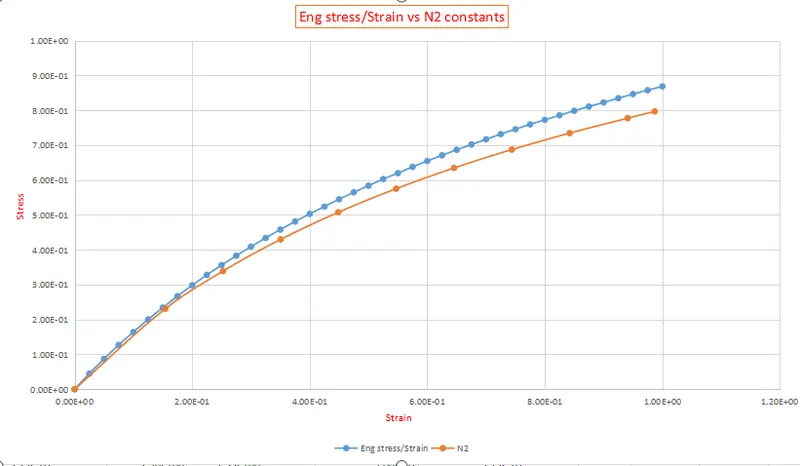
Comparison between Raw data and N2 constant data
N=3
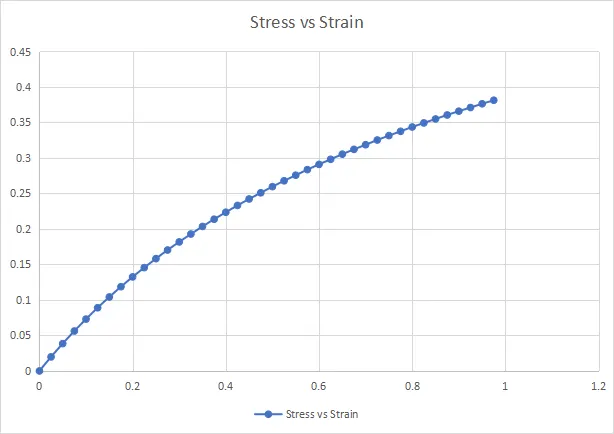
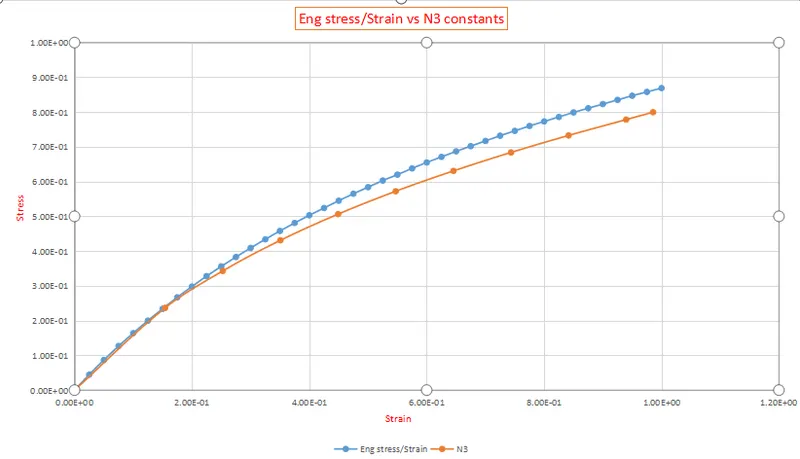
Comparison between Raw data and N3 constant data
OGDEN MATERIAL MODEL :
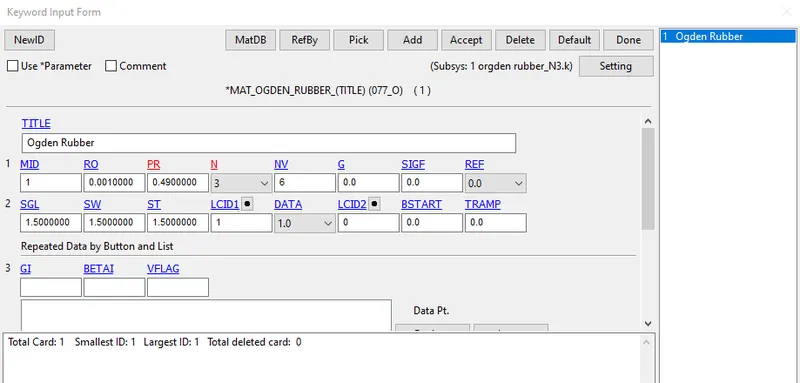
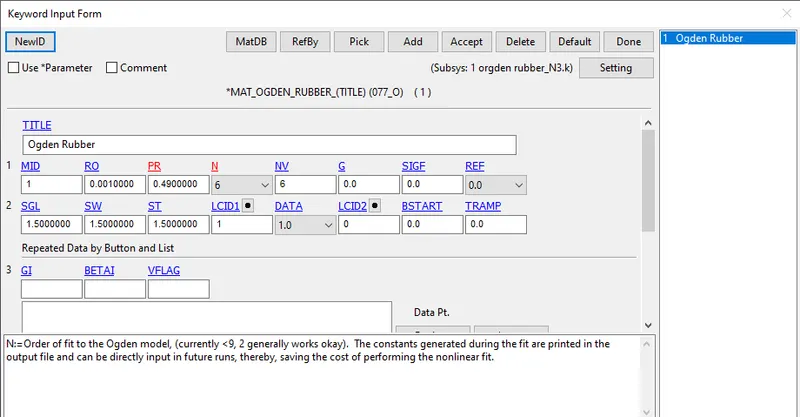
In this case, MAT_77_O_Ogden Rubber is Replaced instead of Hyperelastic Rubber
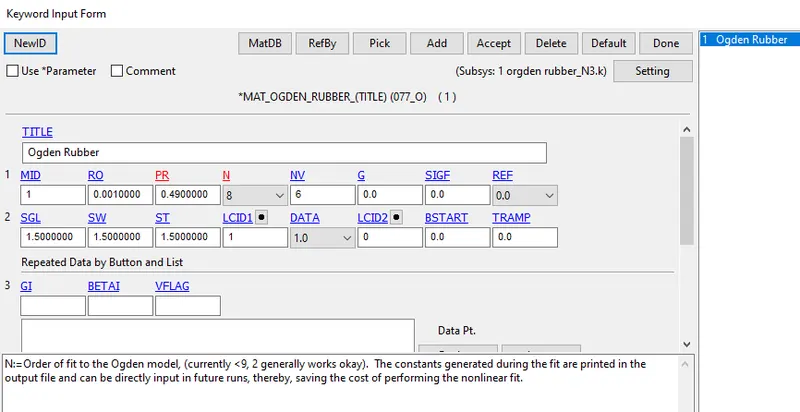
The Mat Ogden Card is Defined with the Properties of rubber
Density=0.001 gm/mm^3
Poissons Ratio=0.49
N=3
STRESS
STRAIN
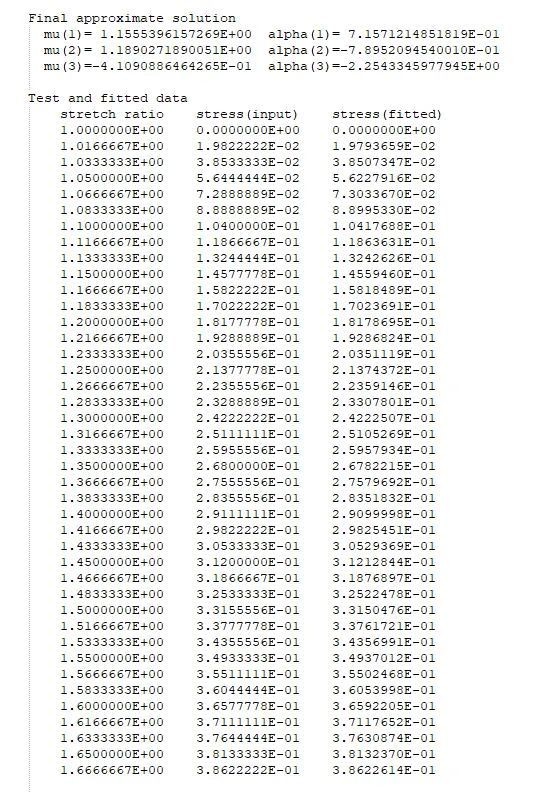
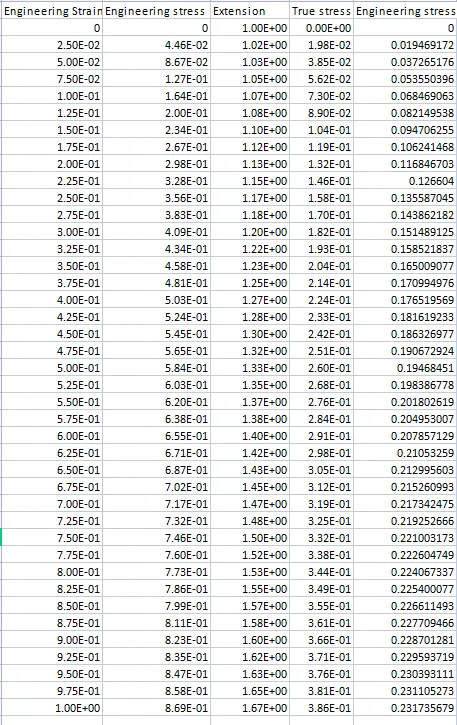
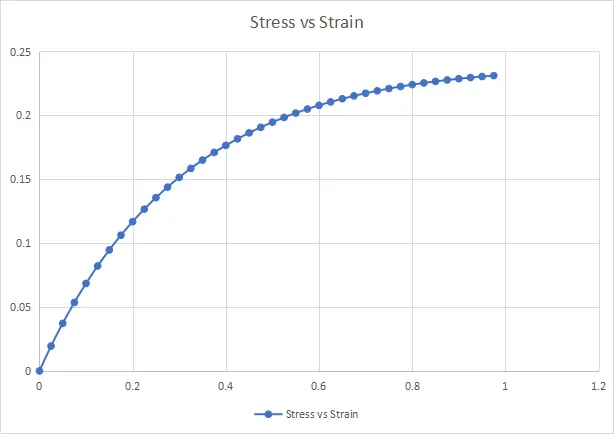
Comparison between Raw data and N3 constant data
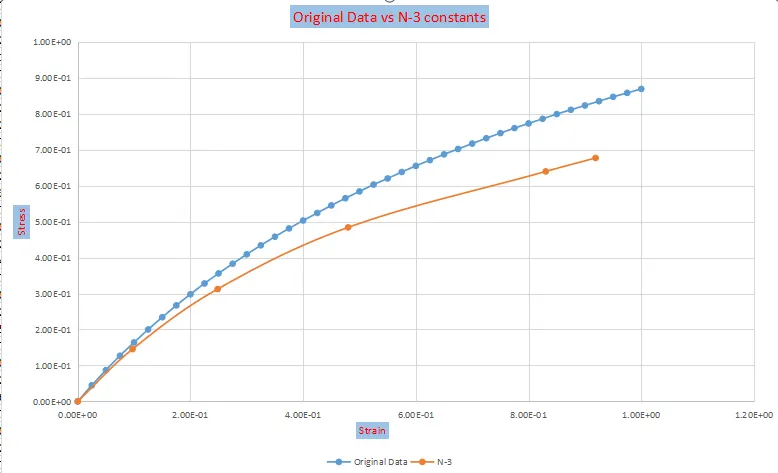
N=6
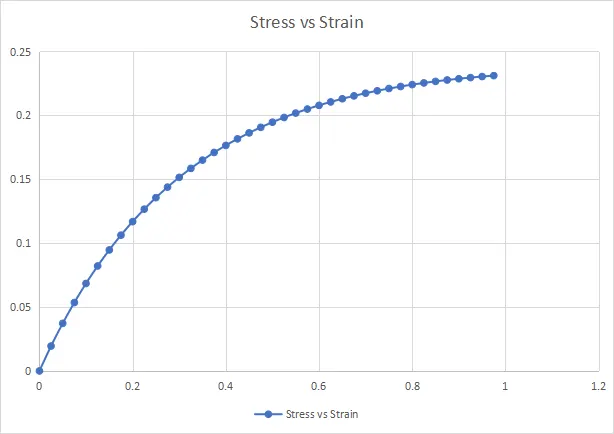
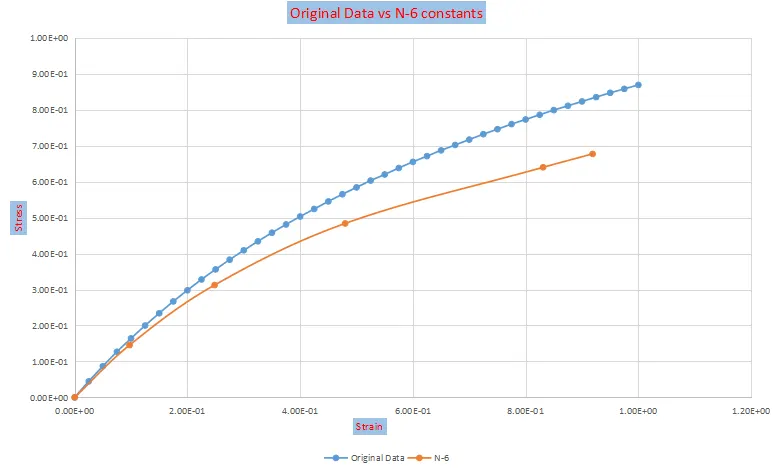
Comparison between Raw data and N6 constant data
N=8
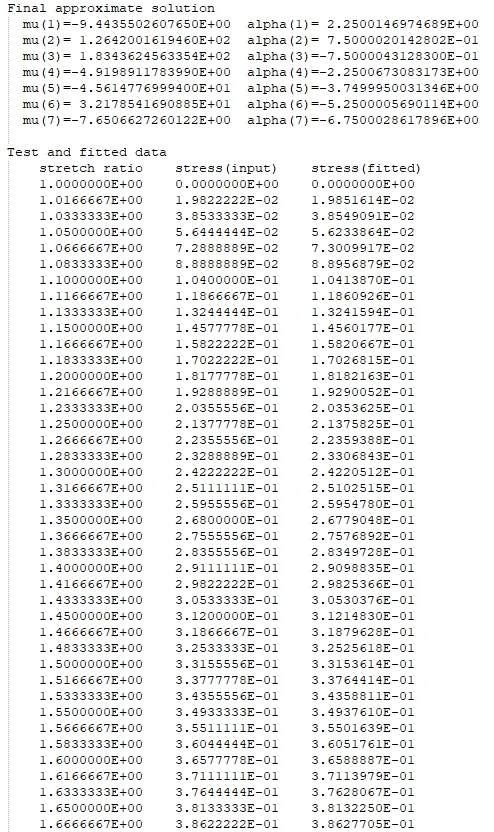
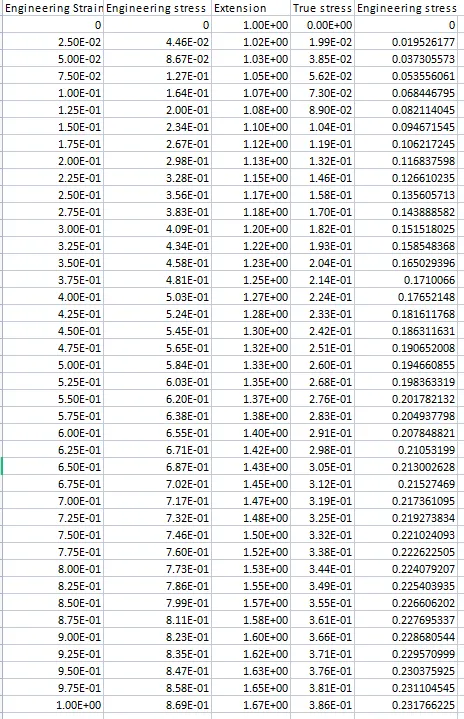
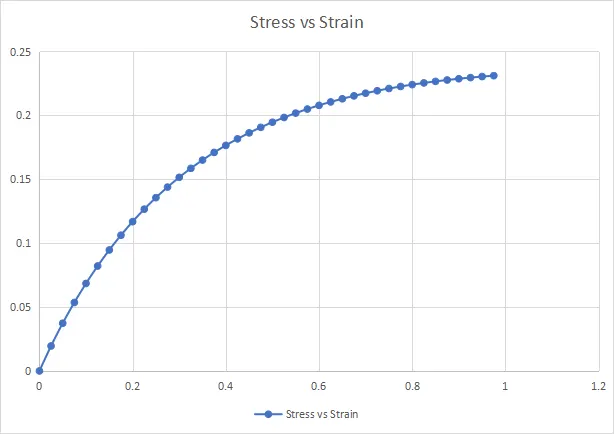
Comparison between Raw data and N8 constant data
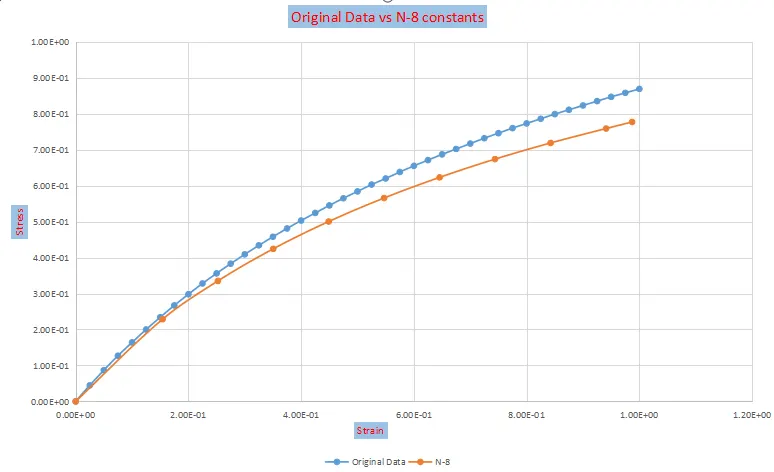
From the Graph the Fit values from N=8 are Quite similar to the Original data and comparatively fits better than the constants from N=6 and N=3
CONCLUSION :
From the above result, we can conclude that Ogden material shows better to Mooney Rivlin in terms of the stress-strain curve.