Week - 10 Hyperelastic Material Models
week 10 report
Aim: Calculate the Mooney Rivlin and Ogden material constants and compare the both using stress-strain data from a Dogbone specimen tensile test with 100 percent strain. The given data is the engineering stress-strain in MPa/(mm/mm). The comparison should be shown from the d3hsp file and using simulation.
Procedure:
1. Experimental Data:
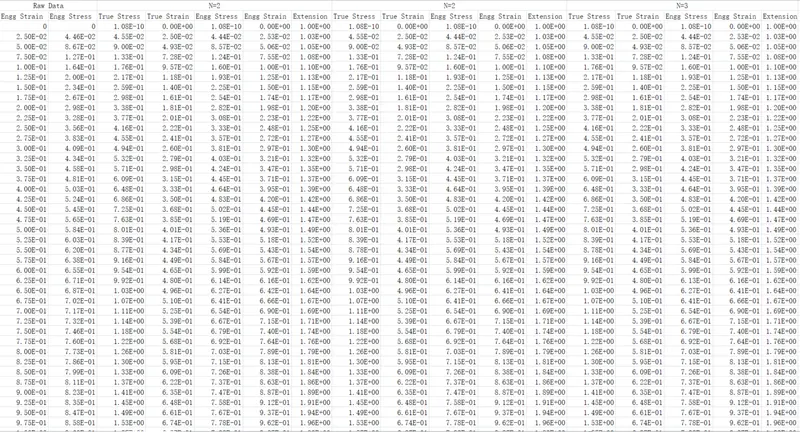
The given experimental data is shown as follow:
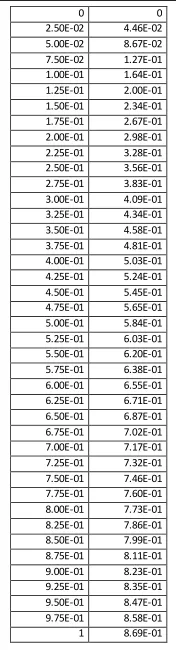
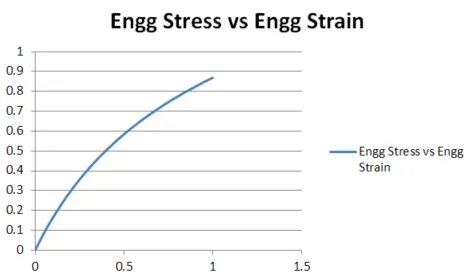
Input data into excel and create Engg Stress vs Engg Strain plot.
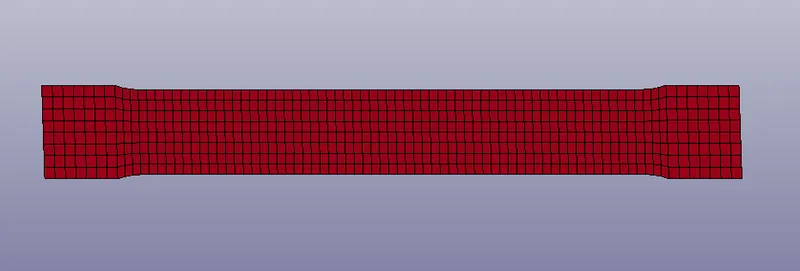
2. Part Definition
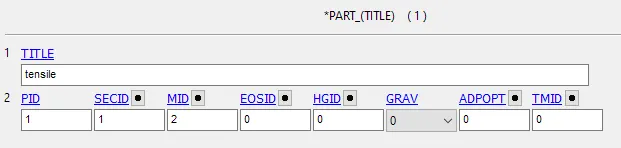
Import part model into Ls-Dyna
In this case, we going to use two hyperelastic material MAT_HYPERELASTIC_RUBBER and MAT_OGDEN_RUBBER. In order to find hyperelastic constant, we fill focus on parameter N.
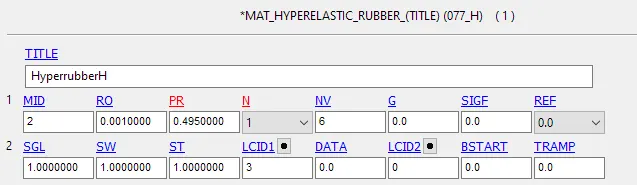
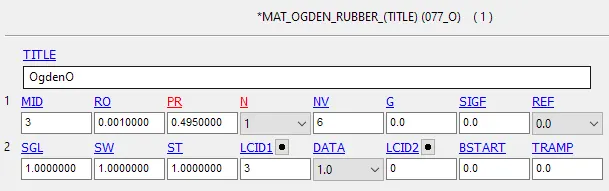
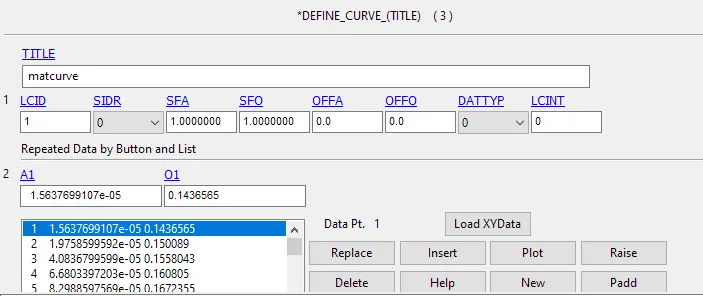
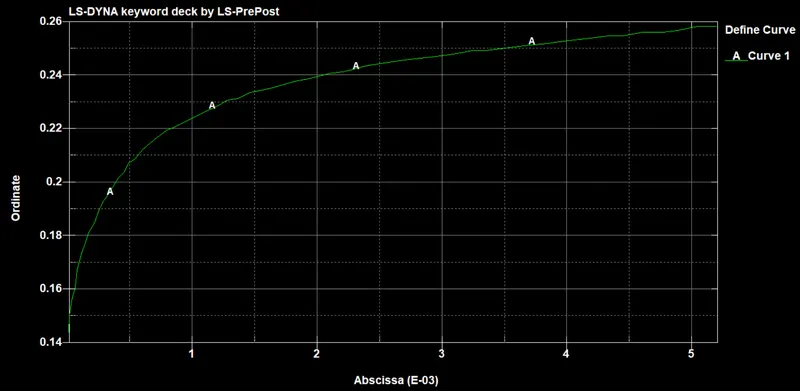
LCID 3 is the Engg Stress vs Engg Strain plot showing above, import into defined curve.
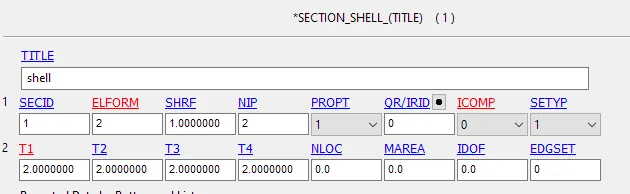
Define shell section
Assign material and section to the part.
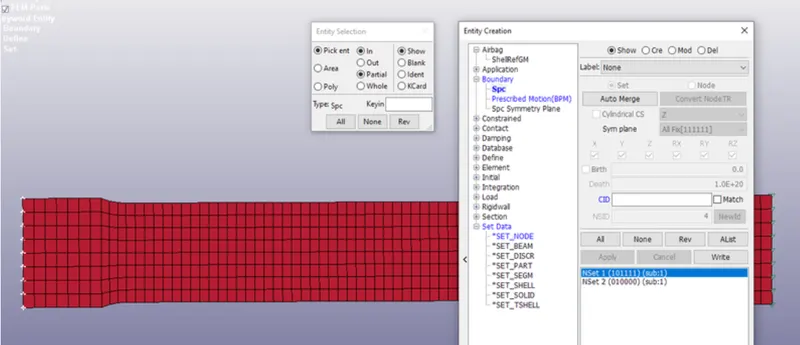
3. Boundary Condition
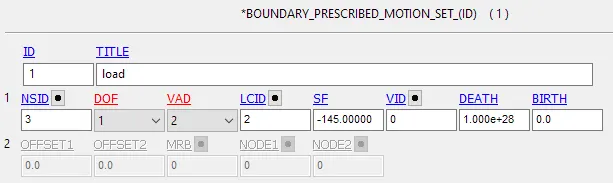
Left end fixed all the point in X and Z direction
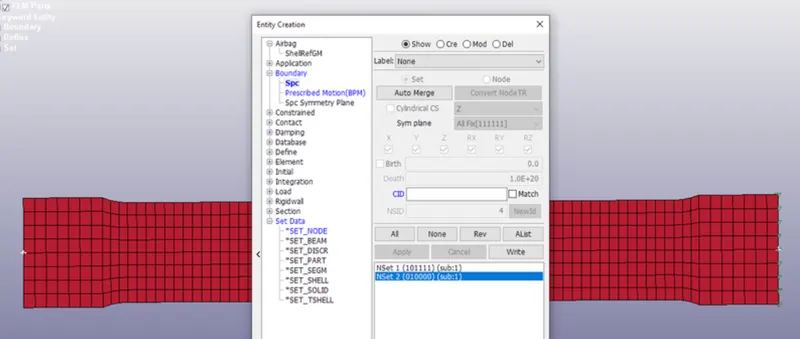
The middle points in two ends fixed Y direction
4. Load
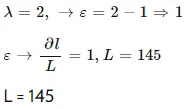
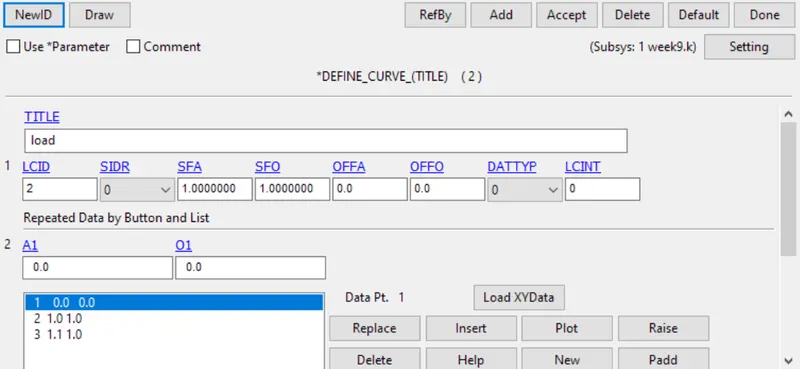
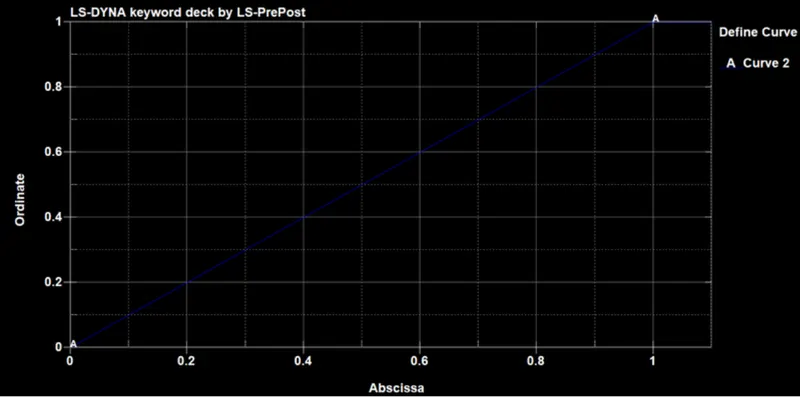
Create load curve and apply on the right end. Because Dogbone specimen tensile test with 100 percent strain. So according to calculation, displacement on the right end is 145.
5. Database Option
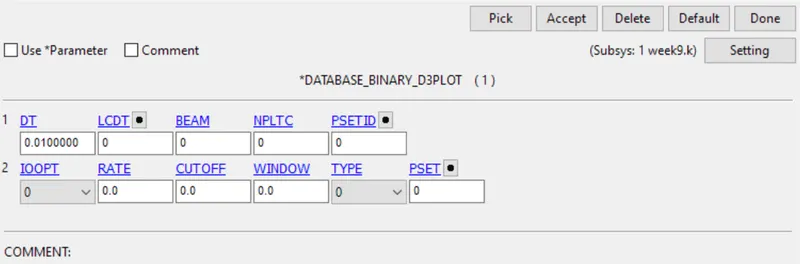
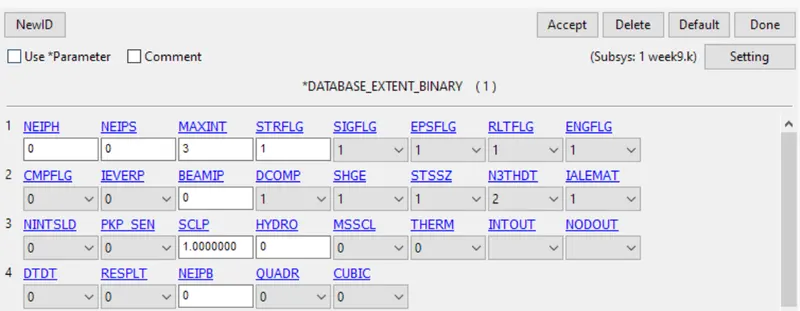
6. Control Setting
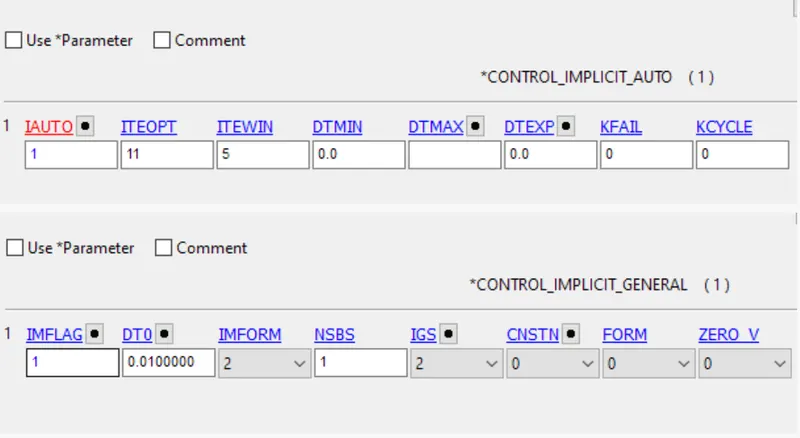
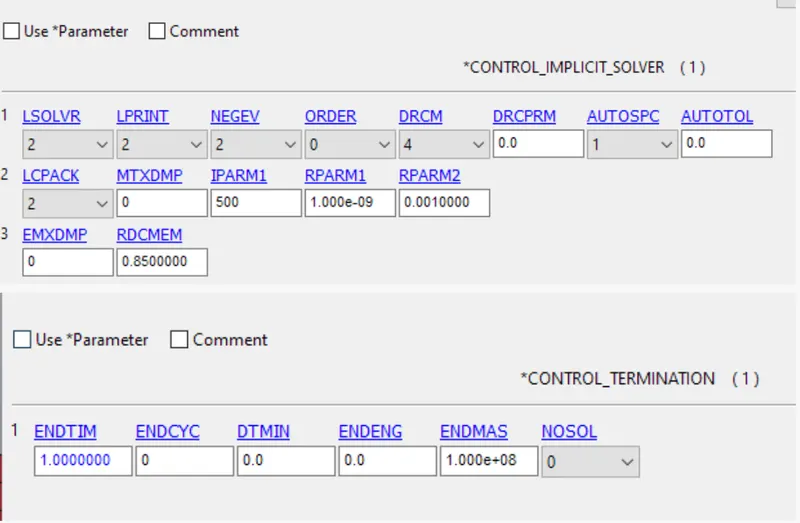
7. Data Verification
1. Mooney-Rivlin material:
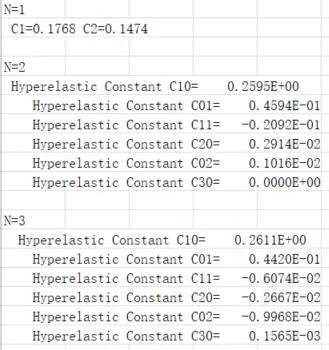
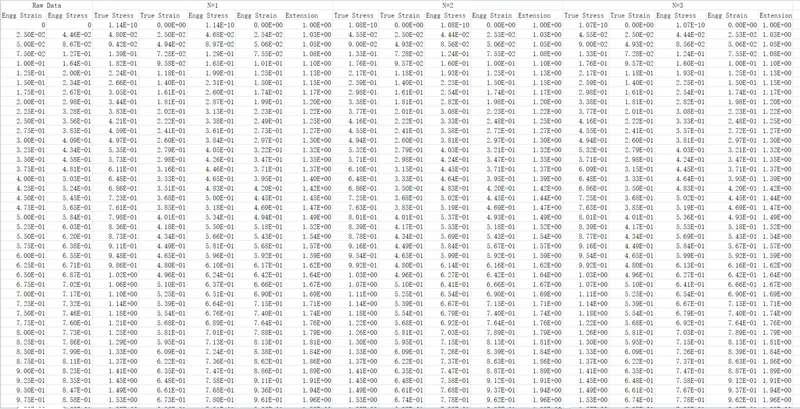
Run the simulation with N=1,2,3, find hyperelastic constant in d3hsp file.
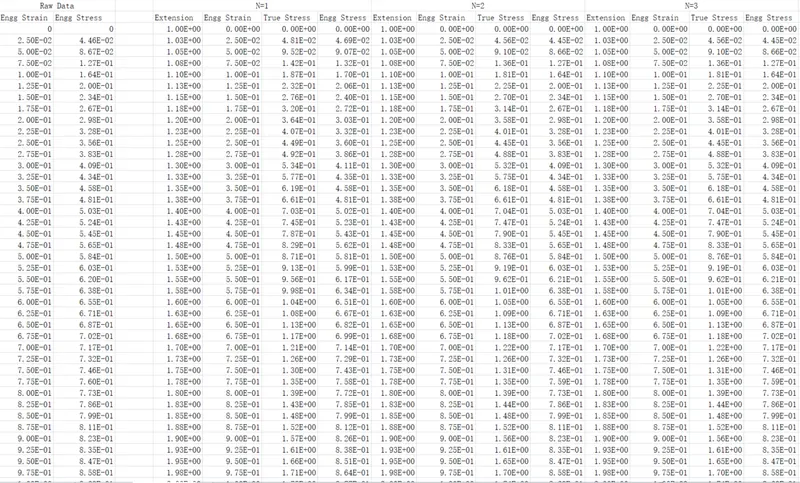
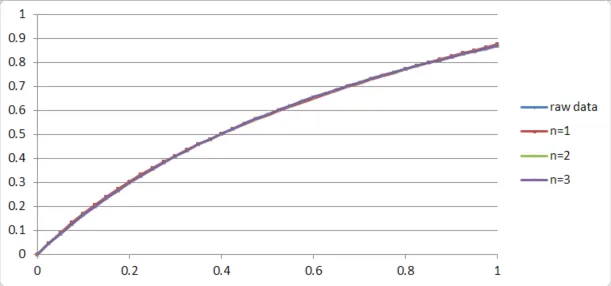
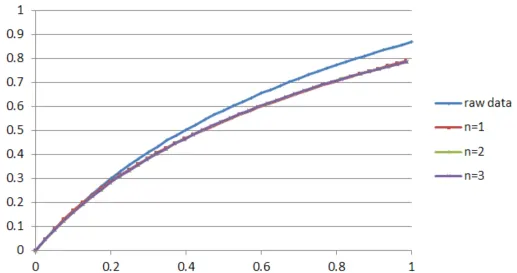
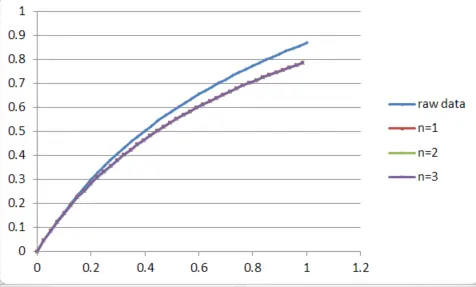
Check extension and stress data in d3hsp file, import data into excel. Compare with raw experimental data.
2. OGDEN material:
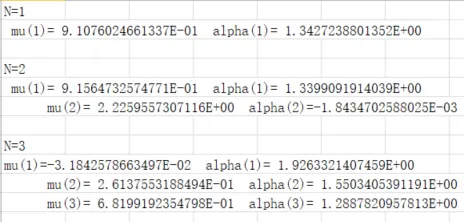
Run the simulation with N=1,2,3, find hyperelastic constant in d3hsp file.
Check stretch ratio and stress (fitted) data in d3hsp file, import data into excel. Compare with raw experimental data.
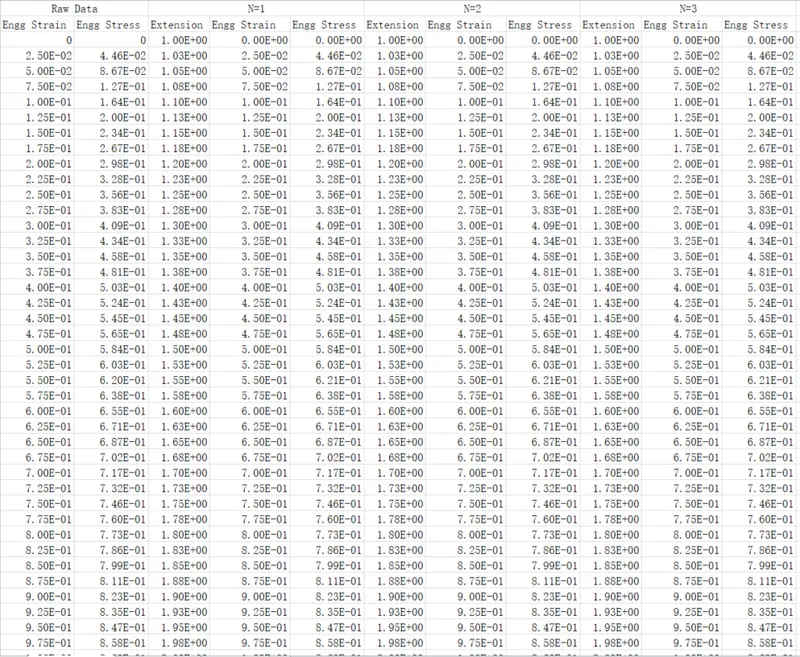
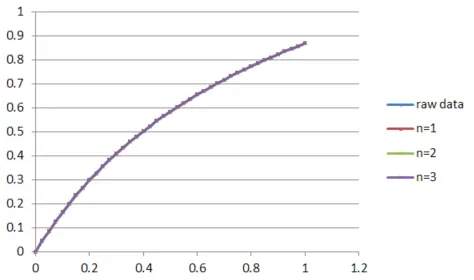
8. Data Validation
1. Mooney-Rivlin material:
Set N=0 and import 3 different sets of hyperelastic constant. Run the simulation
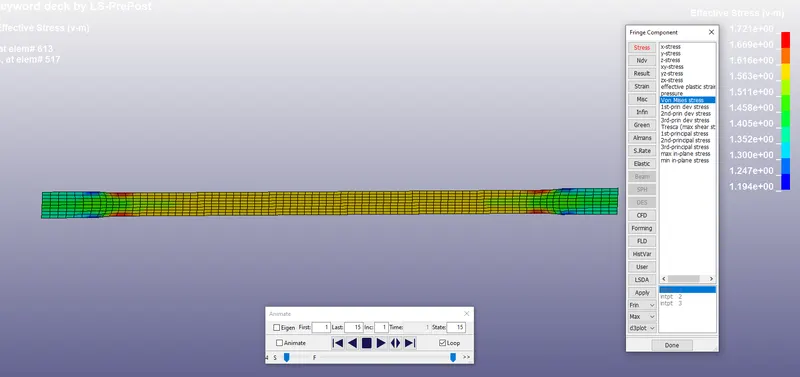
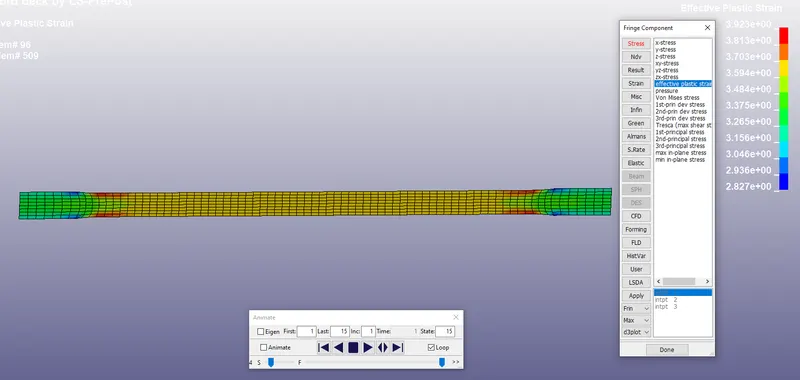
Select an element in the middle of the part, check x-stress and lpt lower strain history. Import data to excel and compare 3 sets of data with experimental data.
2. OGDEN material:
Set N=0 and import 3 different sets of hyperelastic constant. Run the simulation
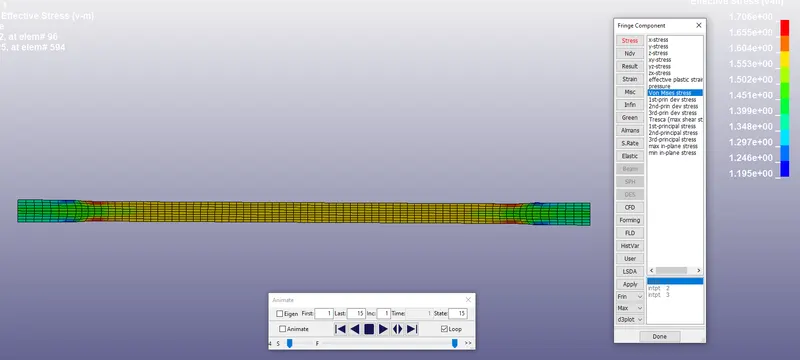
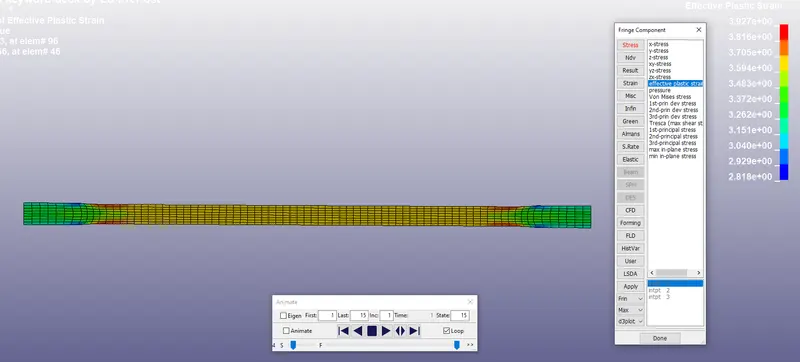
Select an element in the middle of the part, check x-stress and lpt lower strain history. Import data to excel and compare 3 sets of data with experimental data.
Conclusion:
1. The Mooney and Ogden material constants are obtained and verified from the d3hsp file
2. From verification data, both engg strain vs engg stress plot of Mooney and Ogden material match the given experimental raw data.
3. From validation data, both engg strain vs engg stress plot of Mooney and Ogden material have slight deviation to the given experimental raw data due to non-linear behavior.