Week - 10 Hyperelastic Material Models
AIM:
To calculate the moony rivlin and Ogden material constants and compare both using stress-strain data from adogbone specimen with stretch ratio = 2.
The given material data is engineering stress-strain data in MPa.
Theory
A hyperelastic or Green elastic material is a type of constitutive model for ideally elastic material for which the stress–strain relationship derives from a strain energy density function. The hyperelastic material is a special case of a Cauchy elastic material.
Hyper Elatic_Rubber:
Rubber is generally considered to be fully incompressible since the bulk modulus greatly exceeds the shear modulus in magnitude. To model the rubber as an unconstrained material a hydrostatic work term, 𝑊𝐻(𝐽), is included in the strain energy functional which is function of the relative volume, 𝐽, [Ogden 1984]: 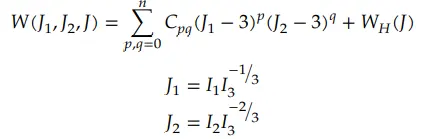
In order to prevent volumetric work from contributing to the hydrostatic work the first and second invariants are modified as shown.
Ogden_Rubber:
Rubber is generally considered to be fully incompressible since the bulk modulus greatly exceeds the shear modulus in magnitude. To model the rubber as an unconstrained material, a hydrostatic work term is included in the strain energy functional that is a function of the relative volume, 𝐽.

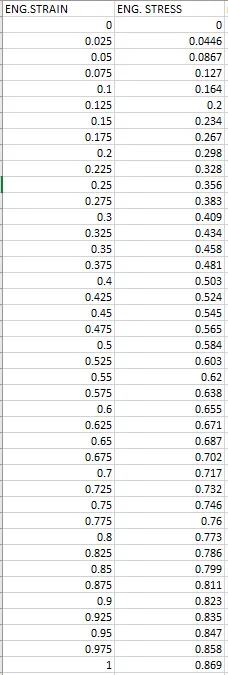
The given data:
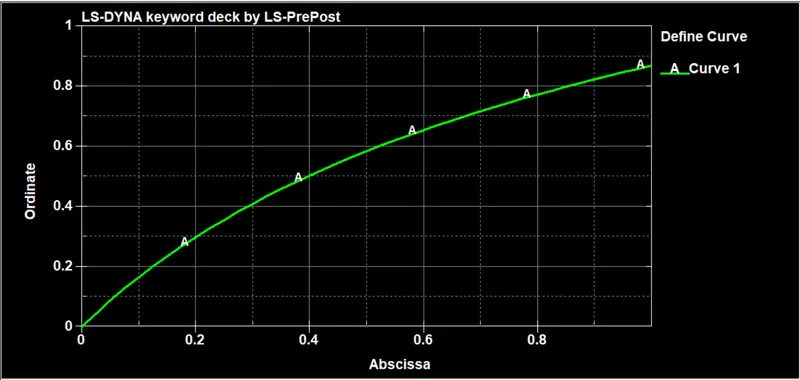
Engineering Stress vs Engineering Strain curve:
Specimen:
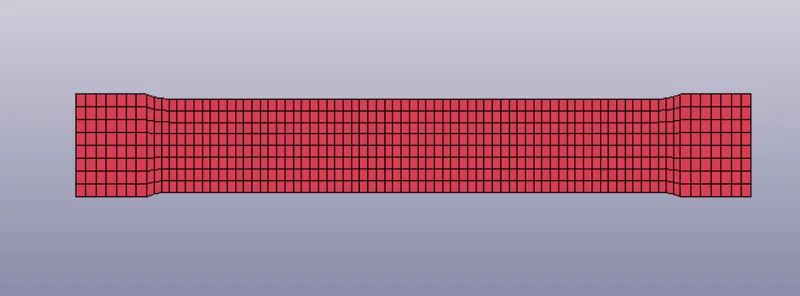
To check and validate the given material model data with models of Mooney rivlin and Ogden, a dog bone specimen is taken for the analysis.
The Mat_Ogden_Rubber is created:
Here
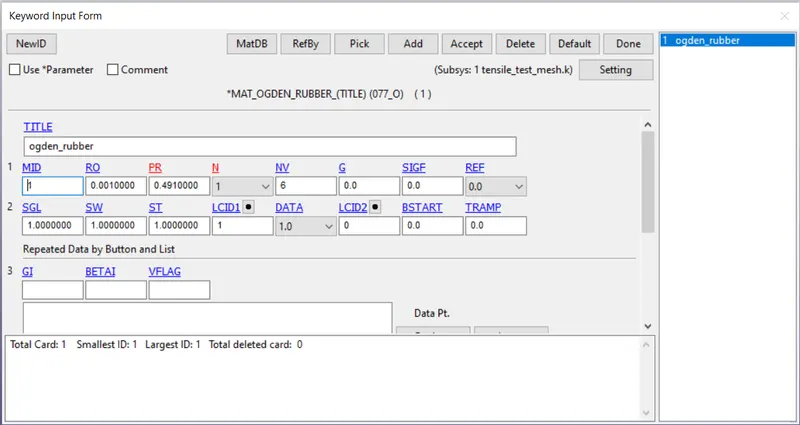
N: Order of fit to curve LCID1 for the Ogden model. The constants generated during the fit are printed in d3hsp and can be directly input in future runs, thereby, saving the cost of performing the nonlinear fit. The goodness of the fit can be visually evaluated by plotting data in the output file curveplot using LS-PrePost.
N1 solves for two polynomials: C1, C2
N2 solves for six polynomials: C10, C01, C11, C20, C02, C30
N3 sloves for six polynomials: C10, C01, C11, C20, C02, C30
The given material properties are provided in the form a plot
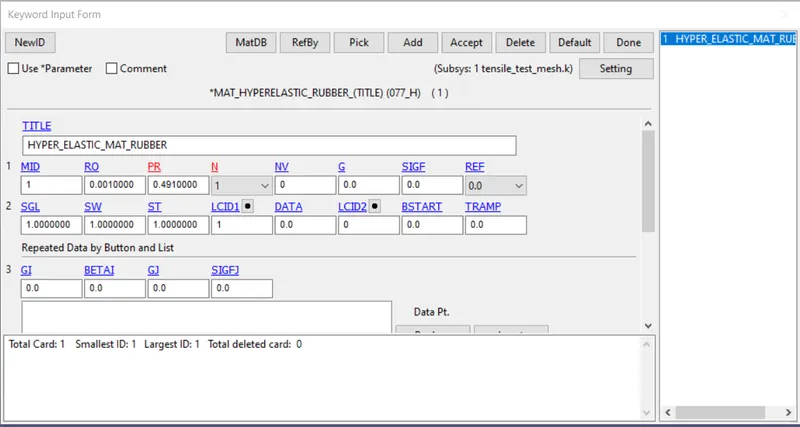
The valus of SW, SGL, ST are sent to unity as the curve provided by us is true stress-strain data.
If the curve provided is Force-displacement, we have to provide the dimensions SW: width, SGL: Length, ST:Thickness.
Section:
As the specimen is a shell, Section_shell is created.
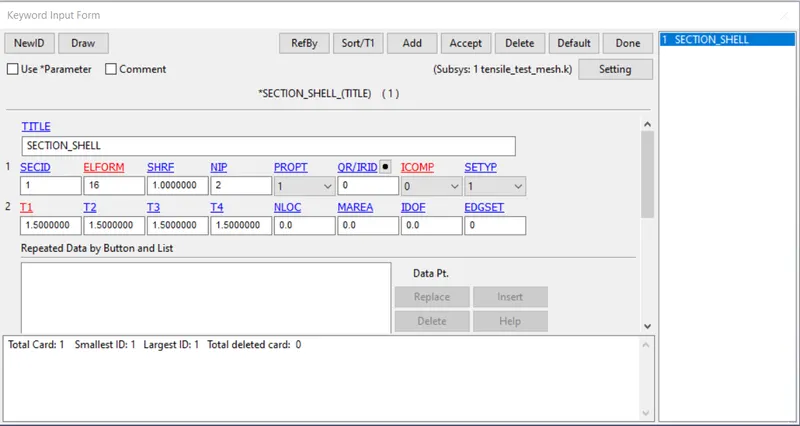
Assign the created material and section to the part.
Use appropriate boundary conditions to simulate tensile behavior for the model:
From the below figure we can see that the compression is happening in y-direction and in the other direction, the lateral strain can be seen in the form of bulging out.
Poissons ratio explains this phenomenon, It is defined as the ratio of lateral strain to the longitudinal strain.
We cannot constrain one side of specimen in all degrees of freedom to make it rigid. If we do so, the deformation will be in the tapered manner.
so, we need to constrain in a specific manner as shown below.
1. Constrain all nodes of the side(rigid side) in the x-translation.
2. constrain the set of nodes (middle node on either side of the specimen) in y-direction. These nodes can move in z-direction.
Now, the deformation will take place in a natural way.
Now, we need to provide the prescribed motion on the other side. the degree of freedom is provided in x-direction by constraining all other sides.
As shown below, the node at center on either side is constrained in y-direction.
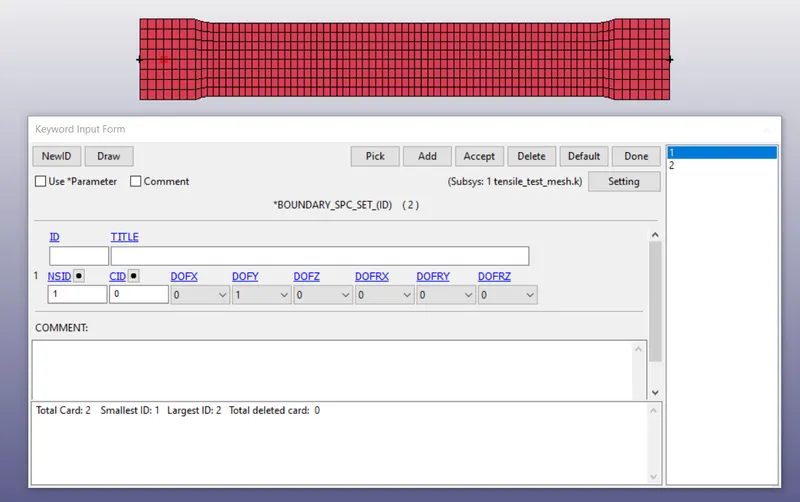
Constrain all nodes of the side(rigid side) in the x-translation.
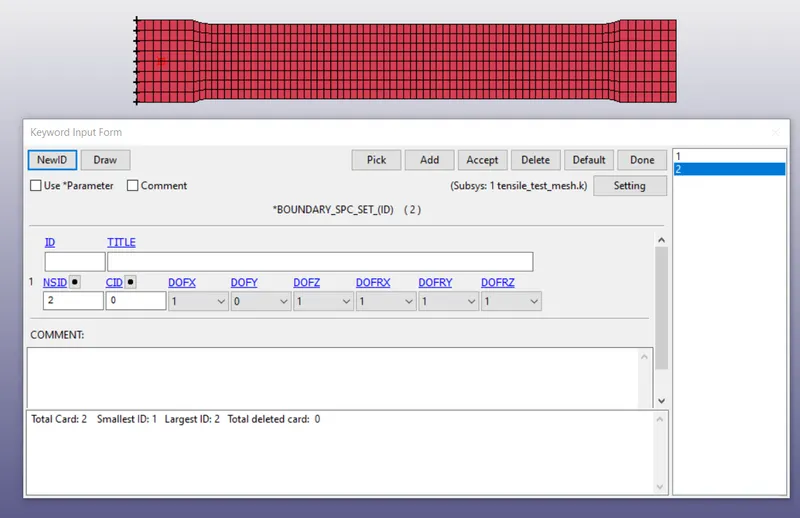
we need to provide the prescribed motion on the other side. the degree of freedom is provided in x-direction by constraining all other sides.
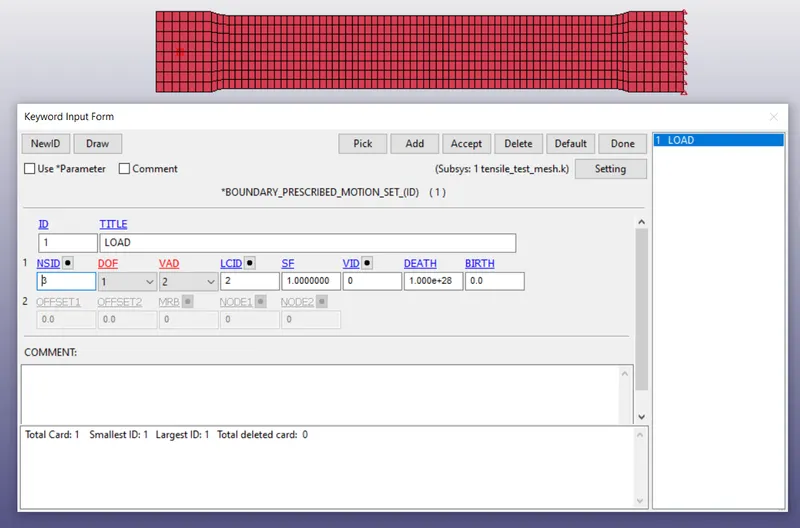
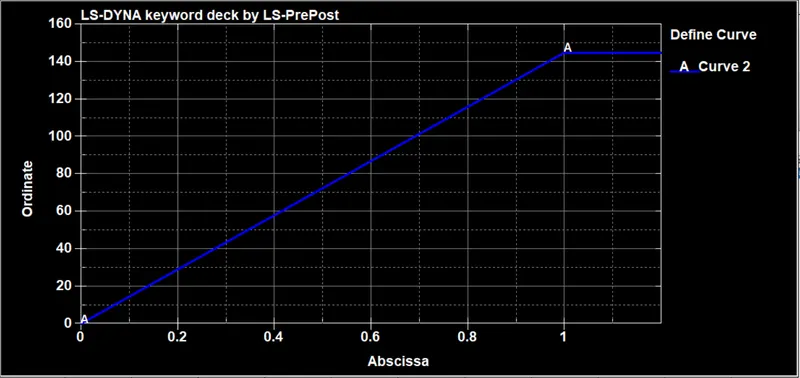
The curve defined to provide the displacement is
change in length is provided as 145 mm as given.
100% strain is nothing but the stretch = 2.
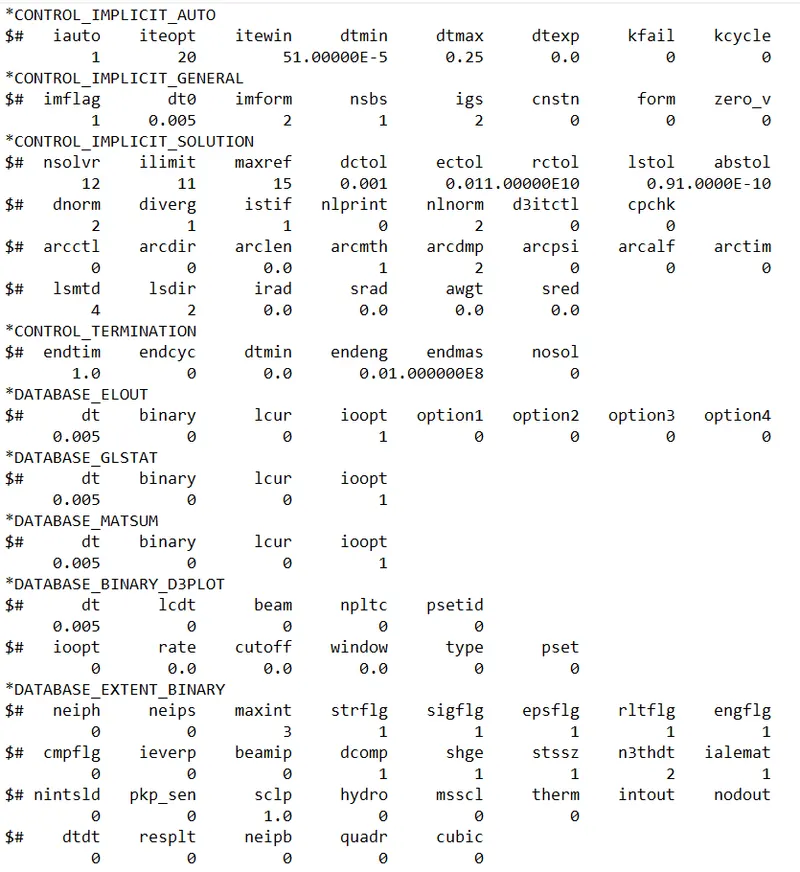
The Control cards, data base cards are created as shown below:
Similarly create another material model Mat_Hyperelastic_rubber and provide the properties as shown below.
Case 1:
HYPER ELASTIC RUBBER:
N= 1
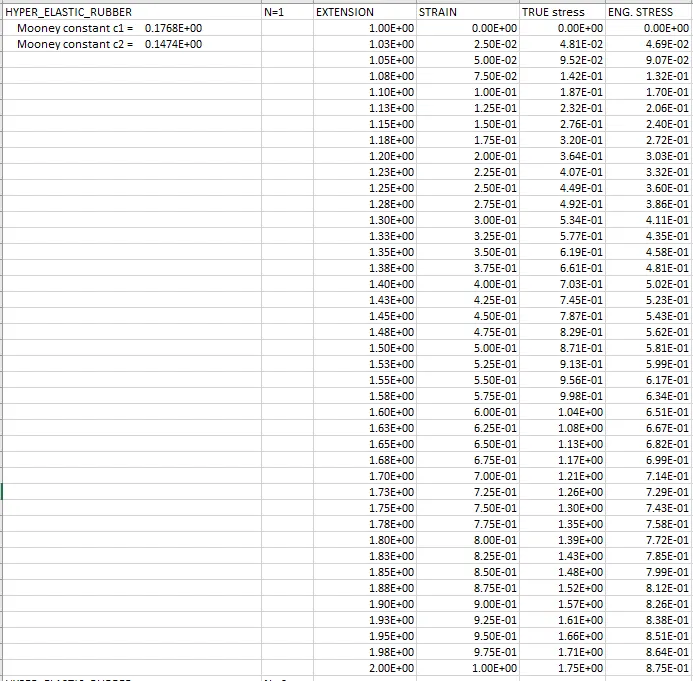
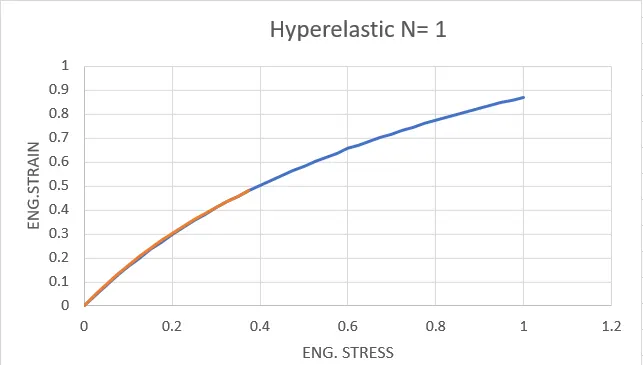
The graph is plotted to see how well the given data converges with the experimental data:
N= 2
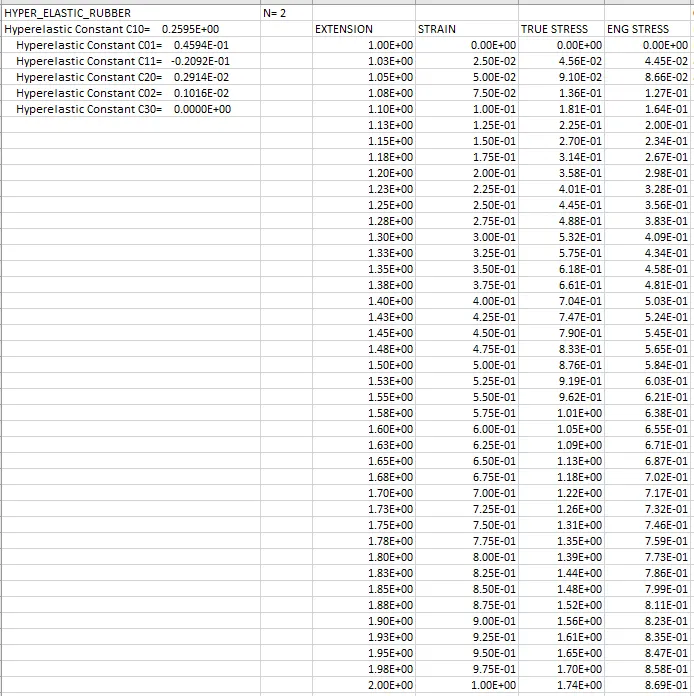
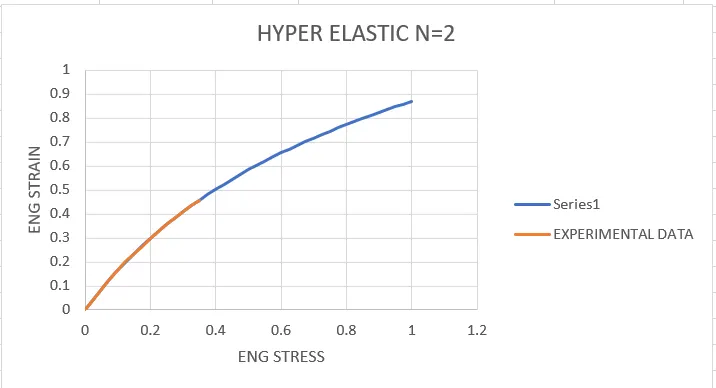
The graph is plotted to see how well the given data converges with the experimental data:
N= 3
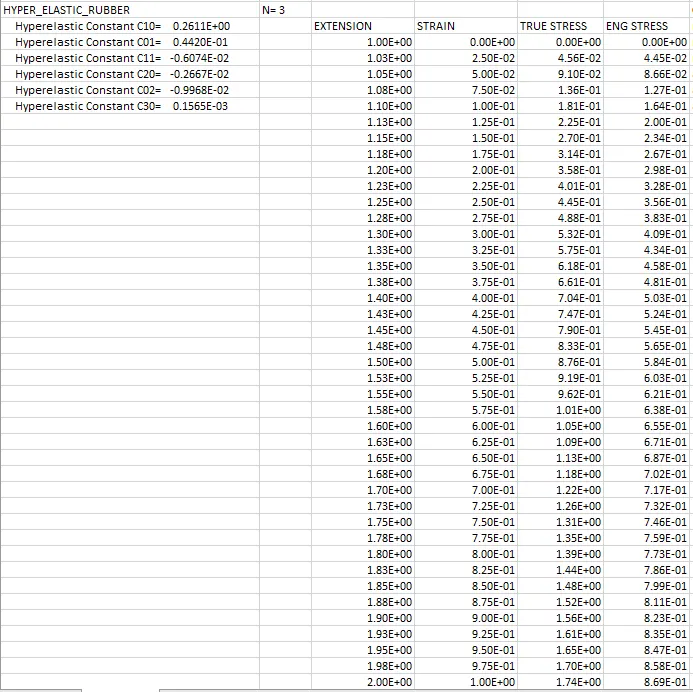
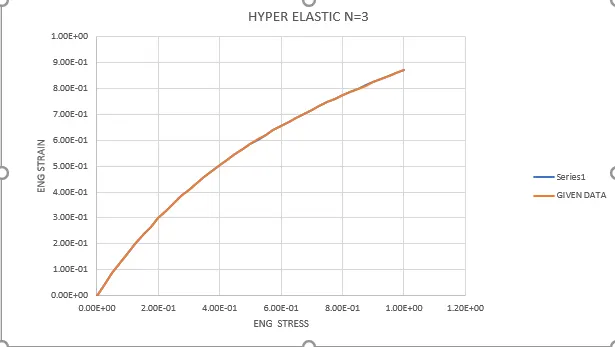
The graph is plotted to see how well the given data converges with the experimental data:
OGDEN RUBBER:
From the d3hsp file we get the stretch values and engineering stress values
N= 1
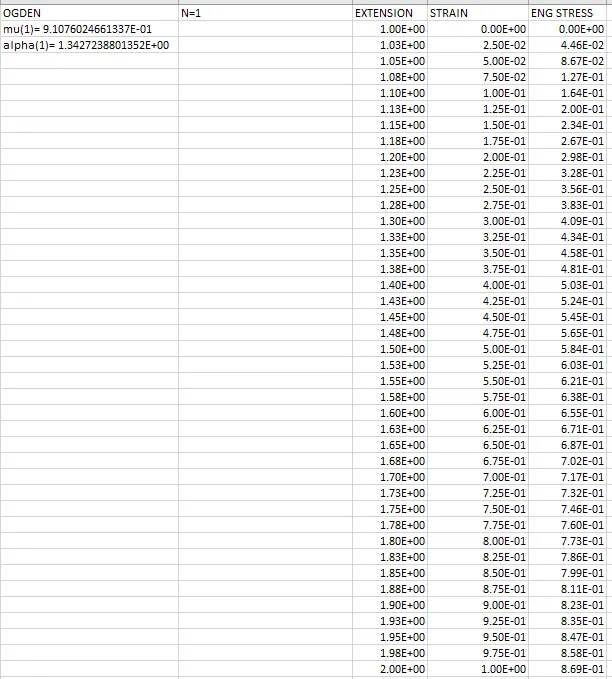
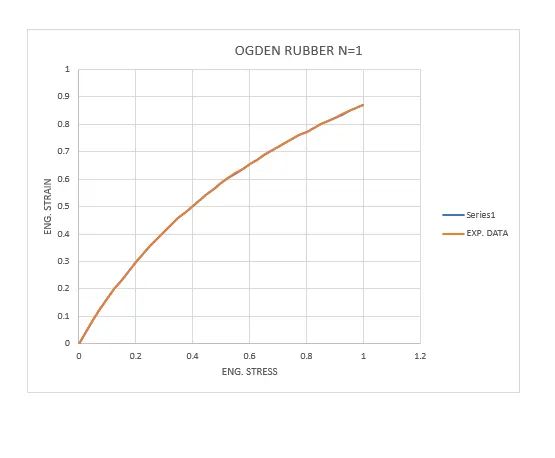
The graph is plotted to see how well the given data converges with the experimental data:
N= 1
N= 2
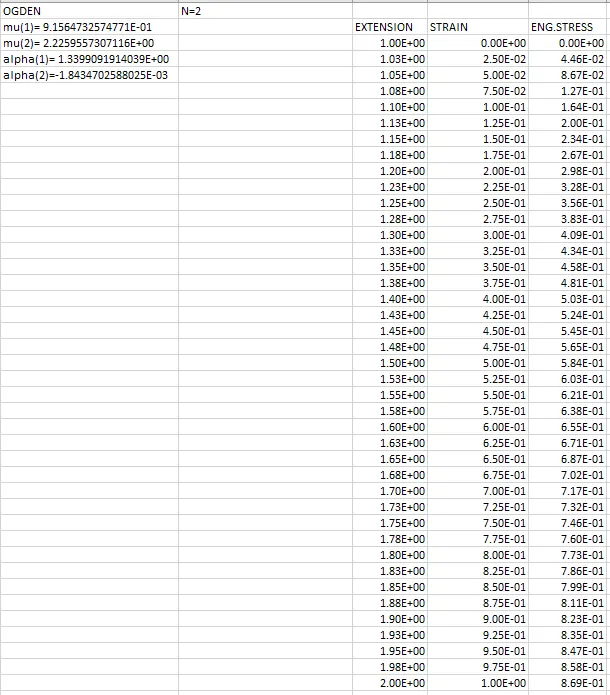
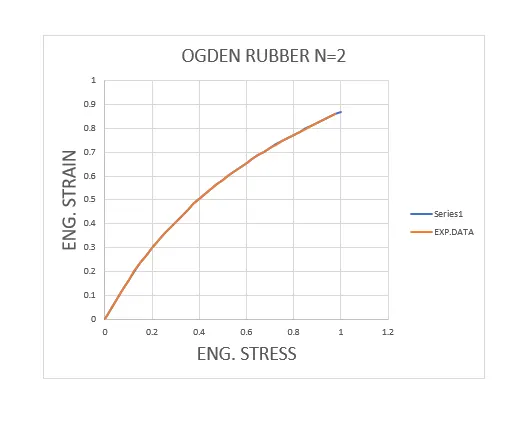
The graph is plotted to see how well the given data converges with the experimental data:
N= 3
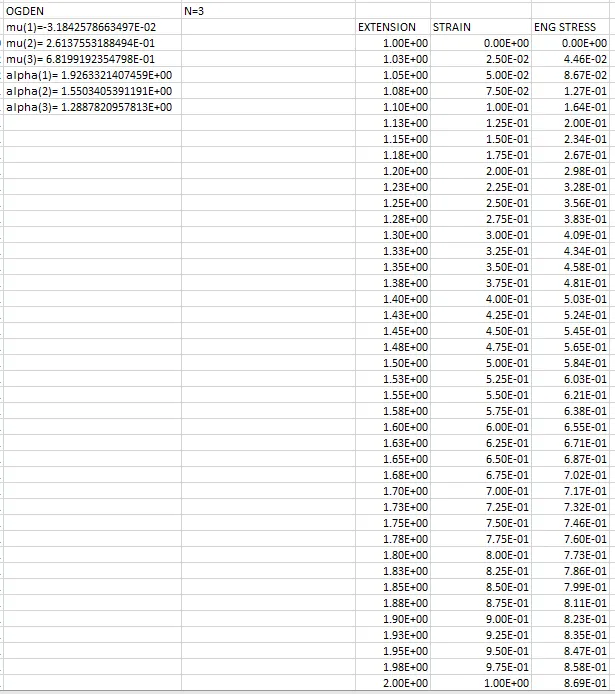
The graph is plotted to see how well the given data converges with the experimental data:
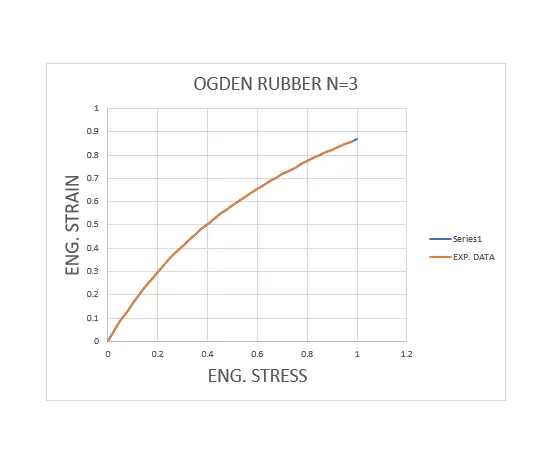
From the above graphs we see that the experimental data covergence is seen increasing with increase in the values of N.
In first case, the data is slightly deviating from the given material curve.
For N= 2, 3 the curve is converging with greater accuracy.
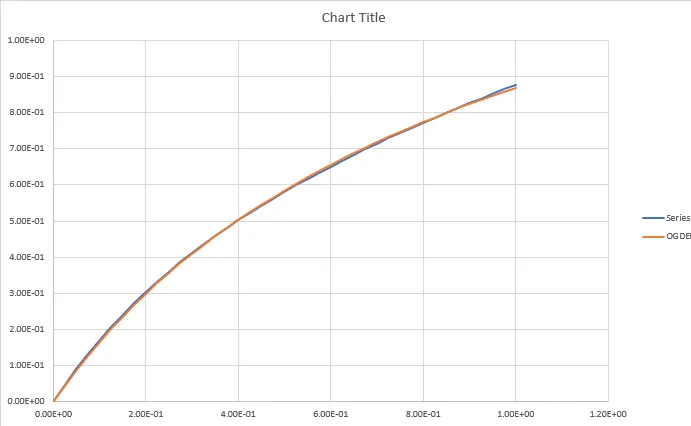
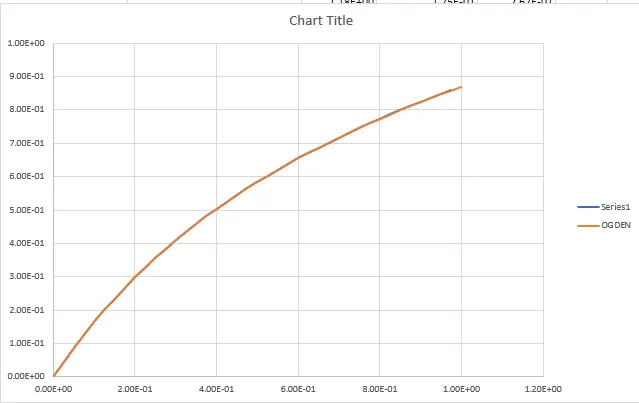
COMPARISION OF PLOTS BETEEN HYPER ELASTIC MODEL AND OGDEN RUBBER MODEL
For N=1
For N=2
For N=3
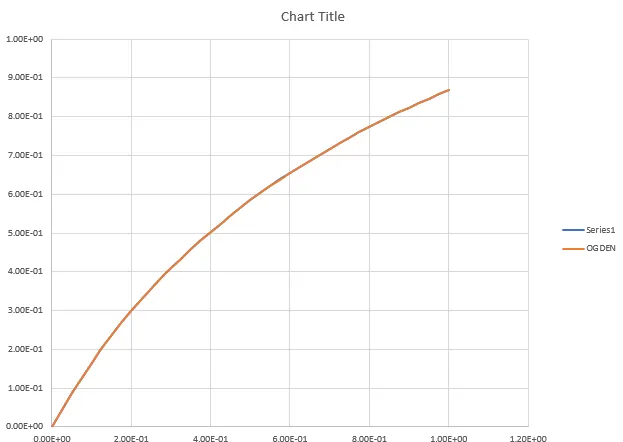
From the above graphs we see that the experimental data covergence is seen increasing with increase in the values of N.
In first case, the data is slightly deviating from the given material curve.
For N= 2, 3 the curve is converging with greater accuracy.
Results:
Ogden rubber
We can see how the stress is varying when a ogden rubber is assigned to the specimen:
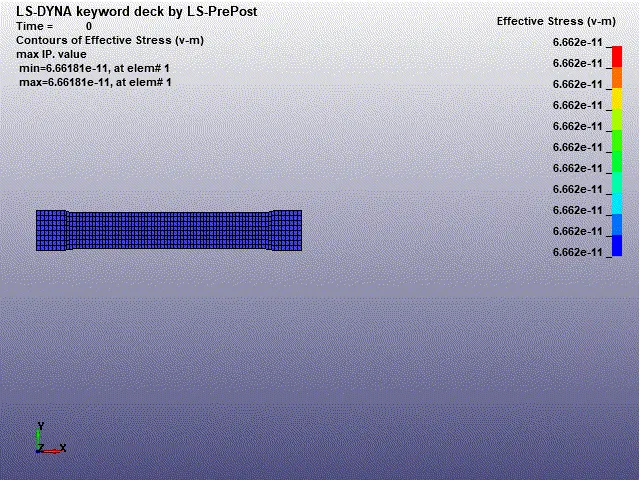
We can see how strain is varying, when a ogden material is assigned to the specimen:
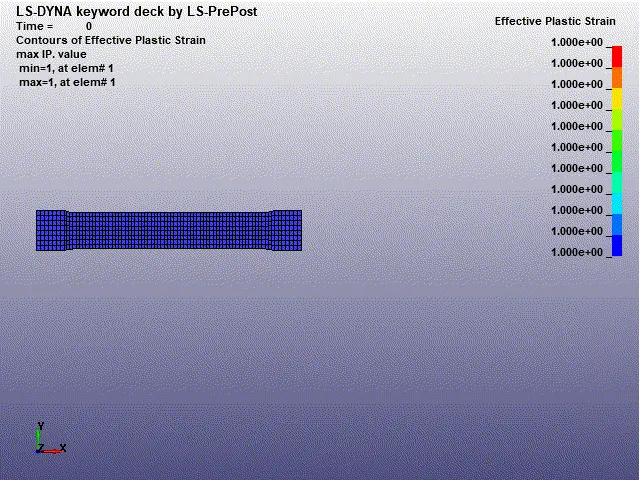
Hyperelastic rubber
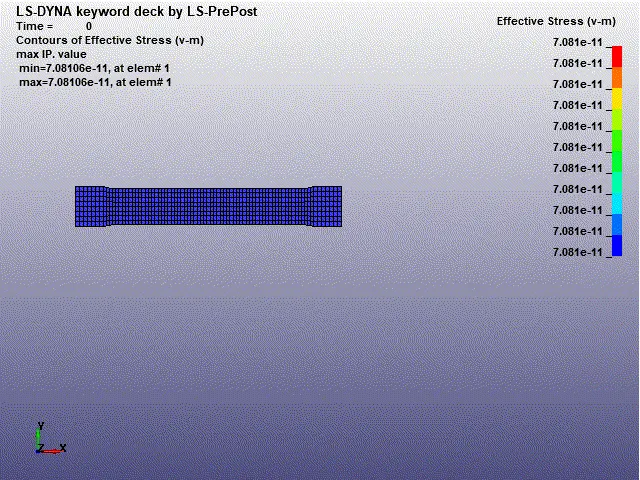
We can see how the stress is varying when a Hyper Elastic rubber is assigned to the specimen:
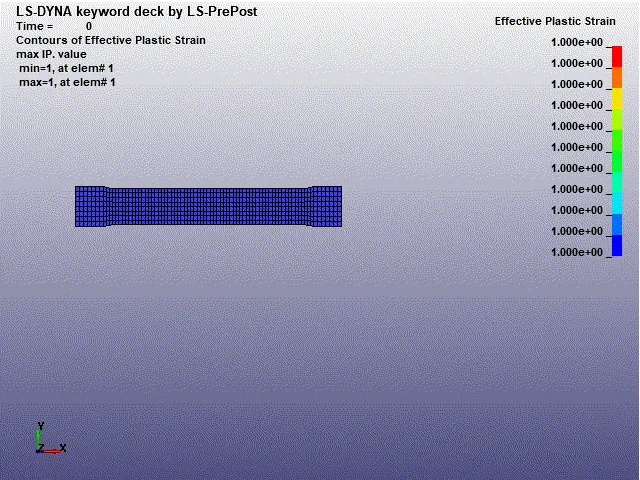
We can see how strain is varying, when a HyperElastic material is assigned to the specimen:
Conclusion:
- Comparision of moony rivlin and ogden material constants are obtained from D3HSP file by inputting the values of N varying from 1 to 3.
- The stretch ratio is obtained from the d3hsp file it is converted into strain by subracting one from that.
- The true stress values from the hyper elastic material is converted into engineering stress:
σ true = σ eng (1+ε.eng)
- The Ogden material d3hsp file gives the stretch and the engineering stress values.
- The simulation results of the tensile test for the both material models with experimental data showed a slight deviation due to high non-linear behaviour of the given hyper elastic materialand the generic values of density and poissons ratio.
- From the simulation, both hyperelastic and ogden models were found to be valid to describe the behaviour of material data.
- The ogden material model has more polynomials ranging from 1 to 8 and is easy to use and gives better adjustment to experimental data at the cost of computational time.
- Learned to verify and validate the hyperelastic material model from the given material data.