Week - 10 Hyperelastic Material Models
Objective :
To calculate the Mooney Rivalan and Ogden constants using the material cards and aslo to compare the stress strain curves.
1. Importh the dogbone specimen and add all keycards.
2. Extract the data of stress and strain values from d3hsp files.
3. Calculate the Engineering stress and strain from the simulation and compare the extracted data from d3hsp and this data using Ms Excel.
Procedure :
1. Import the file of dogbone specimen and start to create the all key cards for the simulation.
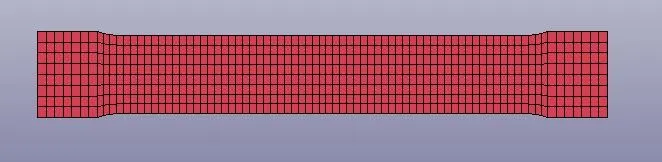
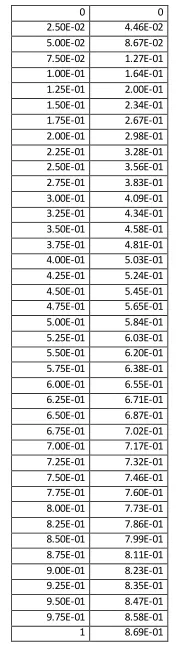
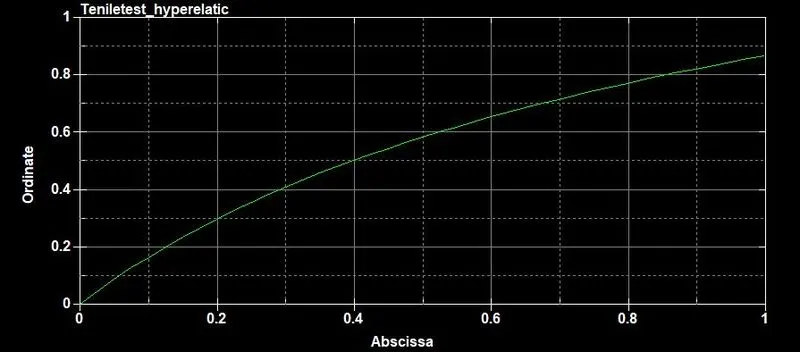
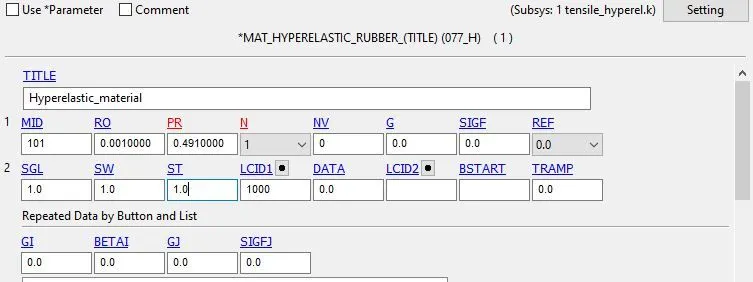
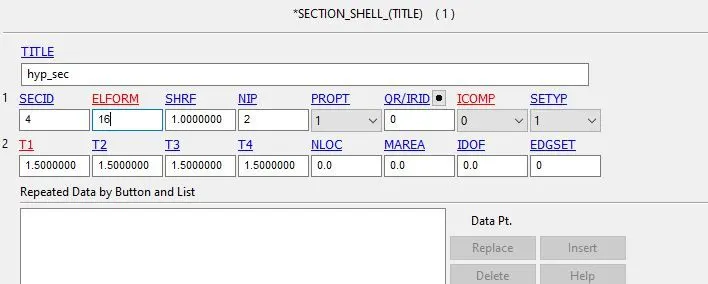
2. Now first we need to create a material card for the model, here we are using the mat 77 hyperelastic and we are keeping 'n' value as 1. N value as 1 because we need to extract the mooney constants and also stress values and define the curve of material. Section shell cards also created and we need to add the sec id and mat id in the part card. We need to define a curve for the material which is given in the form of engineering stress and strain.
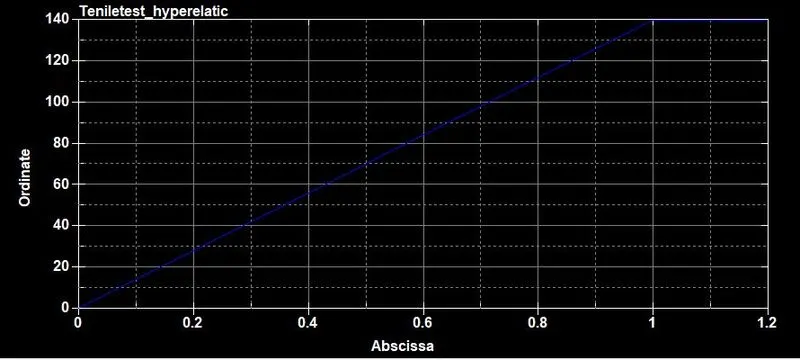
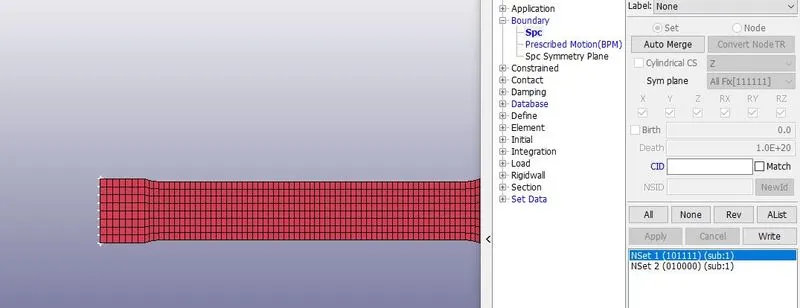
3. After specying part cards we need to add boundary conditions for the model. Here we need to add to two boundary SPC cards and one motion card. For SPC card we need to fix all translations and rotational movements at one side of model and to fix only y- translational mid nodes of model on both sides.
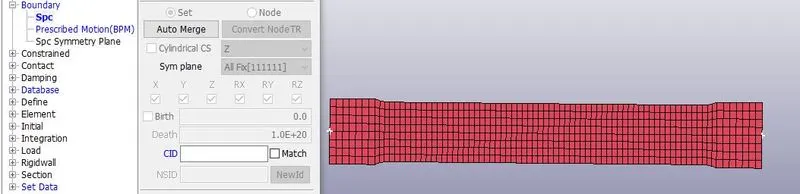
4. For the motion card we need to define displacement card and specify the lcid id and specify the lcid id in the motion card.
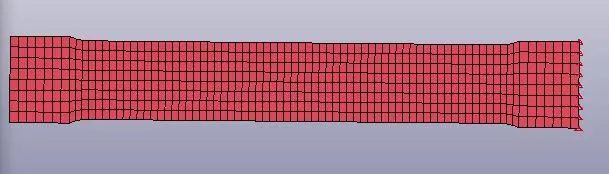
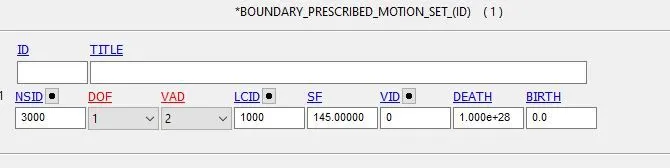
5. We have specified every card except the control card, here we are using control implicit cards for solving the problem.
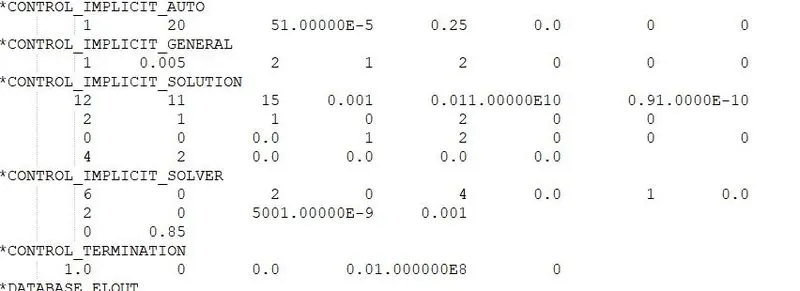
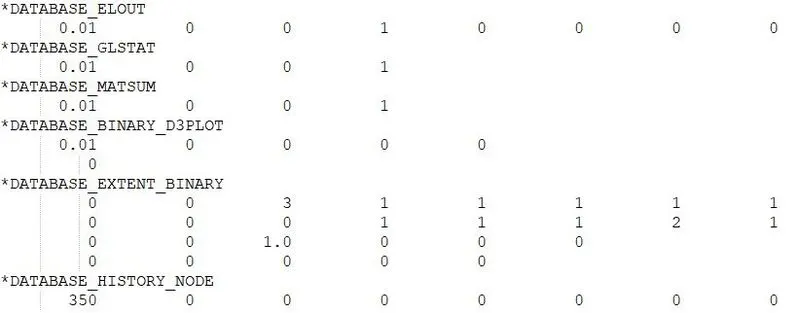
6. Save the card and run the solution in ls manager. Like this we have to do for N2 and N3 Mooney rivalan constants and by keeping the constants in material we need to find simulation stress and strain values. These will be discussed in results and discussion part.
Results & Discussion :
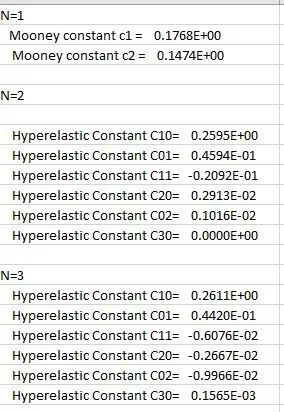
1. After solevr solves with normal termination go to the notepad++ software there we need to open the d3hsp file and here we can find the Mooney constants and also the stretch value and true stress. We extract Mooney constants and also stretch ratio and true stress values and save it in the excel sheet.
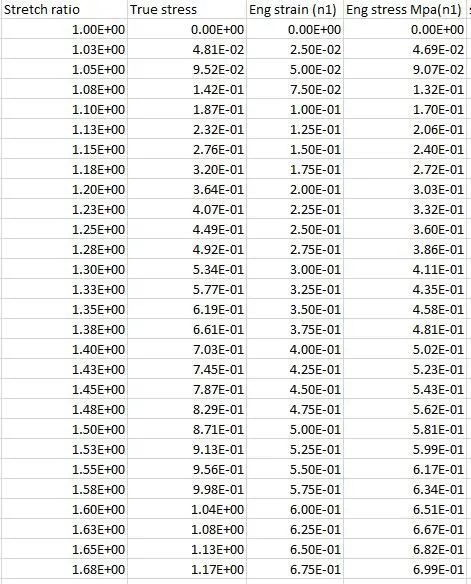
2. In the Ms Excel we need to convert the stretch ratio and true stress into Engineering stress and strain. By using below formulas.
Engineering strain = Stretch ratio - 1
Engineering stress = True stress/(1+Engineering strain)
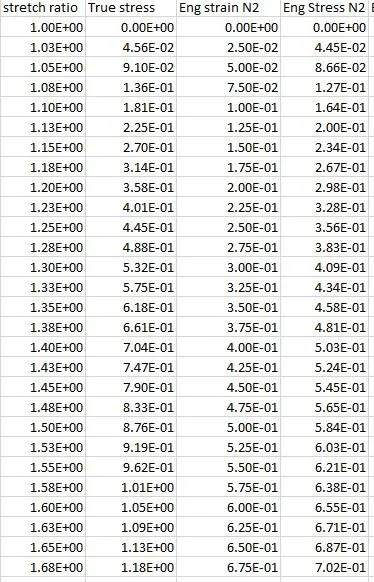
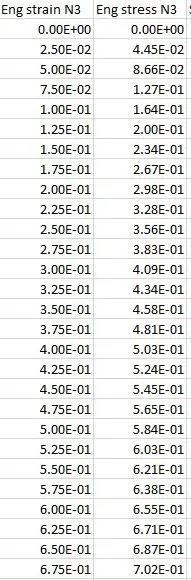
3. After converting we need to compare the values of given Engineer stress - strain values to the extracted stress - strain values by using the plots.
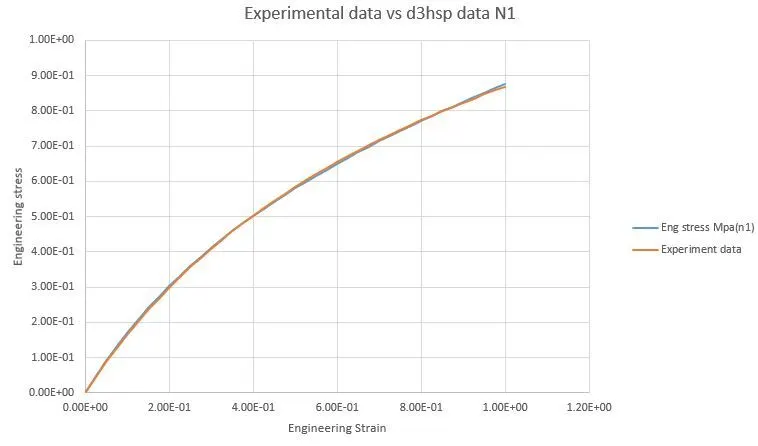
4. Like this we need to find the constants of N2 and N3 and also compare them with given Engineering stress - strain values.
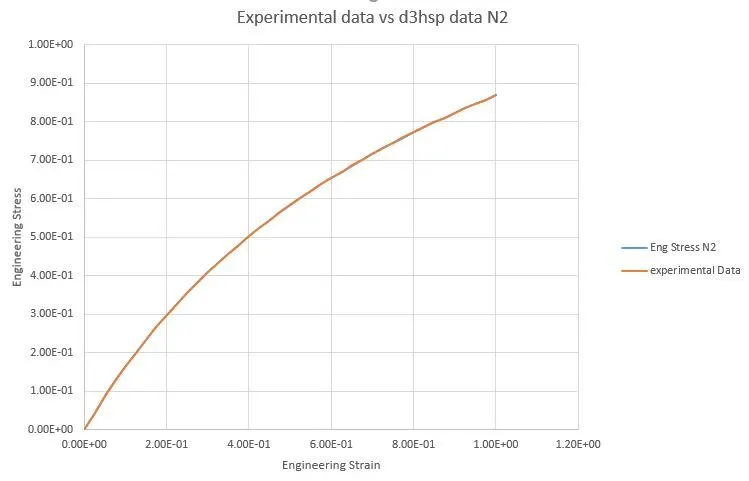
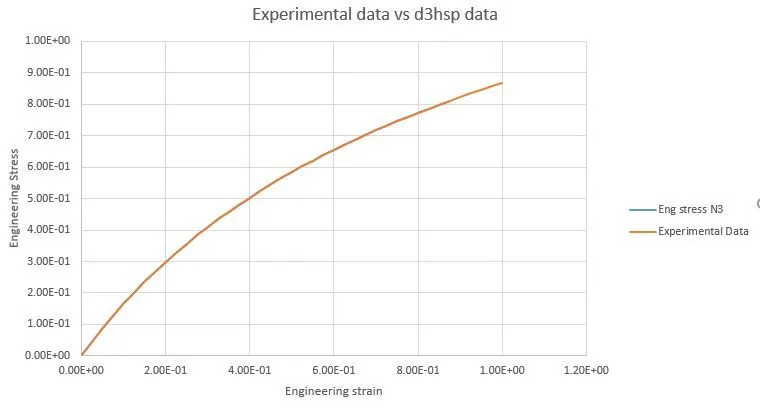
For the plots we can see that all three constant values gives perfect fit stress - strain values for the model.
5. Now we got all Mooney constants, with this each constant N1,N2 and N3 by adding them into material card we need to solve the file again.
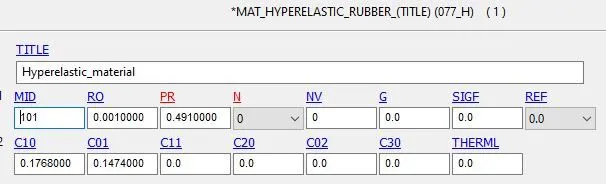
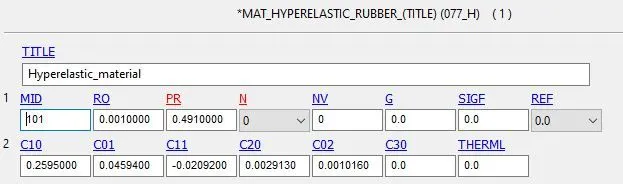
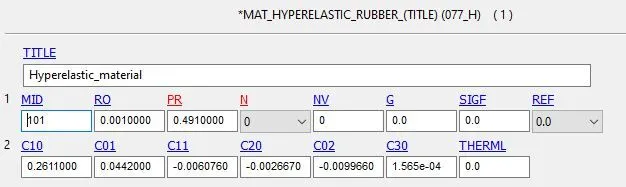
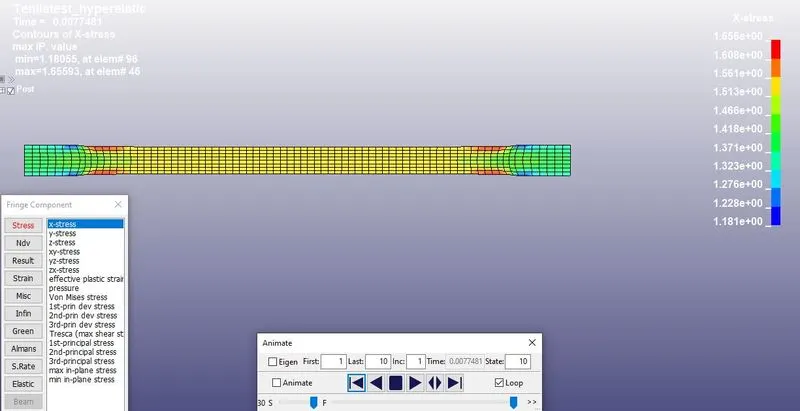
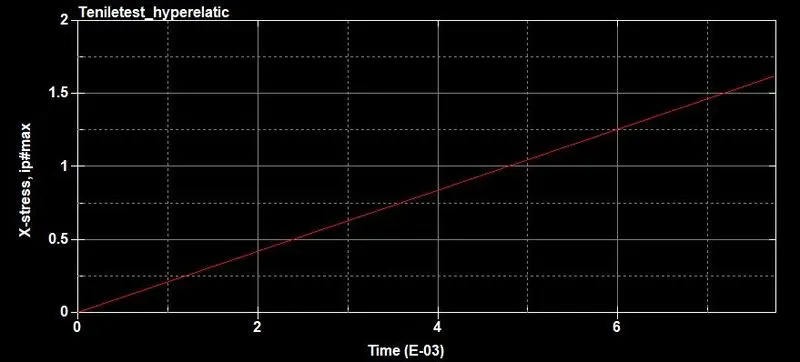
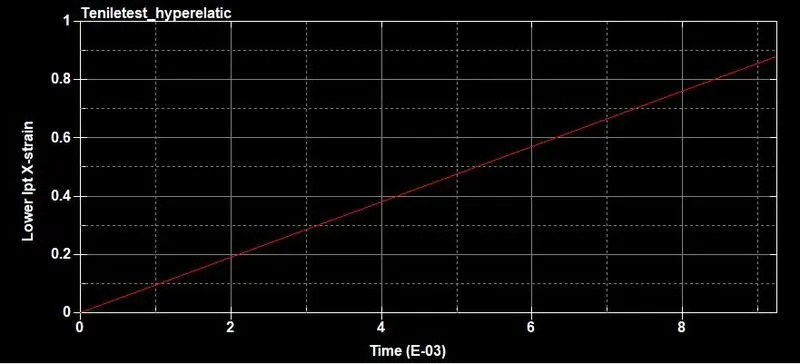
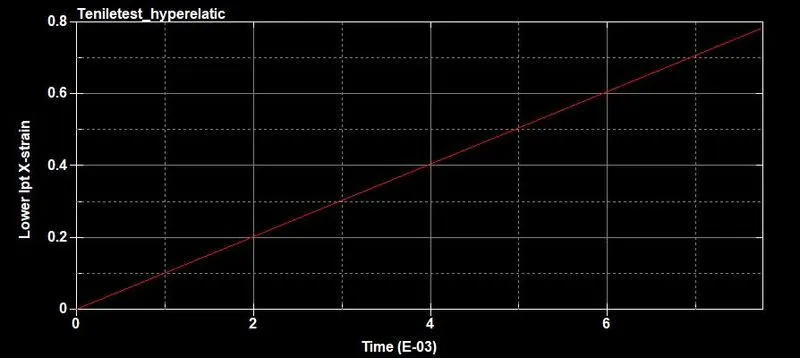
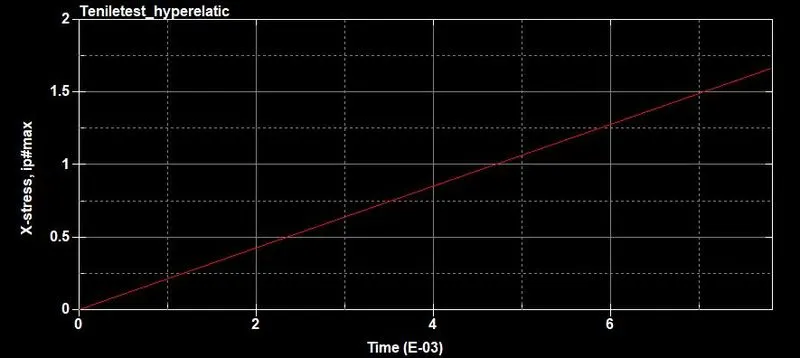
6. After solving open the d3plot and extract the stress and strain values. Go to hist option and select the element and select both x stress and lp int x strain and plot them and svae it as XML file. By saving it as XML file we can get the values directly in Excel sheets. We have to do like this for all three constants.
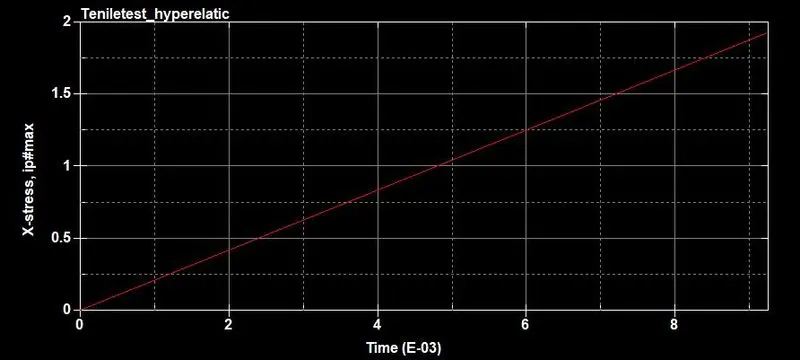
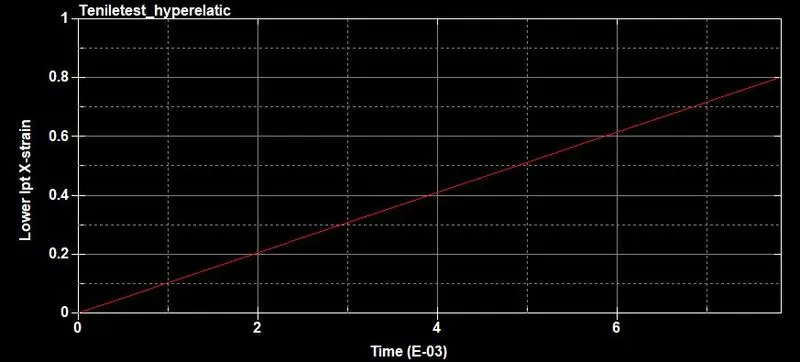
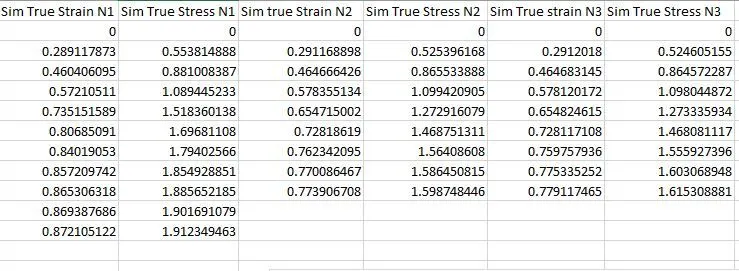
7. Now we got the simulation true stress and strain values but to we need to convert these values into Engineering stress and strain values by using below formulas.
Engineering Strain = Exp(True strain) - 1
Engineering stress = True stress/(1+Engineering strain)
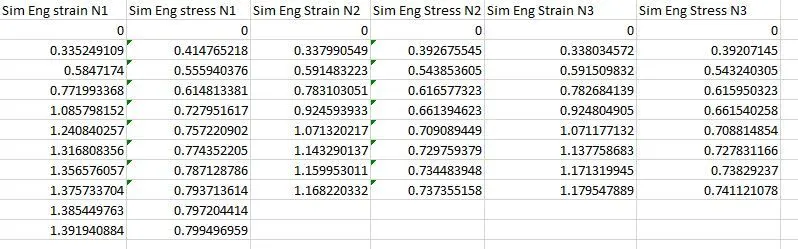
8. After converting them we need to compare with the given Engineering stress and strain values.
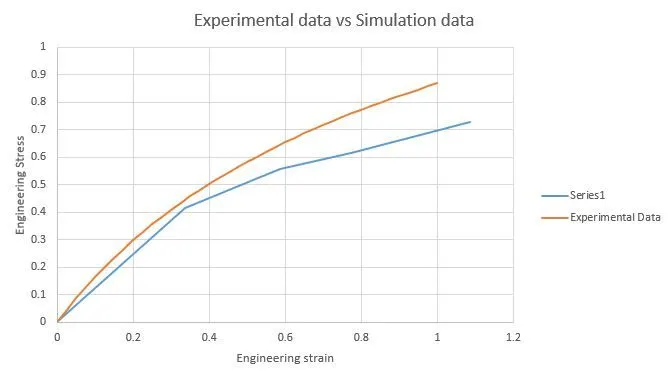
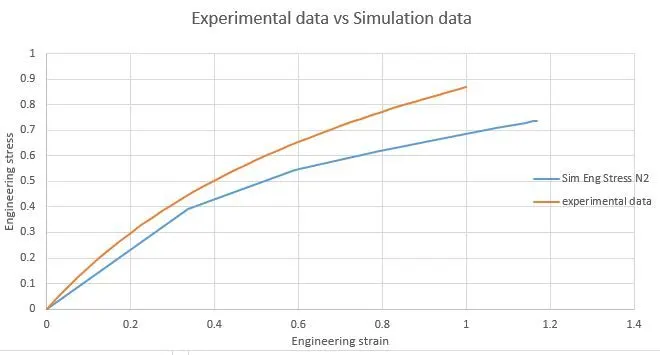
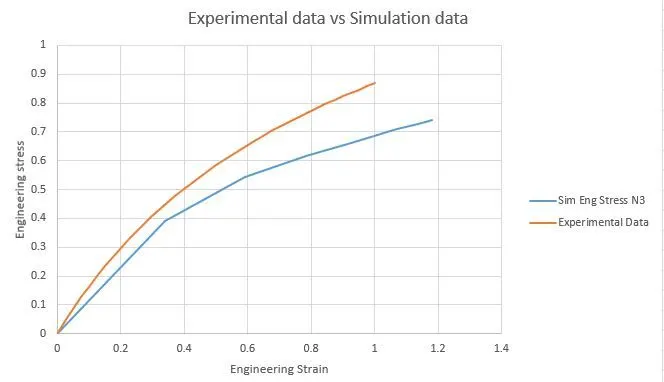
We can see from all three graphs of simulation of mooney constant material stres - strain values is different from the given experimental data this is due to the mooney constant which gives less stress but more strain rate when compare with the experimental data. When we see all three data plots is shows that mooney constant of material card gives more strain rate in the simulation(i.e, higher than 1).
9. Now we got the comparative results of Mooney rivalan but we need to find for Ogden constants and also find the engineering values of stress and strain. We performing same method as Mooney but here instead using hyperelastic we are using Ogden material card.

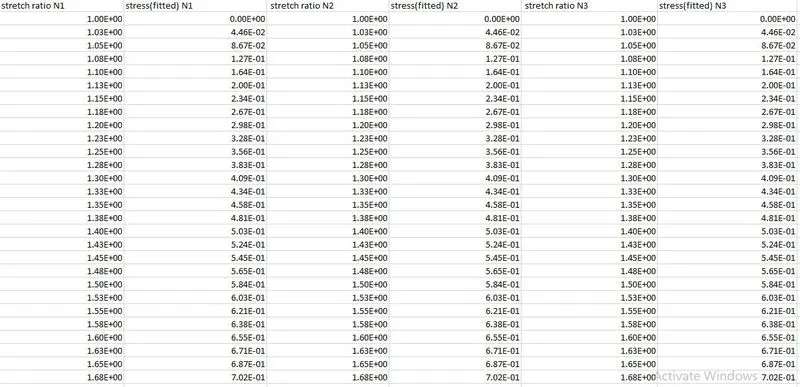
10. After solving the files of N1,N2 and N3 and keep them in material card and again solve them and extract the simulation true stress and strain and convert them into Engineering stress and strain and compare them with given Engineering stress and strain values.
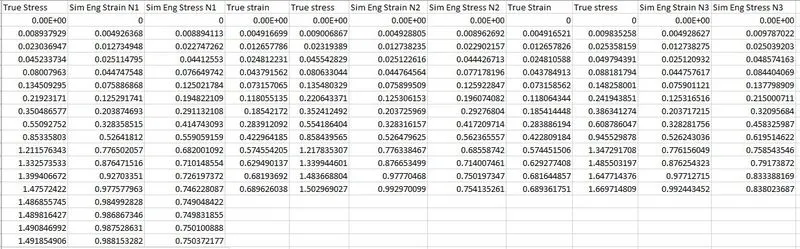
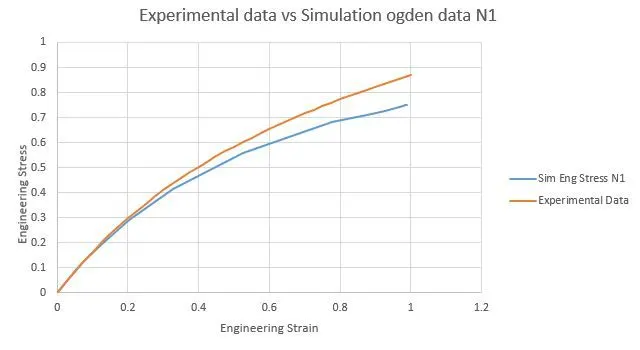
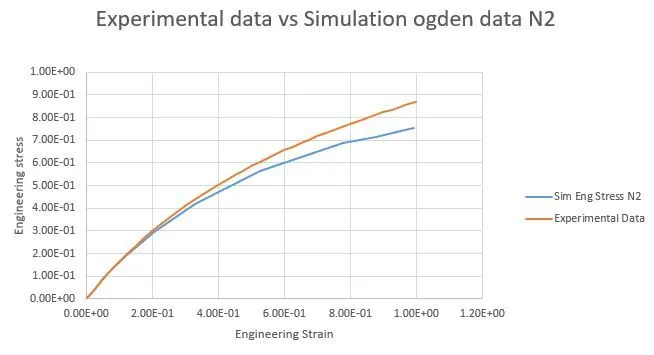
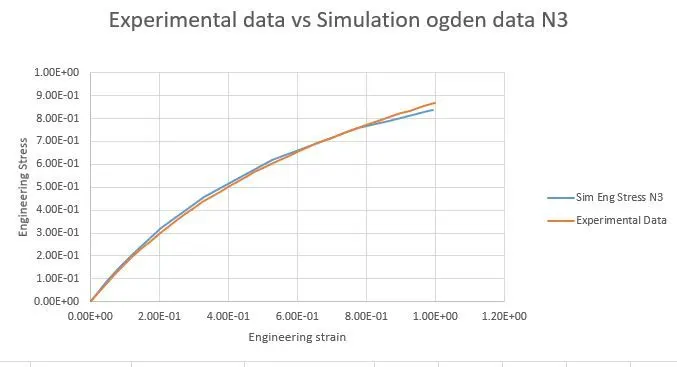
From the plots we can see that both n1 and n2 constants og ogden gives same type of results where the strain rates are same for experimental data and simulation data(i.e, less than 1) but stress is lesser when compare to the experimental data. By increasing the order of ogden material like n3 gives more accurate results, these we can see in the plot where both data has same graphical representation.
Conslusion :
Thus we have model the mooney rivalan material card and ogden crad and with these card we have performed tensile test and compared the results of experimental data with the simulation data and we can conclude that ogden material which has higher order gives accurate results when compare to the mooney rivalan constants.