Week - 10 Hyperelastic Material Models
Aim: The given material data is used to calculate Mooney-Rivlin and Ogden material constants and compared Both with the stress Vs strain curves.
Observation:
The given material data is used to calculate Mooney-Rivlin and Ogden material constants and compared Both with the stress Vs strain curves of dog bone specimen tensile test with 100% strain. Since the given material curves are in engineering stress and strain form, the results of true stress and strain obtained from the simulation are converted to engineering stress and engineering strain and compared with the Ogden and Mooney-Rivlin stress Vs strain results. The hyper elastic Rubber will be having large strain therefore we can use it in terms of stress to strech ratio rather than strain unlike in ductile material where we use young's modulus to define the material, use the strain energy density to define hyperelastic material.
Procedure:
The given material data is taken and filled in form of the excel sheet data in CSV form.
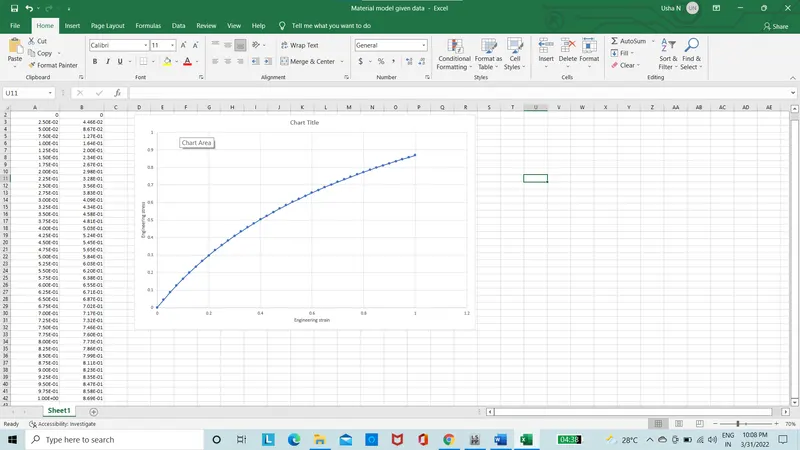
Figure 1: Given data into excel sheet
The dog bone specimen is opened in the Ls-dyna software.
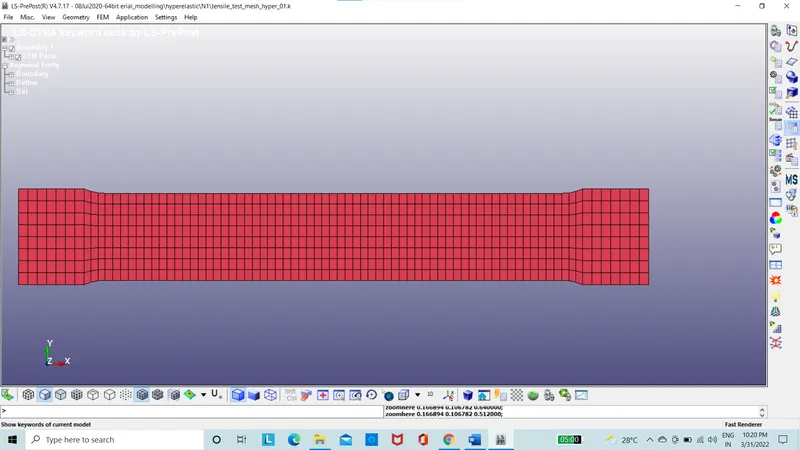
Figure 2: Dog bone specimen
The dog bone specimen is now input with the given material curve data by using the define option.
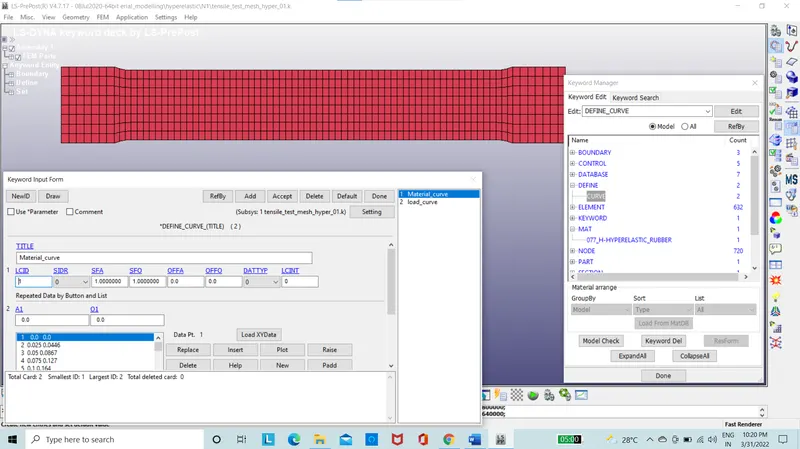
Figure 3: Material data Curve
The section of the dog bone specimen is provided with thickness of 2mm
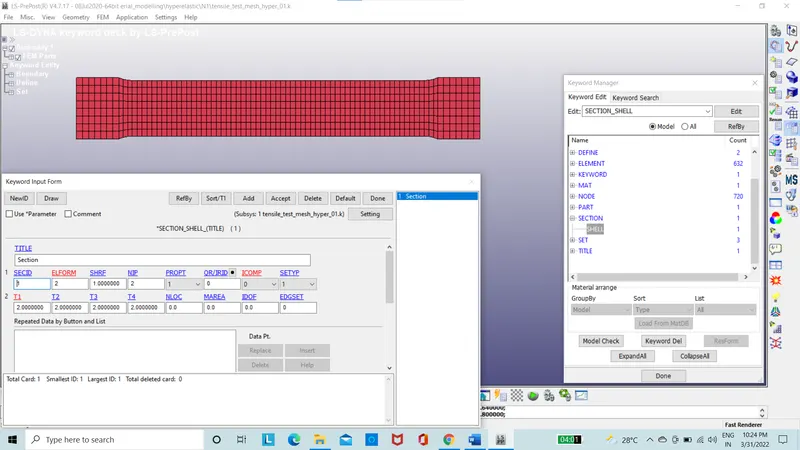
Figure 4: Section Card
The material card is assigned using the 077_Hyperelastic Rubber card which will give the Mooney-Rivlin Constants, using the LCID1 curve set SGL, SW, ST to be 1 with the order of the polynomial N is set to 1.
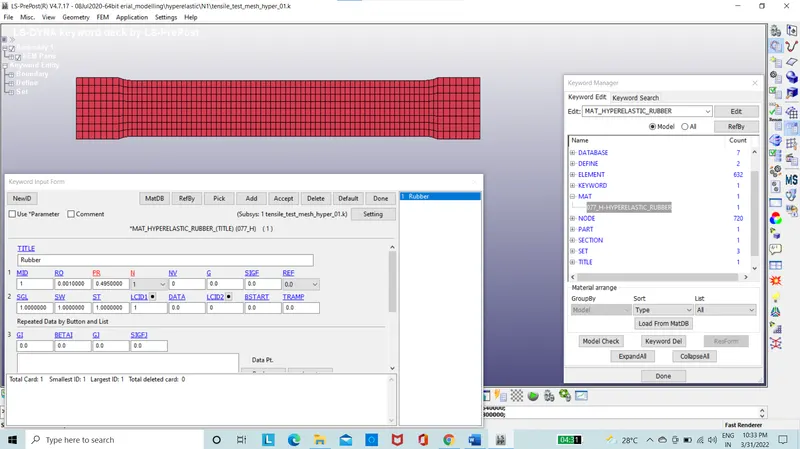
Figure 5: Mat_077_Hyperelastic Rubber card
The part is set with section ID and the Material ID.
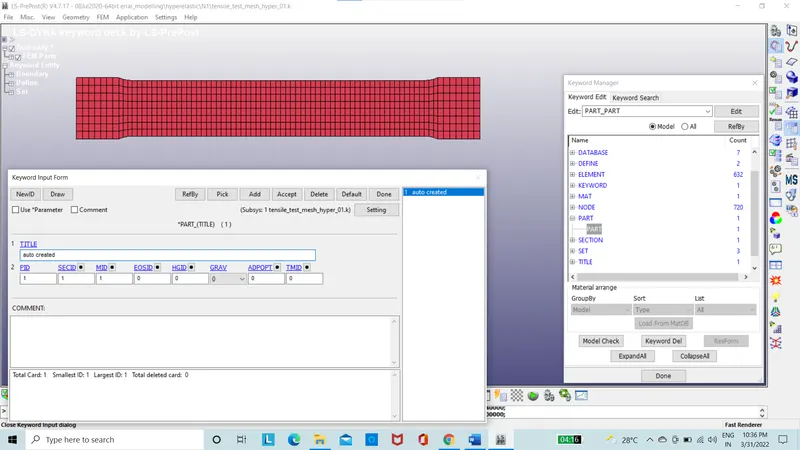
Figure 6: Part ID
The Boundary condition are assigned with the SPC set.
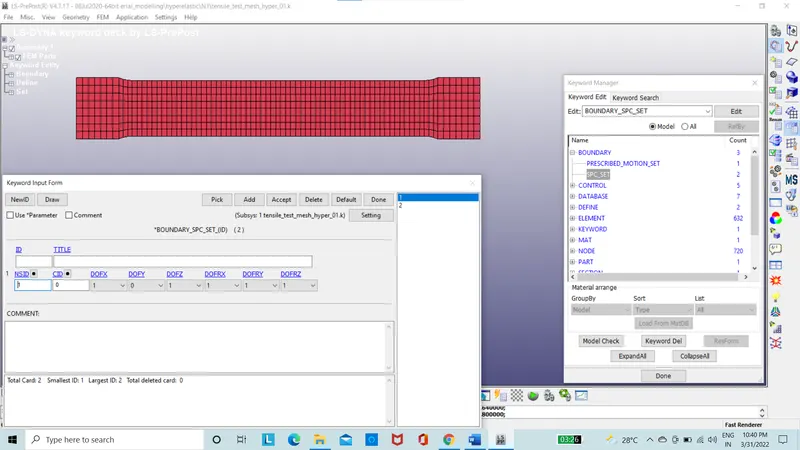
Figure 7: Fixed boundary condition
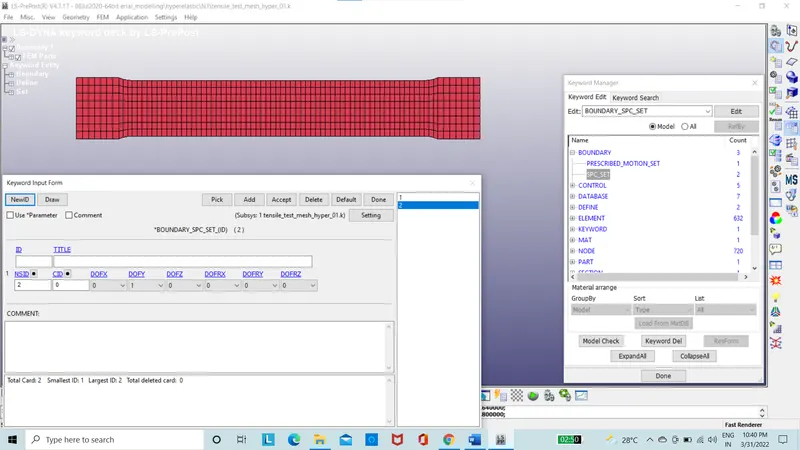
Figure 8: Y-direction is constrained
The displacement boundary condition is set using the prescribed boundary condition which is set for scale factor as 148mm as given condition for 100% strain.
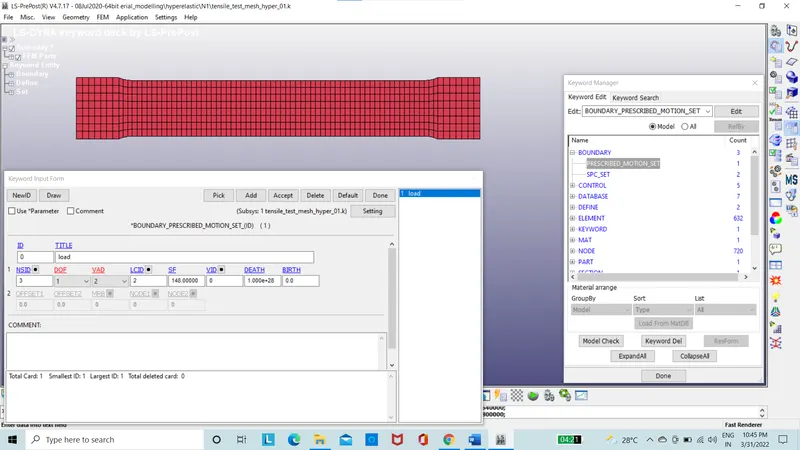
Figure 9: Prescribed Motion set Card
The implicit analysis is selected for this type of simulation where it is stable, tensile test analysis which will be faster compared with explicit analysis.
The implicit analysis is set using cards of implicit auto, implicit general, implicit solution, implicit solution, termination in control option.
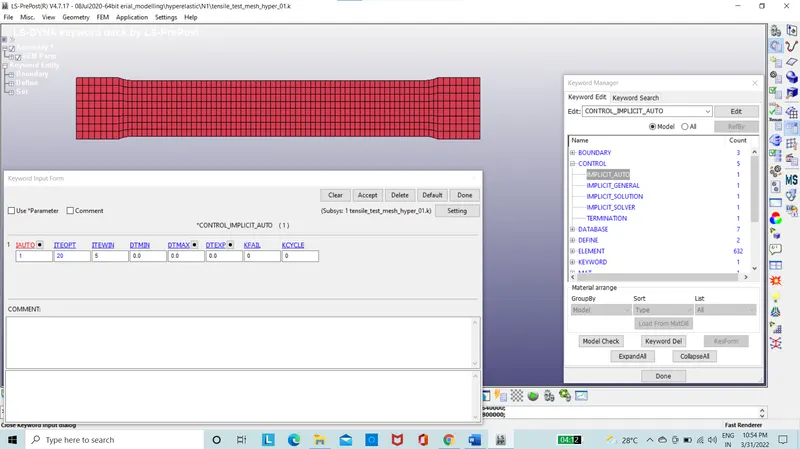
Figure 10: Implicit Auto
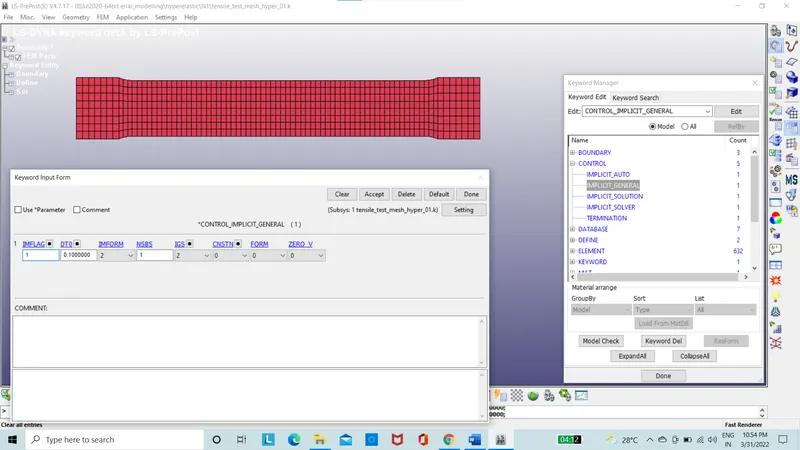
Figure 11: Implicit general
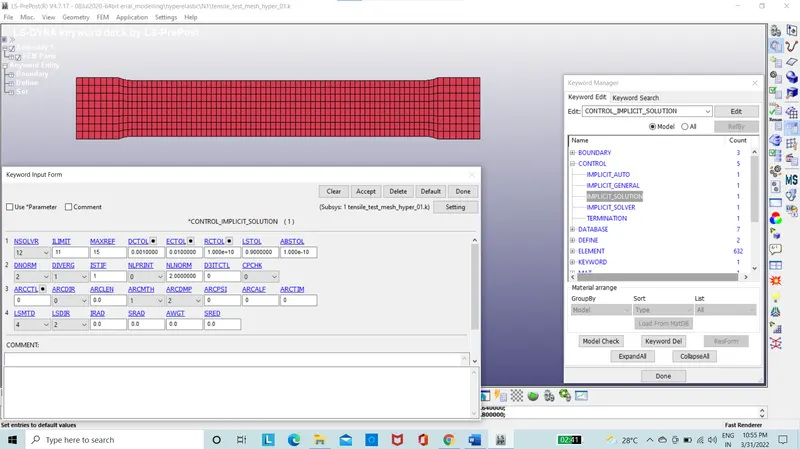
Figure 12: Implicit solution
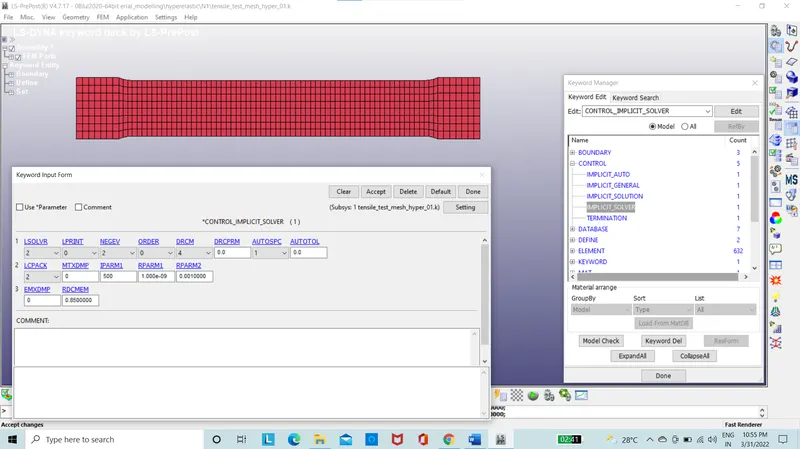
Figure 13: Implicit solver
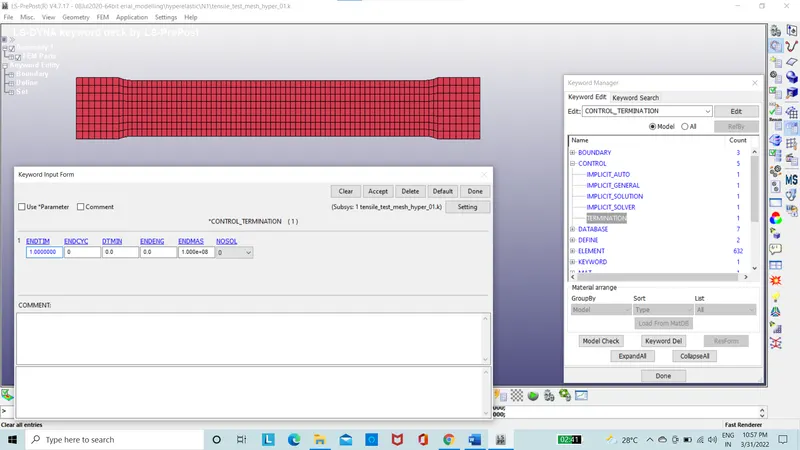
Figure 14: Termination
The database option has to activate the ASCII option, D3PLOT, Extent Binary is set to 1.
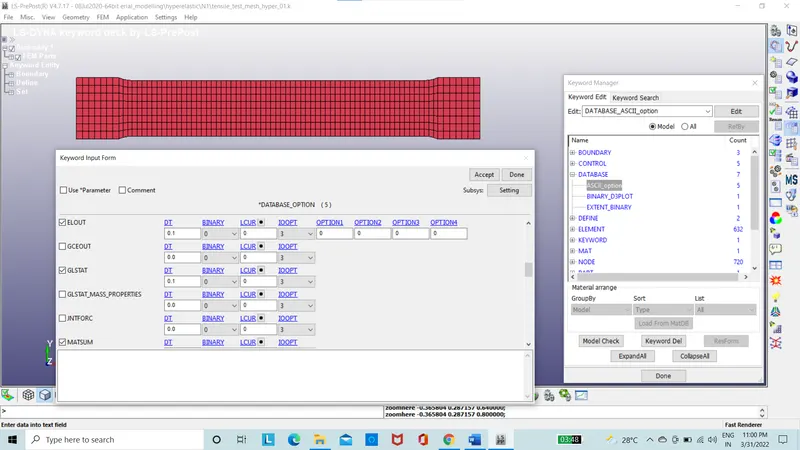
Figure 15: ASCII Option
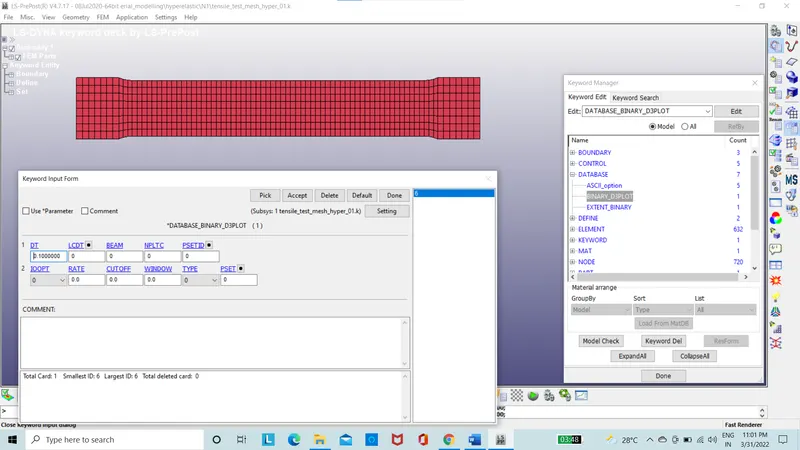
Figure 16: D3 PLOT
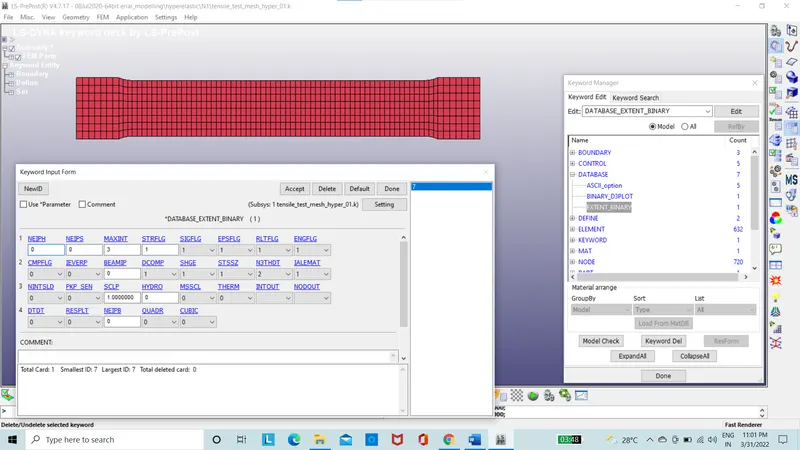
Figure 17: Extent Binary
The file is saved and the simulation is run. The results of the constants are noted down using the d3hsp file in Notepad++.
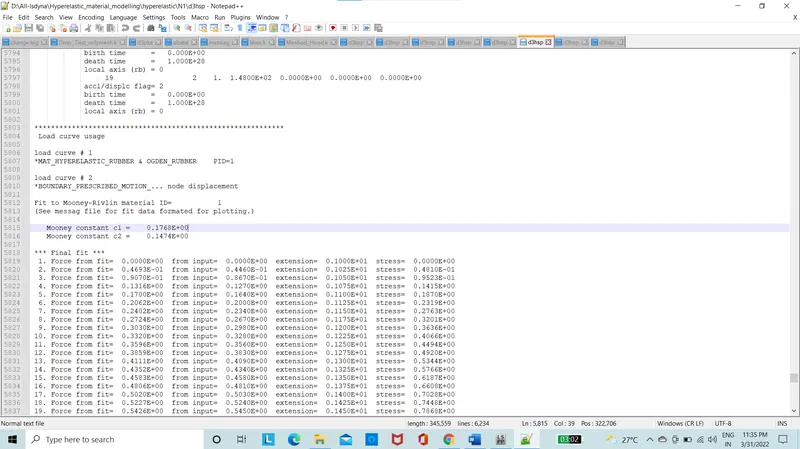
Figure 18: Mooney constants
The Mooney constants C1 and C2 is obtained are then input into material card into the A and B option in the 027 Mooney Rivlin Rubber Card.
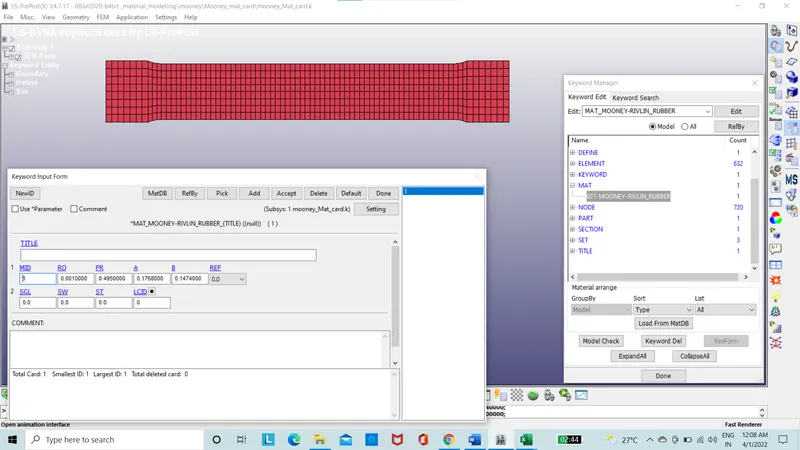
Figure 19: 027 Mooney Rivlin Rubber Card
The file is saved and run. The true stress and true strain are obtained.
True strain is convered to engineering strain by using the formulae
True strain= ln(Engineering strain+1)
Engineering strain= Exp(true strain)-1
True stress is convered to engineering stress by using the formulae
True stress= Engineering stress(1+Engineering strain)
Engineering stress=true stress/(1+Engineering strain)
The same procedure is followed for the Ogden material card by replacing the card even with same boundary conditions. The material card is assigned using the 077_Ogden Rubber card which will give the Constants mu and alpha, using the LCID1 curve and set SGL, SW, ST to be 1 with the order of the polynomial N is set to 1.
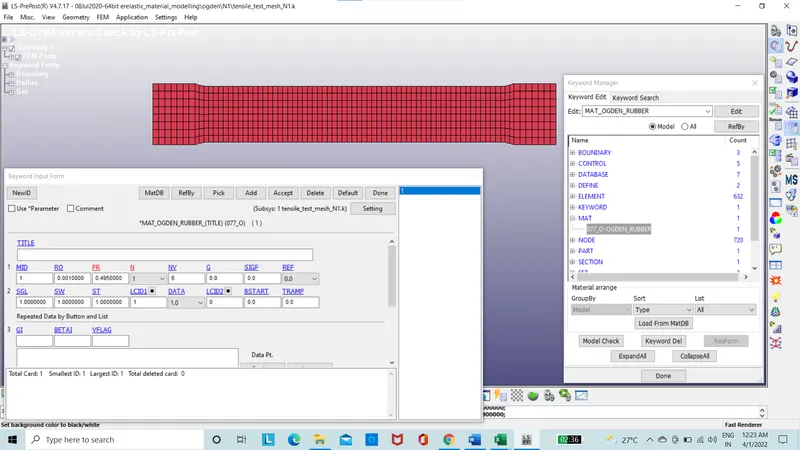
Figure 20: 077 Ogden material card
The material card is now assigned with more polynomials by changing the N= 3, 5.
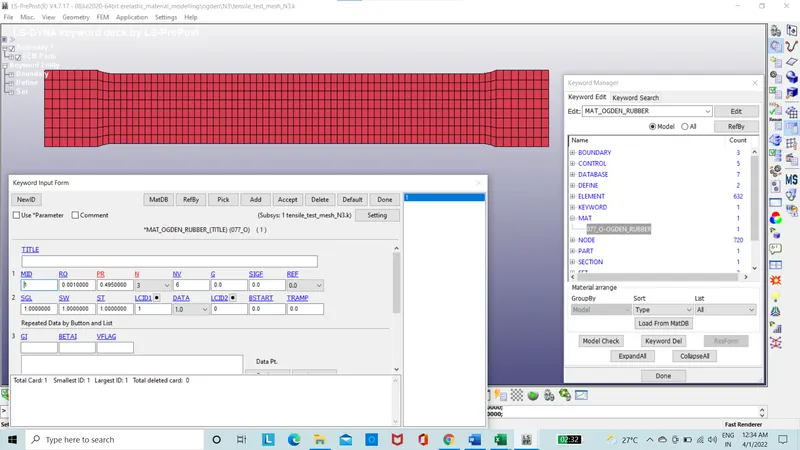
Figure 21: 077 Ogden material card with N=3
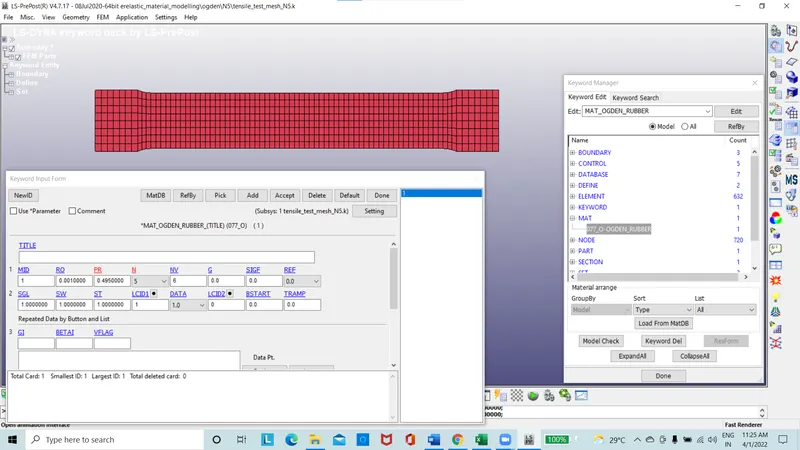
Figure 21.1: 077 Ogden material card with N=5
The files are saved individually and run to obtain the value of the constants. The value of mu and alpha are then input in N=0.
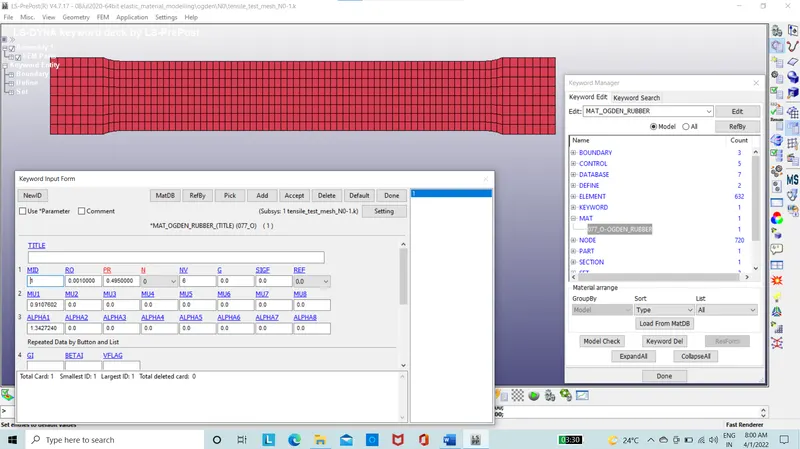
Figure 22: 077 Ogden material card with N=0 for mu1 and alpha1
Subsequently, mu and alpha obtained from N=3 and N=5 are input into the Ogden material card with N=0.
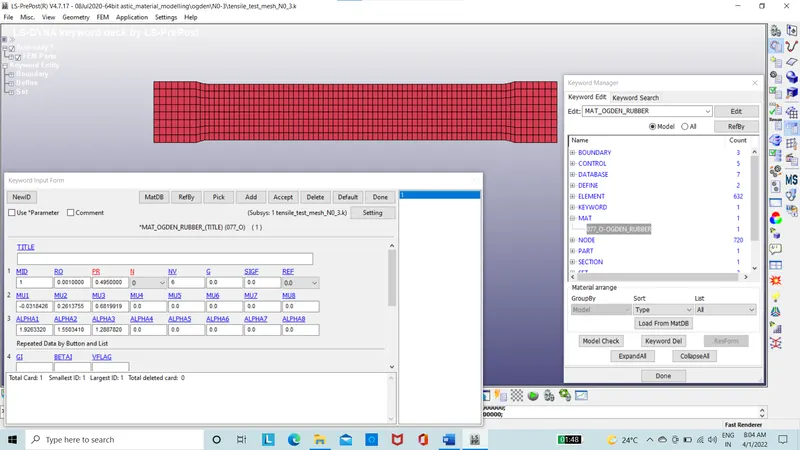
Figure 23: 077 Ogden material card with N=0 for mu1-3 and alpha1-3
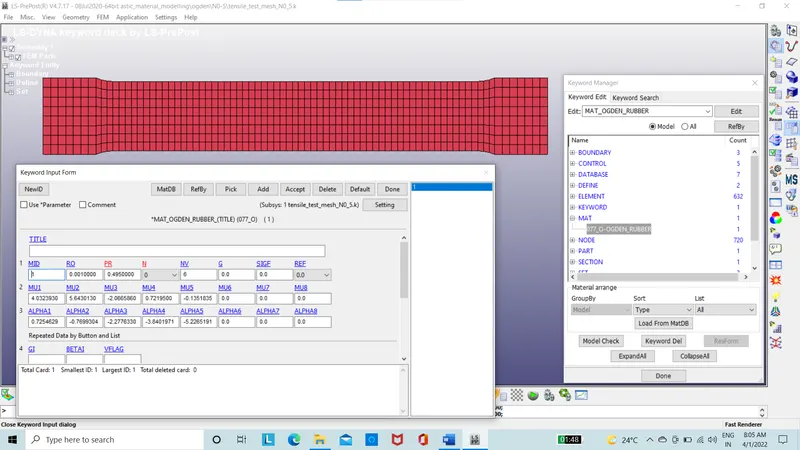
Figure 24: 077 Ogden material card with N=0 for mu1-5 and alpha1-5
The files are saved individually and run to obtain the stress Vs strain curve.
Results:
The stress contour of the Mooney-Rivlin model is compared with Ogden model in X-direction stress.
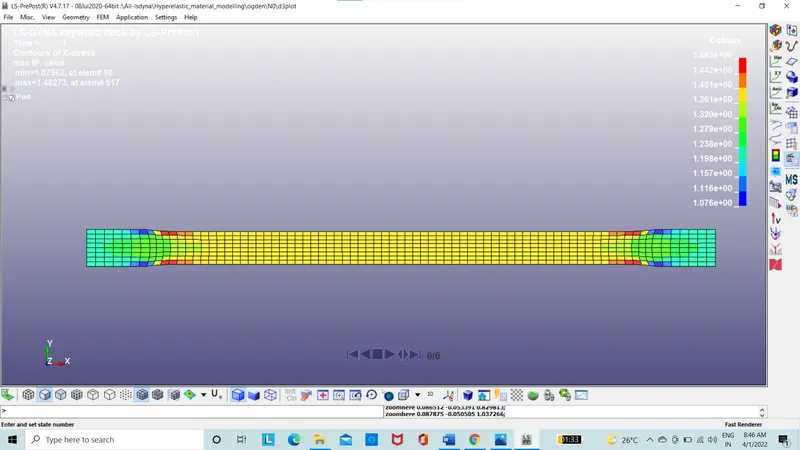
Figure 25: Stress Contour for the Mooney-Rivlin model
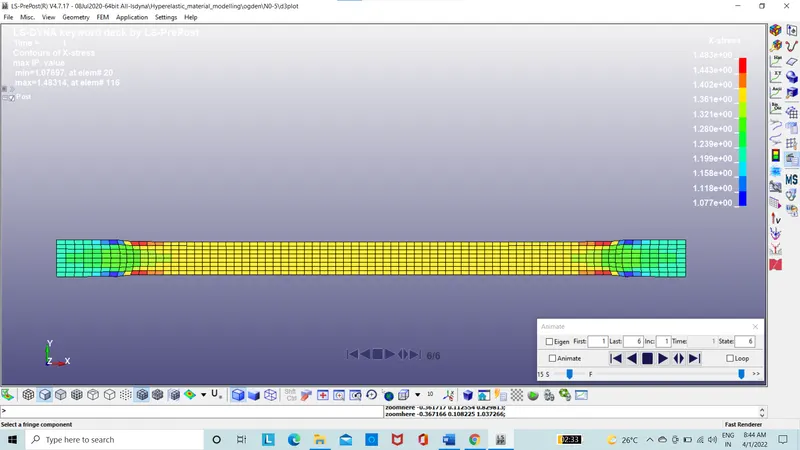
Figure 26: Stress Contour for the Ogden model for mu1 and alpha1
Here, the value of stress in the Mooney Rivlin and the Ogden Material are both same of 1.483 Mpa.
The strain contour of the Mooney-Rivlin model is compared with Ogden model in Lower Ipt strain.
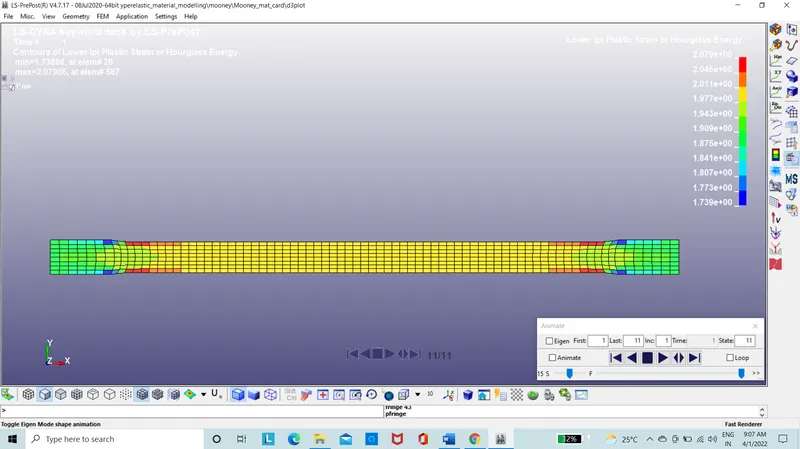
Figure 27: Strain Contour for the Mooney-Rivlin model
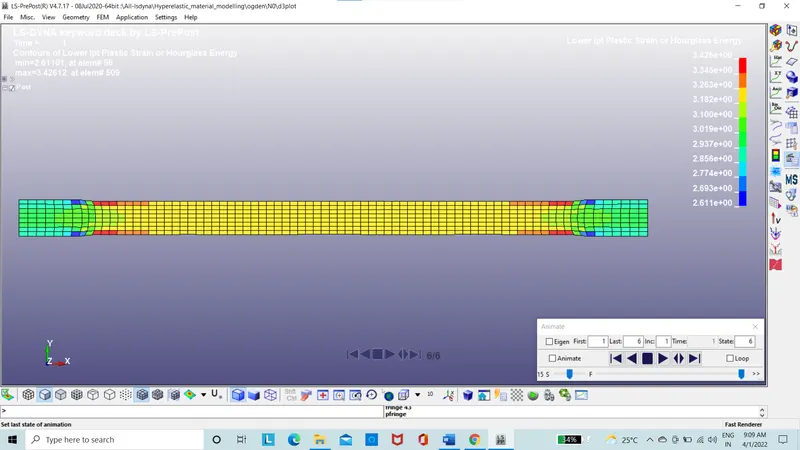
Figure 28: Strain Contour for the Ogden model for mu1 and alpha1
Here, the value of strain in the Mooney Rivlin is 2.07 and the Ogden Material is 3.426
The model of Mooney-Rivlin true stress and true strain obtained from simulation is converted to engineering stress and engineering strain is compared to the given experimental data which is in engineering stress and strain.
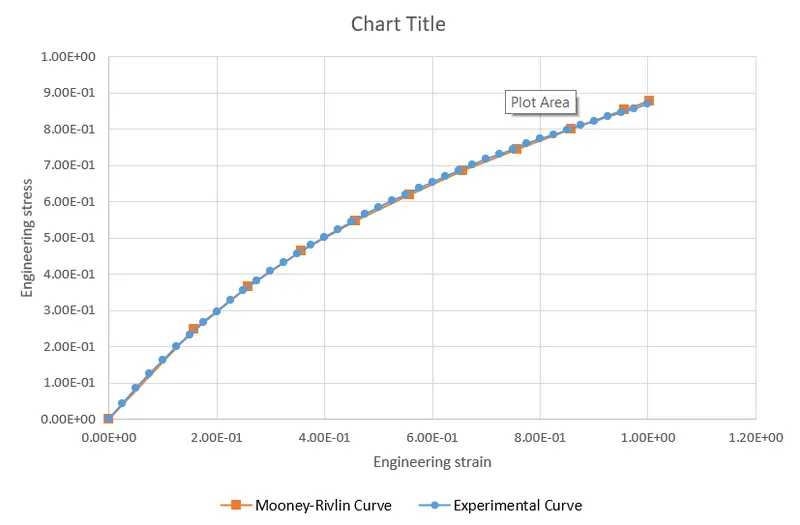
Figure 29: Comparison of Experimental data with Mooney Rivlin curve in graph
It is observed, the Curve of Mooney-Rivlin and experimental data given both overlap each over and the curve fit is also perfect and therefore, the material validation is complete.
The model of Ogden true stress and true strain obtained from simulation for mu1 and alpha1 is converted to engineering stress and engineering strain is compared to the given experimental data which is in engineering stress and strain.
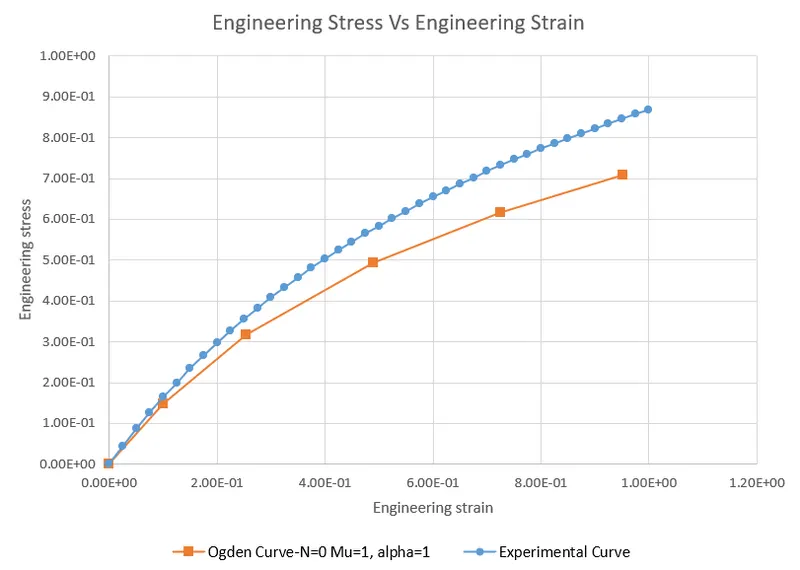
Figure 30: Comparison of Experimental data with Ogden curve in graph
The model of Ogden true stress and true strain obtained from simulation for mu1-3 and alpha1-3 is converted to engineering stress and engineering strain is compared to the given experimental data which is in engineering stress and strain.
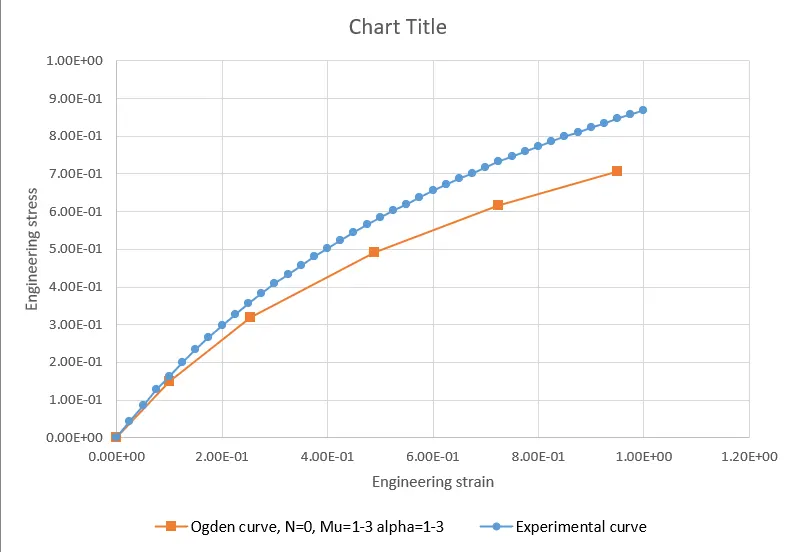
Figure 31: Comparison of Experimental data with Ogden curve in graph
The model of Ogden true stress and true strain obtained from simulation for mu1-5 and alpha1-5 is converted to engineering stress and engineering strain is compared to the given experimental data which is in engineering stress and strain.
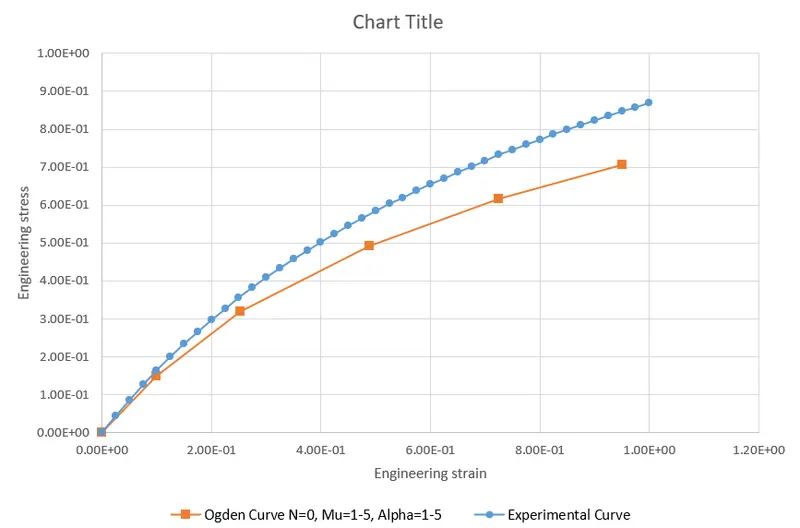
Figure 32: Comparison of Experimental data with Ogden curve in graph
Comparison of the all the Ogden with different order of polynomials, Mooney-Rivlin curves and the Experimental given curves are done to validate.
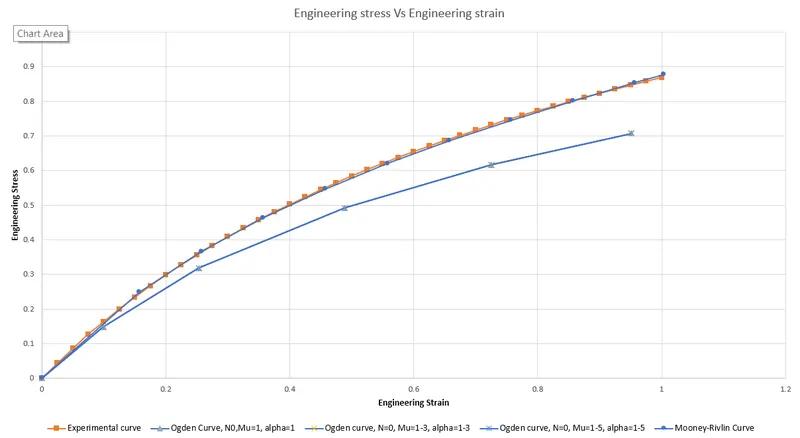
Figure 33: Combination of all Curves in Engineering stress Vs Engineering strain graph
Conclusion:
The curves of Experimental data, Mooney-Rivlin, Ogden material with different polynomials is compared with each other and validated.
The overlapping the curves, the curve fitting is done.
The curve of Mooney-Rivlin and experimental data is fitting better than Ogden curves from the observation.