Week 1 Stress Concentration on a Plate with hole
Stress Concentration on a Plate with hole
OBJECTIVES:
To design a plate with a hole with the specified given parameters and to determine the deformation and stress for the applied load for both cases.
CASE-1:
For Case-1, Static Structural Analysis was carried out with the plate having a single hole at the centre. The material used for the analysis was Structural Steel and the analysis was carried out using ANSYS Mechanical Enterprise. The model for the case-1 was created using ANSYS SpaceClaim software and is shown in the figure below.
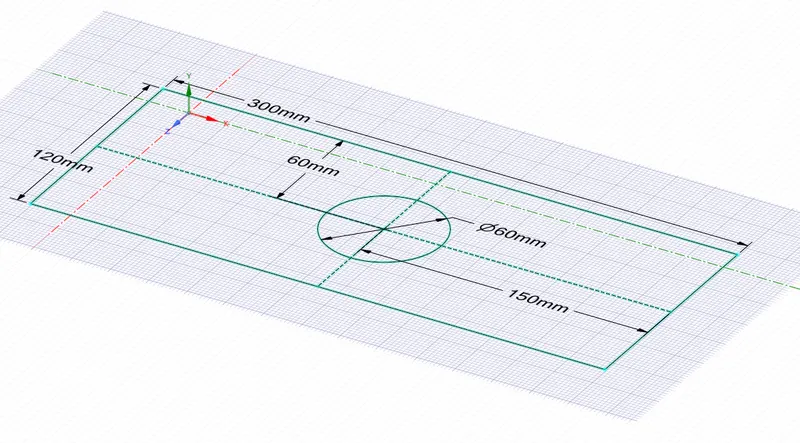
Fig.1 Case-1 Model
The dimensions of the plate are as follows:
|
Length |
300mm |
|
Height |
120mm |
|
Thickness |
30mm |
|
Hole Diameter |
60mm |
Later the model was extruded in the SpaceClaim as solid and exported into the ANSYS software to carry out the analysis. The extruded plate model is shown below.
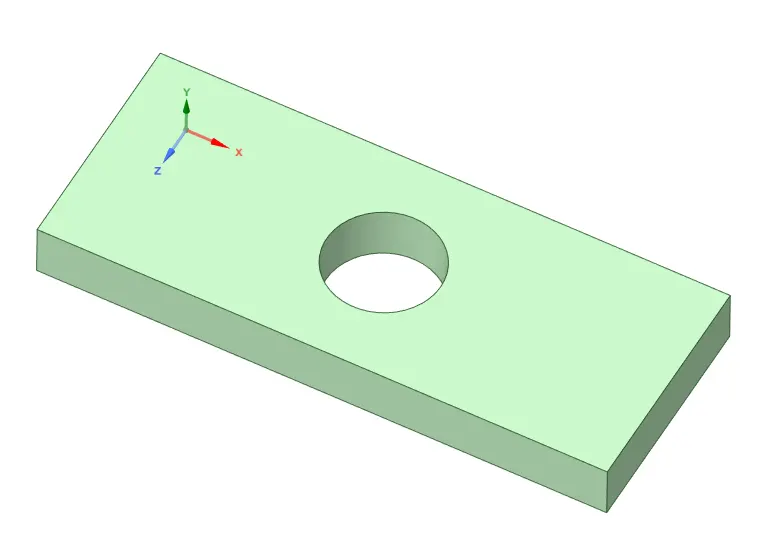
Fig.2 Case-1 Extracted Model
The material and its properties used for this analysis are specified below.
|
Material |
Structural Steel |
|
Density |
7.85e-9 tonne/mm3 |
|
Young’s Modulus |
2.0e+5 MPa |
|
Thermal Conductivity |
0.0605 W/mm°C |
|
Specific Heat |
4.34e+5 J/tonne°C |
|
Tensile Yield Strength |
250 MPa |
|
Tensile Ultimate Strength |
460 MPa |
Then the model was meshed in ANSYS Mechanical Enterprise with an element size of 3.0mm and a Patch Confirming Method using Tetrahedrons was employed. This was done to get better mesh.
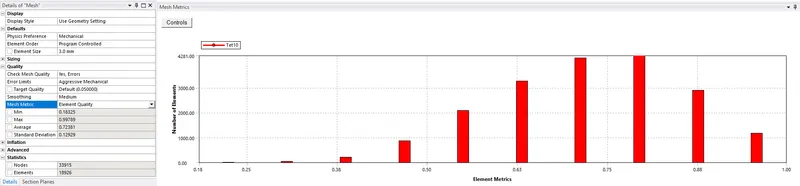
Fig.3 Element Quality
A mesh metric that identifies elements according to their quality was employed and it can be seen that the elements of lowest quality are minimal. Most of the elements have very high quality in the range of 0.7 to 1. Hence, the mesh is of acceptable quality. The meshed model is shown below.
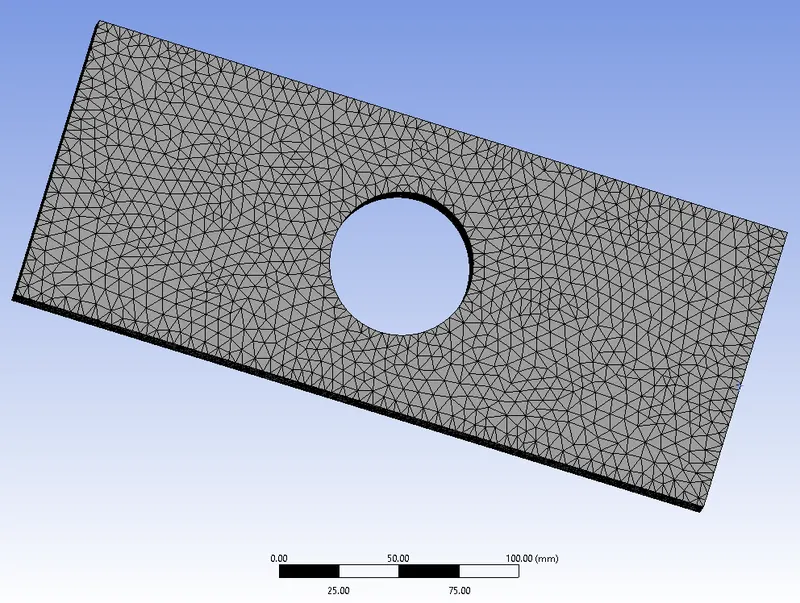
Fig.4 Meshed Model
The Simulation is then run with the applied boundary conditions i.e., fixed support on one side and load of 500N on the other side and the results were obtained.
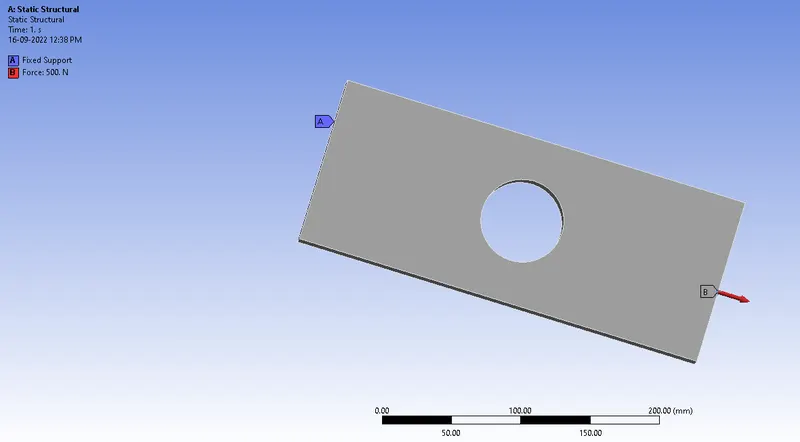
Fig.5 BC and Load applied
CASE-2:
For Case-1, Static Structural Analysis was carried out with the plate having a single hole at the centre. The material used for the analysis was Structural Steel and the analysis was carried out using ANSYS Mechanical Enterprise. The model for the case-1 was created using ANSYS SpaceClaim software and is shown in the figure below.
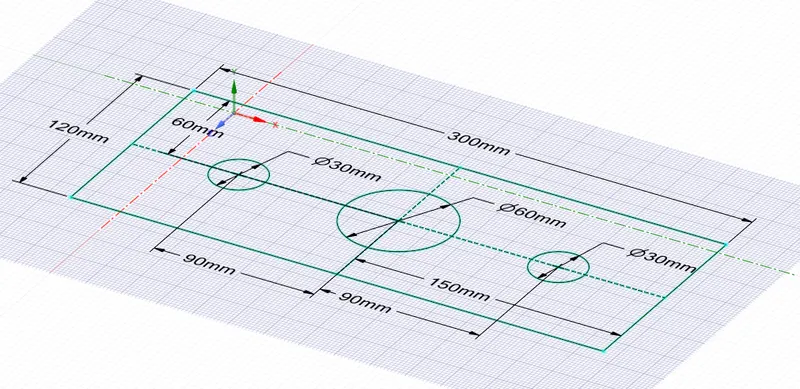
Fig.6 Case-2 Model
The dimensions of the plate are as follows:
|
Length |
300mm |
|
Height |
120mm |
|
Thickness |
30mm |
|
Hole Diameter |
60mm |
|
Small Hole Dia |
30mm |
Later the model was extruded in the SpaceClaim as solid and exported into the ANSYS software to carry out the analysis. The extruded plate model is shown below.
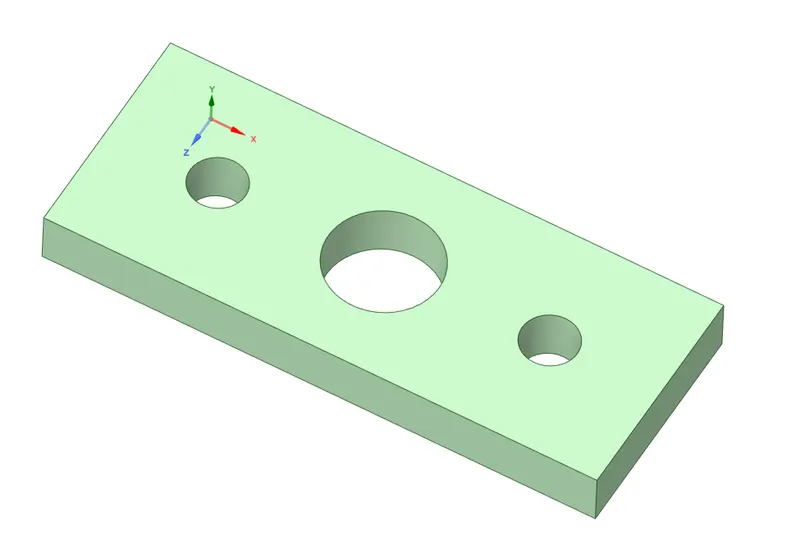
Fig.7 Case-2 Extracted Model
Same materials and element size of 3.0mm was used for the Case-2 model also. The meshed model is shown below.
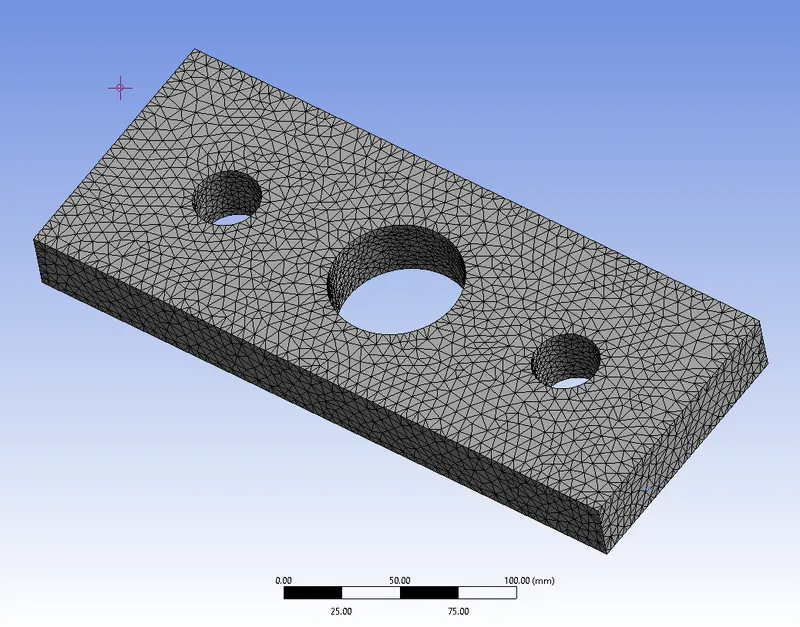
Fig.8 Meshed Model
The boundary conditions and load used in Case-1 was also used in Case-2 also.
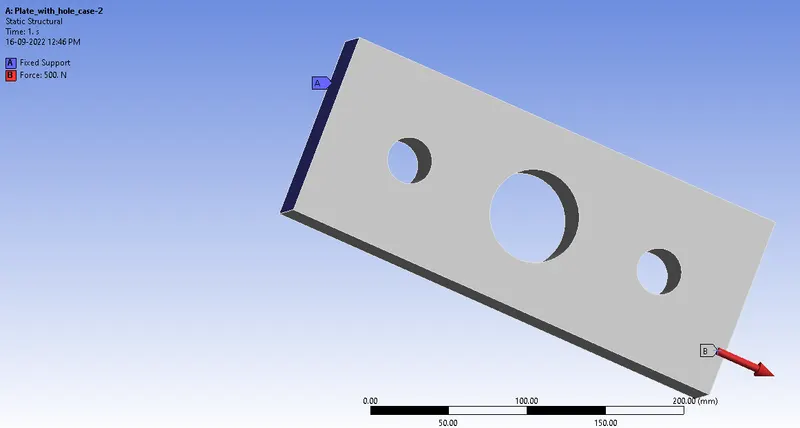
Fig.9 BC and Load applied
RESULTS:
The Total Deformation for the two cases was obtained from the analysis and compared below.
|
Case |
Minimum [mm] |
Maximum [mm] |
Average [mm] |
|
1 |
0.0 |
2.7489e-004 |
1.3896e-004 |
|
2 |
0.0 |
2.9722e-004 |
1.4659e-004 |
The Equivalent (Von-Mises) Stress for the two cases was obtained from the analysis and compared below.
|
Case |
Minimum [MPa] |
Maximum [MPa] |
Average [MPa] |
|
1 |
1.0864e-002 |
0.60778 |
0.17242 |
|
2 |
1.5333e-003 |
0.58394 |
0.16947 |
The Total Deformation for the two cases obtained from the analysis is shown below.
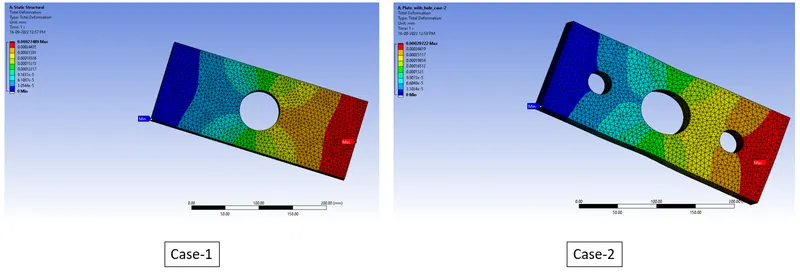
Fig.10 Total Deformation Contour Plot
The Equivalent (Von-Mises) Stress for the two cases obtained from the analysis is shown below.
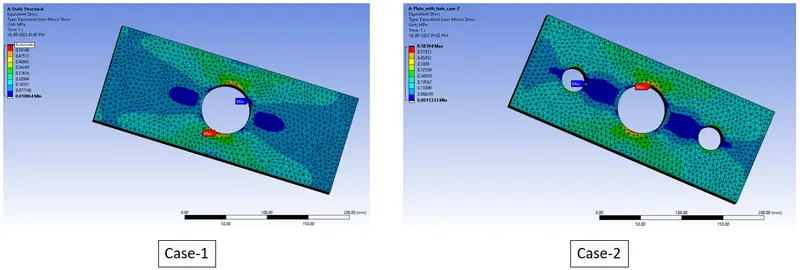
Fig.11 Equivalent Stress Contour Plot
CONCLUSION:
The analysis was run successfully for both cases. The mesh count for both cases is different because of a greater number of holes present in the case-2 model. Because of the lesser mesh count, the time taken for the analysis to complete was lesser in case-2 than in case-1
While comparing the Total Deformation sustained by both the models, there is a slight variation in the average and maximum deformation by an order of 0.8mm and 0.23mm. From the both model cases, Case-1 Model has lesser deformation compared to Case-2.
While comparing the Equivalent Stress obtained by both the models, there is a least noticeable variation in the average, minimum and maximum stress by an order of 0.002mm, 0.9mm and 0.02mm. From the both model cases, Case-1 Model has lesser deformation compared to Case-2.
I. Selection of Design from the analysis point of view:
From Analysis point of view, Case-2 design model can be selected and used because for the given tensile force Case-2 model has lesser Stress when compared to the parent part. Also, the total deformation is quite close similar.
II. Selection of Design from the Manufacturing point of view:
From Manufacturing point of view, Case-1 design model can be selected and used because for the given design, the work carried out to get the final output product is more in Case-2 than in Case-1 and also the time taken for final product is less in Case-1. Finally, the cost for manufacturing the product from raw materials to WIP and to the final product, the cost for manufacturing is low in Case-1 since cost plays a vital role in manufacturing and there must a compromise between design and cost.