Week 1 Stress Concentration on a Plate with hole
Aim Of The Challenge:
To perform static structural analysis on two plates of the same dimensions but with a different numbers of holes and analyze the stress, deformation etc. acting on the plates.
Procedure :
Case 1:
1.)Designing Plate A with a single hole.
2.)Meshing
Case 2:
1.)Designing Plate B with 3 holes.
2.)Meshing
3.)Compare the simulation results.
Designing of plates of structural steel with Ansys spaceclaim software.
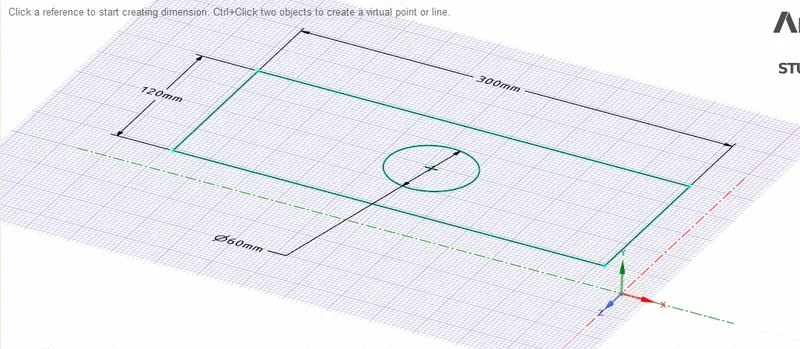
The plate is modelled with the following dimensions of
300 mm length
120mm width
30 mm thickness
60 mm diameter hole in centre at the midpoint of lines of length & width.
Material specification:
|
Density |
7.85e-006 kg mm-3 |
|
Isotropic Secant Coefficient of Thermal Expansion |
1.2e-005 C-1 |
|
Specific Heat Constant Pressure |
4.34e+005 mJ kg-1 C-1 |
|
Isotropic Thermal Conductivity |
6.05e-002 W mm-1 C-1 |
|
Isotropic Resistivity |
1.7e-004 ohm mm |
Desiging of plate A with single hole:
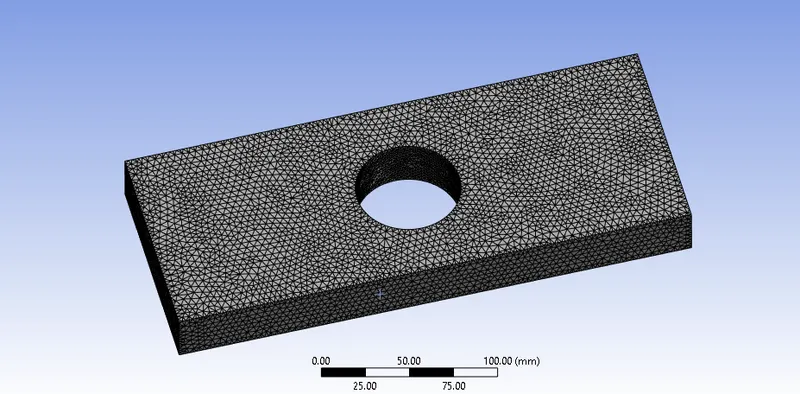
Meshing of single hole plate:
The plate is meshed with tetrahedron elements of 3mm size under Ansys Academic License
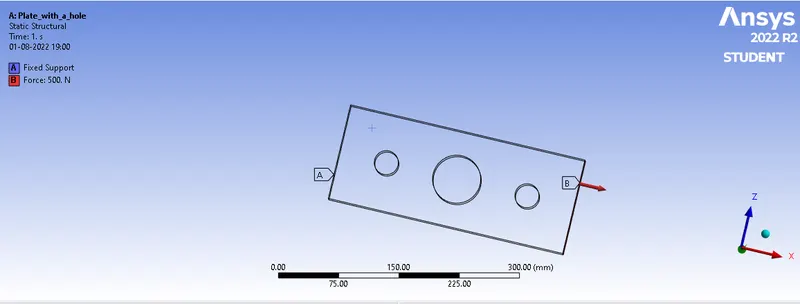
After the model is meshed, the loads are applied on the model. A fixed support is given on one side while a tensile load of 500 N is given on the other. The loads are as shown in the image below:
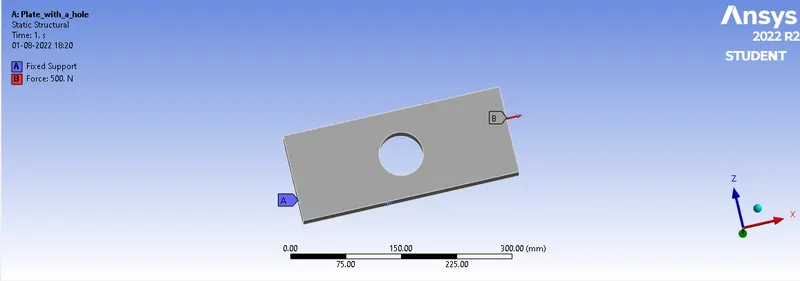
The solutions are applied & at the end Von mises stress applied with total deformation
Desiging of plates B with 3 holes one at the centre of 60 mm diameter & other two at 90 mm from centre with 30 mm diameter with Ansys spaceclaim:
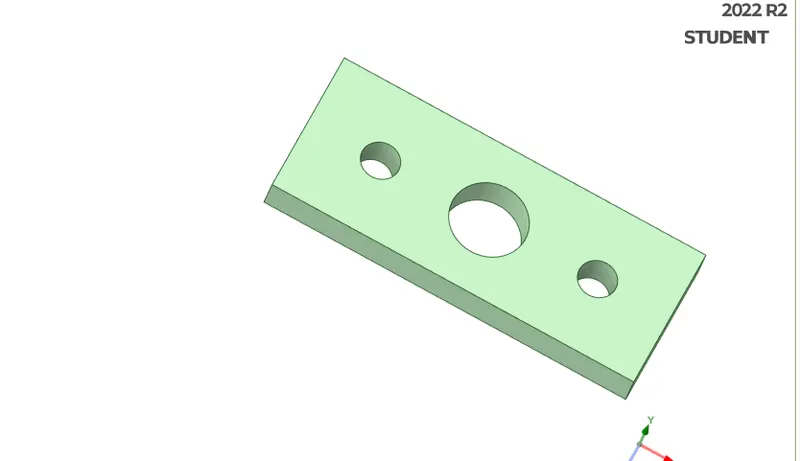
Meshing of 3 hole plate B:
The plate is meshed with tetrahedron elements of 2mm size under Ansys Academic License.
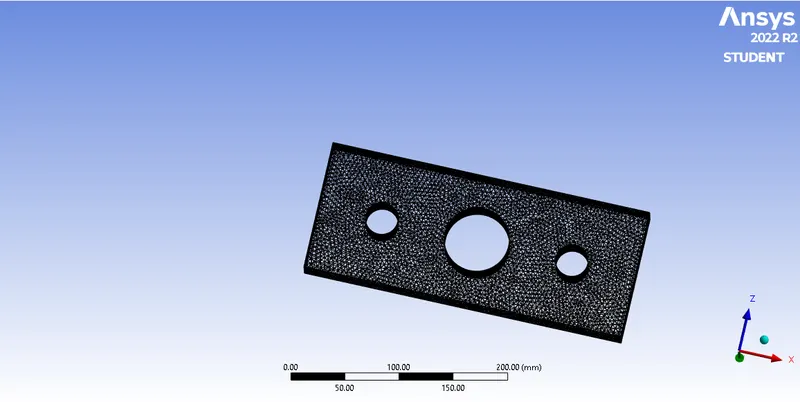
After meshing plate B is fixed at one end & at the other end 500N tensile force is applied
Therefore the Equivalent stress are compared
Results:
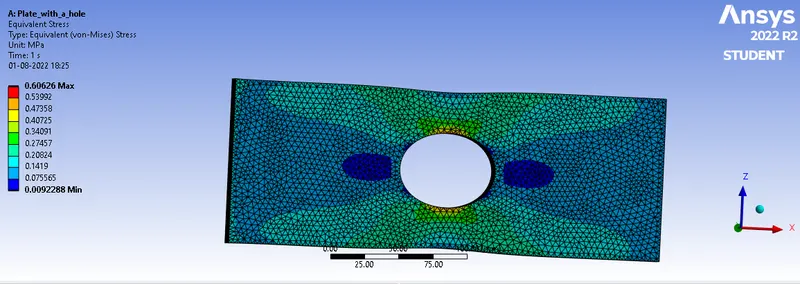
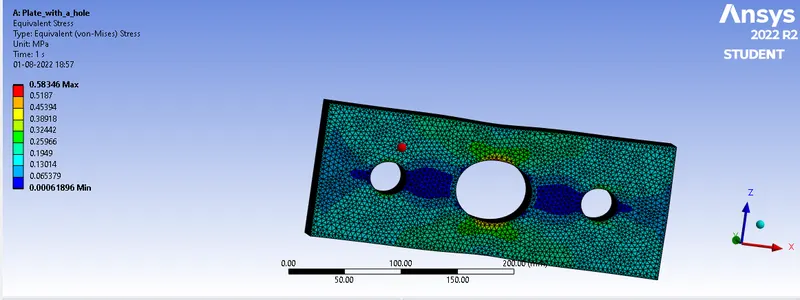
The Equivalent stress for the two cases are compared
|
Time [s] |
Minimum [MPa] |
Maximum [MPa] |
Average [MPa] |
|
1. |
0.0092288 |
0.60626 |
0.16858 |
|
2. |
0.00061896 |
0.58436 |
0.16807 |
The Equivalent stress comparision is plotted below:
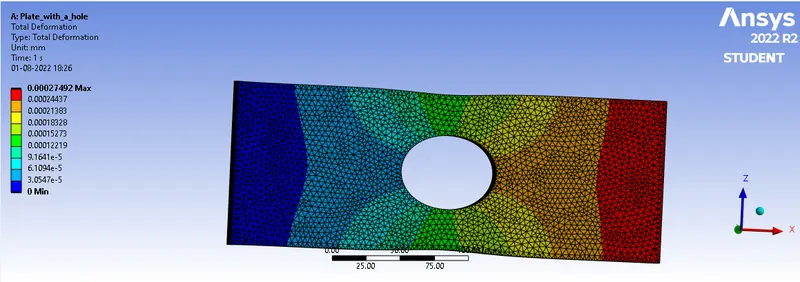
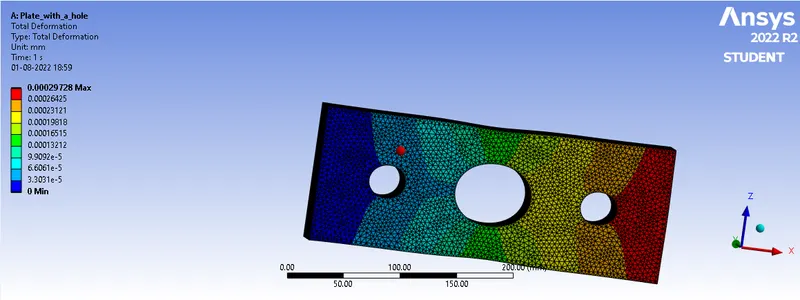
The Total Deformation for the two cases are compared below.
|
Time [s] |
Minimum [mm] |
Maximum [mm] |
Average [mm] |
|
1. |
0. |
2.7472e-004 |
1.3713e-004 |
|
2. |
0. |
2.9722e-004 |
1.4704e-004 |
Total deformation comparision of plate A & B is plotted below
Conclusion:
Analysis was done where nodes and elements are taken into account as per Ansys Academic License.
In plate B due to presence of 3 holes lesser material present so low size element of 2 mm used during meshing so we get more accurate result for plate B compared to plate A.From analysis standpoint plate B is more close to accuracy than plate A.
On comparison of the Total Deformation experienced by the model A having only a slight difference in the average value is evident of the order of 0.0991mm with Case 2 having a higher value. Maximum deformation in the two models has a difference of the order of 0.225mm.
On comparison of the Equivalent stress experienced by the model in the A having a difference of 0.00051 MPa is evident in the average value of equivalent stress. But the tension force experienced in case 2 is lesser than than Case 1.