Week 1 Stress Concentration on a Plate with hole
OBJECTIVE:
To design a plate of 300*120*30 with a hole for the following cases
case-1: hole of 60mm diameter at the center
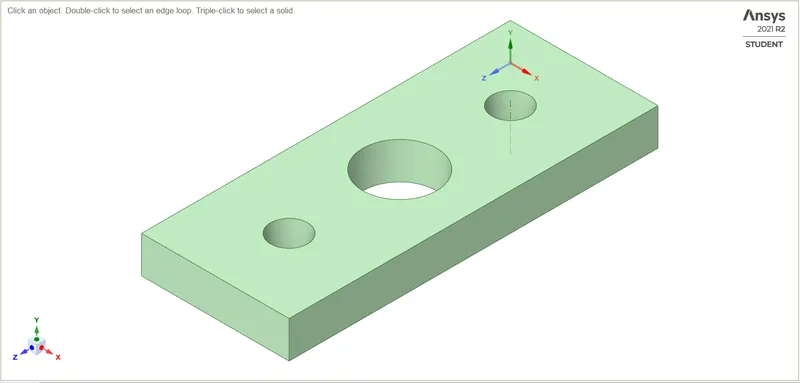
case-2: hole of 60mm diameter at the center and smaller holes of 30mm at 90mm away from the center.
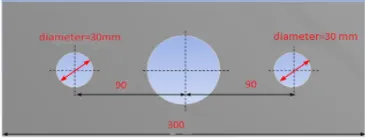
A load of 500N on the right face is assigned for both cases.
- Compare the deformation and maximum stress developed on a structural steel model for the 2 cases.
- From an analysis standpoint, which of the design will you select? Explain why?
- From a manufacturing standpoint, which of the design will you select? Explain why?
Theory:
Stress concentration:
A stress concentration is a point in a part where the stress is significantly greater than its surrounding area. Stress concentrations occur as a result of irregularities in the geometry or within the material of a component structure that cause an interruption of the stress flow. These interruptions typically arise from discontinuities such as holes, grooves, notches, and fillets. Stress concentrations may also be caused by accidental damage such as nicks and scratches.
A discontinuity’s degree of concentration under typical tensile loads is usually expressed by the non-dimensional stress concentration factor (Kt), which is the ratio of the highest stress to the reference stress.
Basic stress analysis calculations assume that parts are smooth, have a uniform cross-section, and have no irregularities. In practice, virtually all engineering components have at least minimal changes in section and/or shape.
Shoulders on shafts, oil holes, keyways, and screw threads all can change the stress distribution such that the basic stress analysis equations no longer apply. Such discontinuities cause a local increase in stress, referred to as a stress concentration factor.
If the material is flawless with no discontinuities, then the stress concentration factor is 1. If there is a discontinuity, then the stress concentration factor is greater than 1.
How Stress Concentration Factor (Kt) Values are Determined
The stress concentration factor is associated with a part’s specific geometry and loading condition can be derived through experimentation, analysis, or computational methods.
- Experimental methods: Optical methods such as photoelasticity are very dependable and widely used for experimentally determining the stress concentration at a point on a part. However, several alternative methods that have been historically used include the grid method, brittle coating, brittle model, and strain gauge.
- Analytical methods: The theory of elasticity can be used to analyze certain geometrical shapes to calculate stress concentration factors.
- Computational methods: Finite element techniques provide a powerful and inexpensive computational method to assess stress concentration factors.
Characteristics of a Stress Concentration Factor
- The function of the geometry or shape of the part, but not its size or material composition
- The function of the type of loading (axial, bending, or torsional) applied to the part
- The function of the specific geometric stress raiser (e.g., fillet radius, notch, or hole) in the part
- Always defined with respect to a particular nominal stress
- Typically assumes a linear elastic, homogeneous, isotropic material
Methods to Reduce a Part’s Stress Concentration Factor
A number of stress-relieving methods are available to reduce the stress concentration factor of a given part, including:
- Providing a fillet radius so that the cross-section may change gradually
- Using an elliptical fillet
- Using several small notches rather than a long one, if a notch is unavoidable
- Using narrow notches rather than wide notches, if a projection is unavoidable
- Using stress-relieving grooves
Analysis Setup:
The static structural analysis system is used for the analysis.
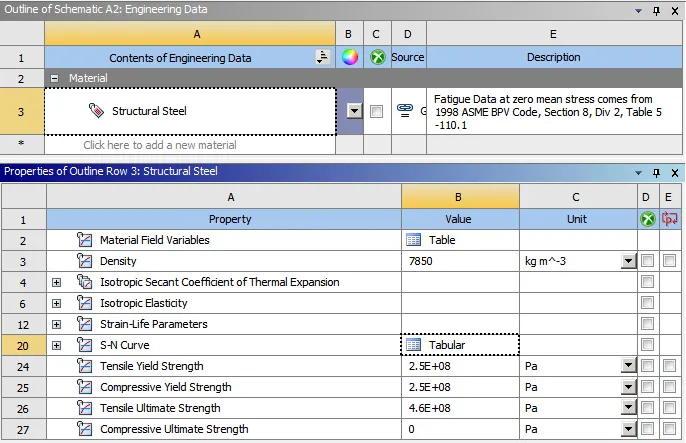
Provide the material card in the engineering data.
The Structural steel material is used for the plates in the analysis. The default material properties in the engineering data are provided.
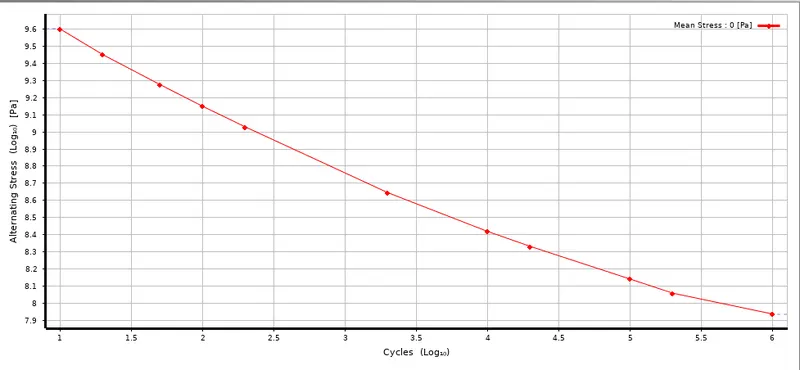
The S-N curve is provided, Fatigue properties of materials are often described using the fatigue limit or the S-N curve (fatigue curve, Wöhler curve). The S-N curve describes the relationship between cyclic stress amplitude and the number of cycles to failure. On the horizontal axis, the number of cycles to failure is given on a logarithmic scale.
Geometry:
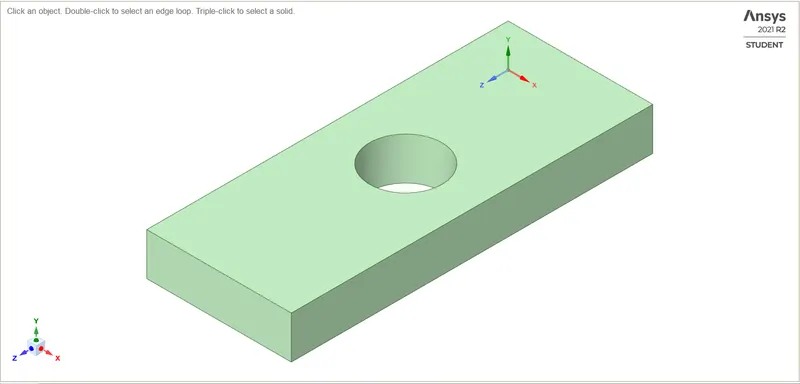
A rectangle of 300*120 is made and a circle of 60 mm is drawn at the center using the reference lines.
For the second case from the center draw the reference line to a distance of 90mm and draw the circle of 30mm on either side.
Delete the reference lines which are not necessary.
Delete the circular holes from the rectangular geometry.
Pull the section created to a thickness of 30mm.
Case-1:
Case-2:
Meshing:
The mesh size used is 2mm. The method used for mesh is tetrahedrons.
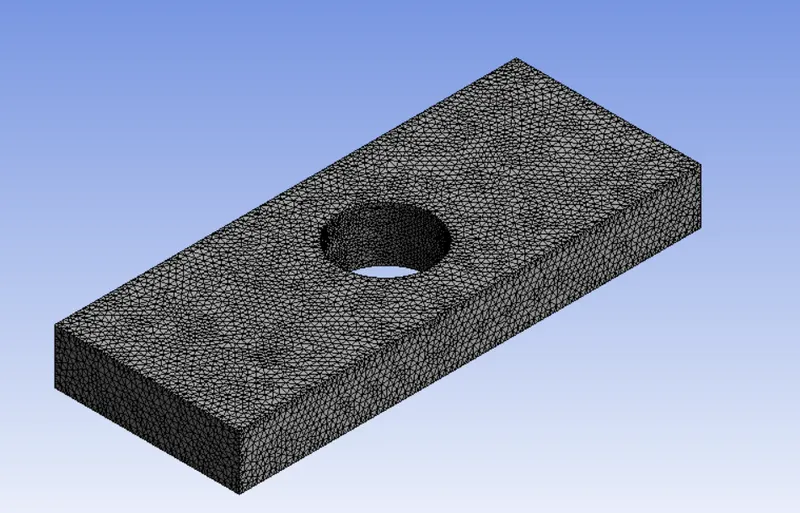
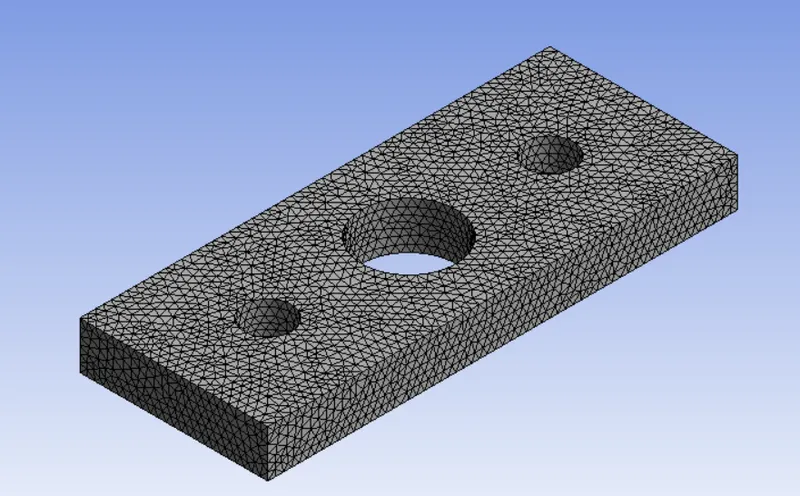
After the mesh is generated, we provide the necessary boundary conditions to the model.
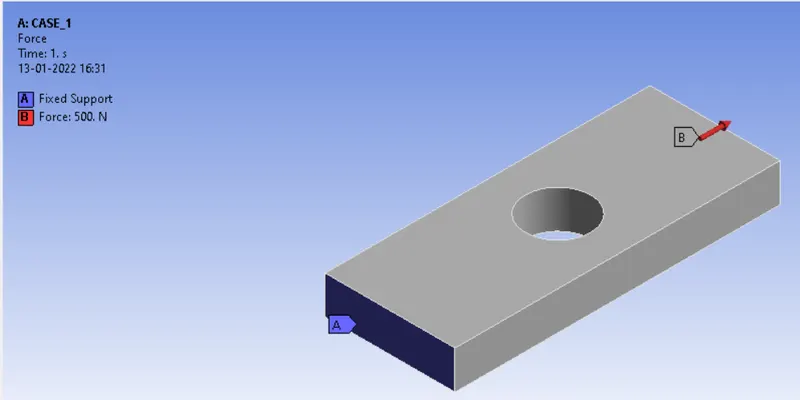
The left end of the model is fixed in all degrees of freedom and on the right side, the tension force of 500N is applied along the z-axis.
Solve the problem.
Solution information is used to see the operations that run behind the simulation.
One should request the required outputs to view the respective contour. By right-clicking on the solution we can view the options which can be requested. For the model used, I have requested the total deformation, Von mises stress.
Results and Discussion:
Case-1:
Von-Mises stress distribution:
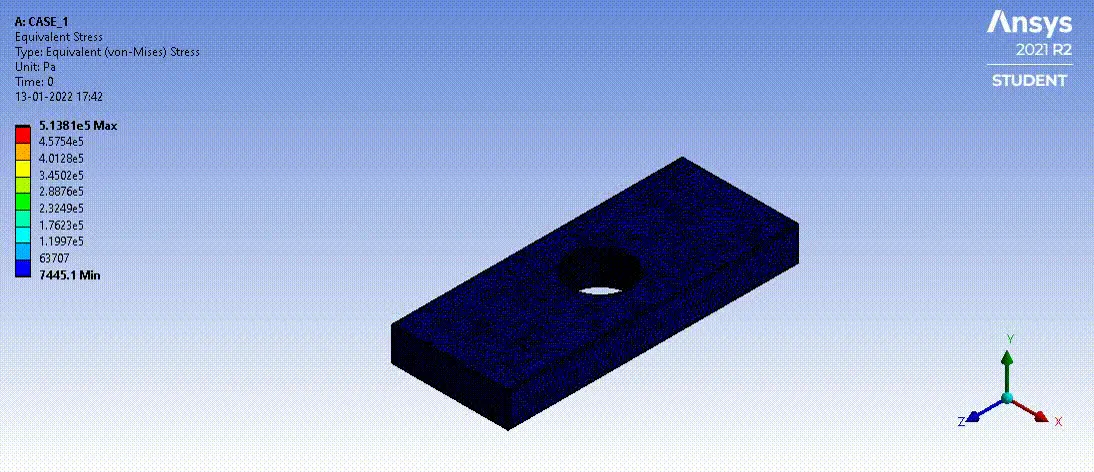
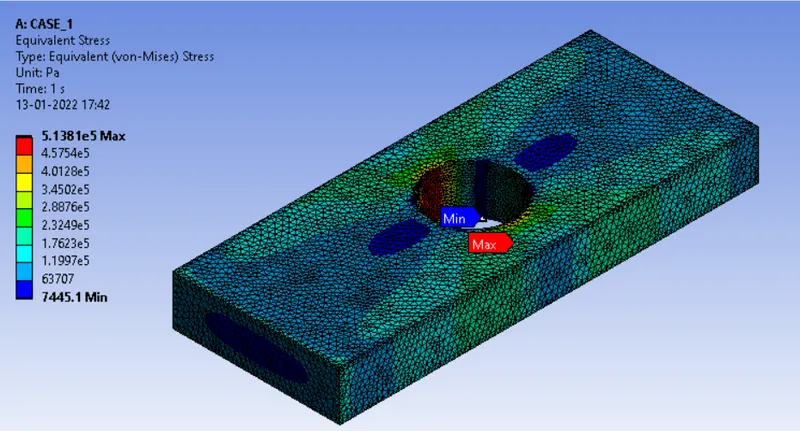
From the von-mises contour for case-1, it is observed that the maximum stress of 0.51381 MPa is developed around the hole region.
The minimum stress of 0.074451 MPa is also developed in the hole region.
Total deformation:
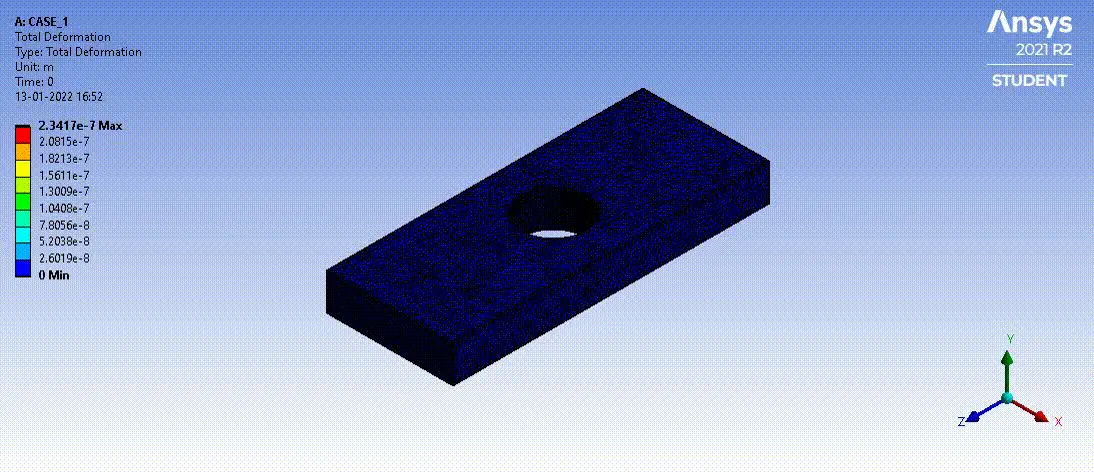
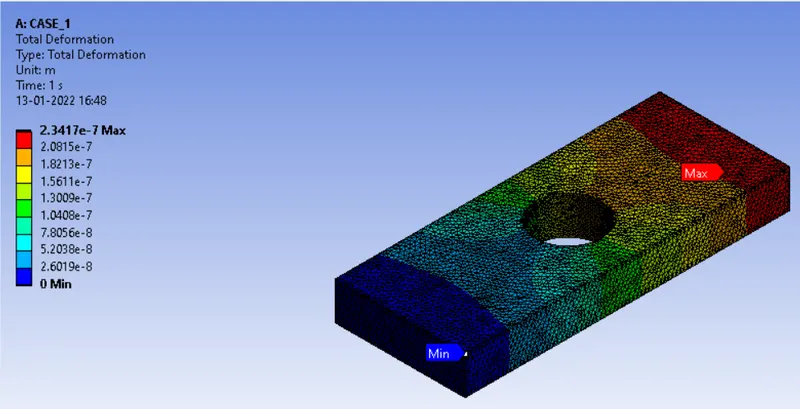
From the Total deformation contour for case-1, it is observed that the maximum deformation of 0.5137 MPa is developed at the location where force is acting.
The minimum deformation is at the fixed end.
CASE-2:
Von-Mises Stress distribution:
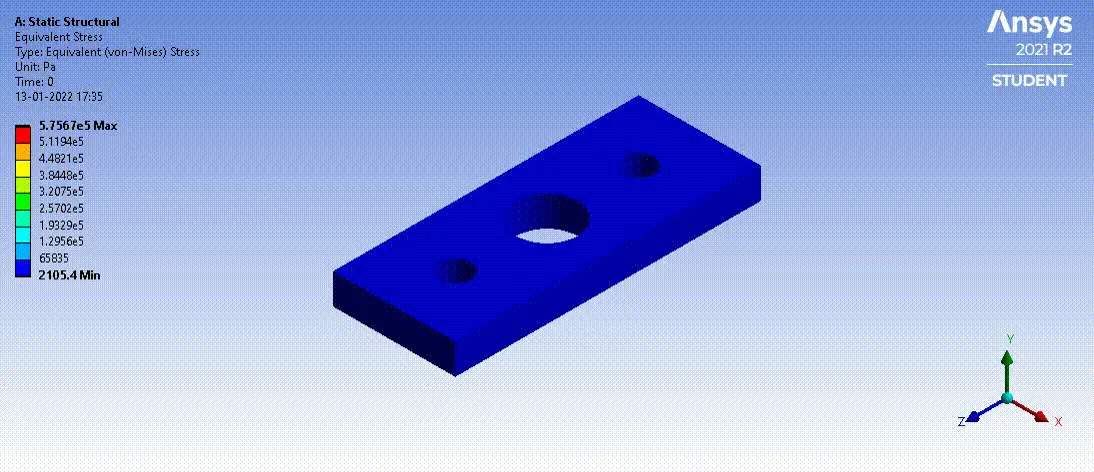
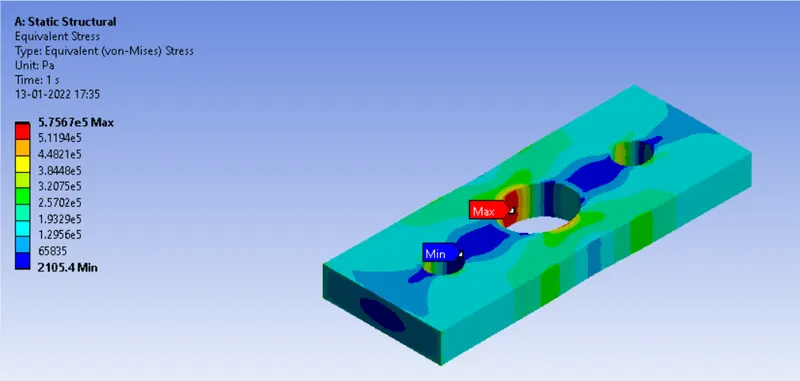
From the von-mises contour for case-2, it is observed that the maximum stress of 0.57567 MPa is developed around the hole region.
The minimum stress of 0.021054 MPa is also developed in the hole region.
Total deformation:
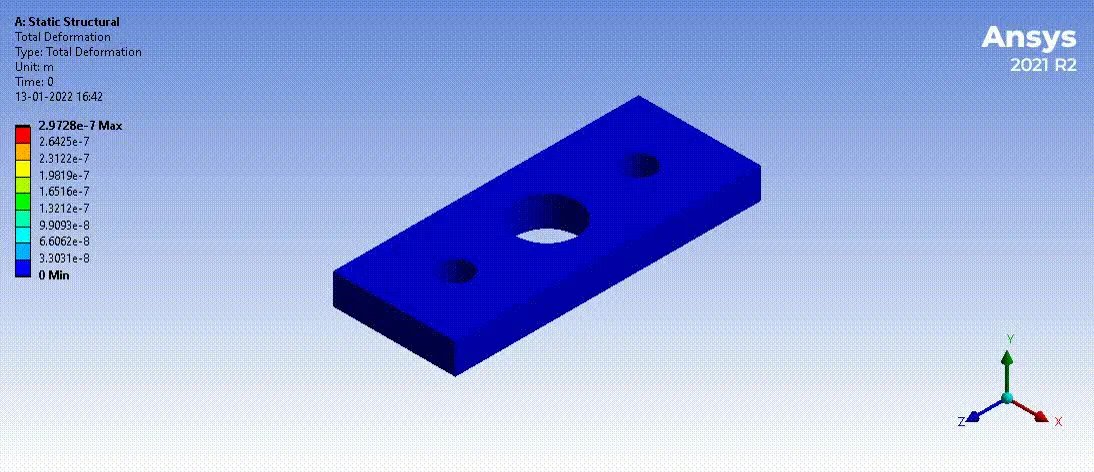
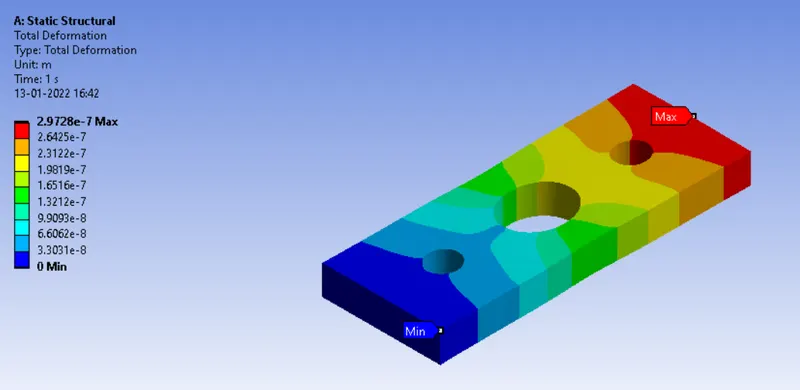
From the Total deformation contour for case-2, it is observed that the maximum deformation of 0.5137 MPa is developed at the location where force is acting.
The minimum deformation is at the fixed end.
Conclusion:
Comparison of results:
In case-1, As the hole is of larger diameter, the stress flow lines are converged near the circle and the model edge. Therefore the maximum stress is seen at that point.
In case-2, The stress flow lines are interrupted at the three locations, but due to the bigger hole at the center, stress concentration is built up high compared to lower diameter holes. Therefore the maximum stress is seen at the center hole.
The stress flow lines are interrupted causing the stress concentration which in turn increases the stress at that location. In case-1 only one hole is causing the stress concentration. In case-2, the stress flow lines are interrupted at the hole of 30mm dia and then again interrupted at 60mm dia hole which increases the stress at that location when compared to the case-1. therefore, the stress in case-2 is higher than that of case-1.
The deformation or the elongation is maximum at the point of application of load. Due to many holes(changes in geometry) in the geometry of case-2, the deformation is more when compared to case-1.
From an analysis standpoint, the design of a plate with a single hole i.e., case-1 is used is preferred because v-m stress developed in case-1 is less compared to case-2. The stress concentration in case-1 is lesser compared to case-2. The deformation is also less in case-1 when compared to case-2, Which makes the best design from the analysis point.
From a manufacturing standpoint, the design of a plate with a single hole is preferred because of the simple design for manufacturing. Only one hole has to be drilled for case-1 which eases the manufacturing as compared to case-2 where three holes have to be drilled. The manufacturing and labor cost is also minimized by preferring the design of case-1.