Week 1 Spur Gear Challenge
OBJECTIVE:
To Perform static structural analysis on spur gear with following type of materials,
- CASE: 1 Cast Iron
- CASE: 2 Cast Steel
- CASE: 3 Cast Bronze
Compare the results of Equivalent stress, Total deformation, Stress intensity for all the cases.
THEORY:
Spur gears are one of the most common types of gears used in mechanical systems to transmit torque and rotational motion between two parallel shafts. A spur gear consists of a cylindrical disk with teeth that mesh with teeth on another gear to transfer power. to perform a structural analysis of a spur gear, you need to consider several factors, such as the gear's material properties, the gear's geometry, and the loads it experiences during operation.
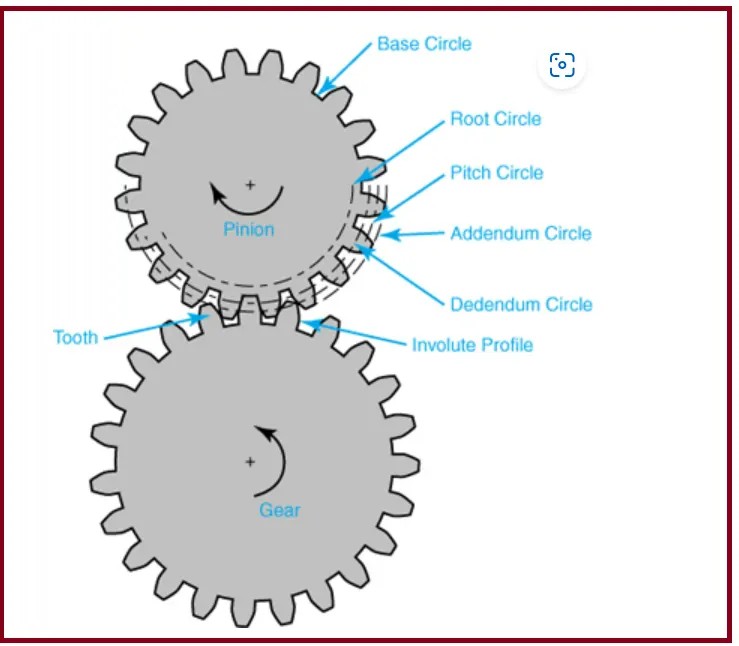
Gear material
The selection of material for spur gears depends on several factors such as the application requirements, operating conditions, and the gear manufacturing process. The following are some of the commonly used materials for spur gears:
- Steel: Steel is the most commonly used material for spur gears due to its high strength, durability, and wear resistance. Steel gears can be made using a variety of manufacturing processes, including forging, casting, and machining.
- Cast Iron: Cast iron is another popular material for spur gears, especially in low-speed and high-torque applications. It has good wear resistance and damping properties, making it suitable for applications where noise and vibration are a concern.
- Bronze: Bronze gears are often used in applications where the gear is required to run at low speeds and under high loads. It has excellent wear resistance, low friction, and good corrosion resistance.
- Aluminium: Aluminium gears are commonly used in applications where weight is a concern, such as aerospace and automotive industries. It has low density, high strength-to-weight ratio, and good corrosion resistance.
- Plastics: Plastics such as nylon, acetal, and polyurethane are often used in applications where low noise and self-lubricating.
Stress Intensity:
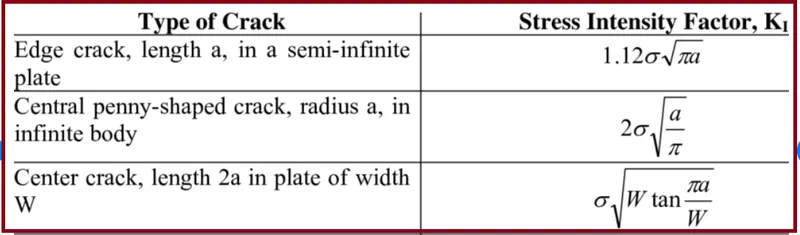
- Stress intensity is a measure of the magnitude of stress near the tip of a crack or other stress concentration in a material. When a crack or other stress concentration is present in a material, the stress near the tip of the crack or concentration is much higher than the average stress in the material. This localized increase in stress is called stress concentration, and the magnitude of the stress near the tip of the crack or concentration is referred to as the stress intensity.
- The stress intensity factor (K) is a dimensionless parameter that describes the level of stress concentration at the tip of a crack or other stress concentration in a material. The value of K depends on the geometry of the crack or stress concentration, as well as the applied load and the material properties of the component.
- The stress intensity factor is an important parameter in fracture mechanics, which is a branch of engineering that deals with the behaviour of materials under loading conditions that lead to crack propagation and fracture. Fracture mechanics is used to predict the behaviour of materials in a wide range of applications.
ANALYSIS:
Here we will perform an analysis on a pair of Spur Gears. We will use different materials for gears and find out the Equivalent stress, Total Deformation and Stress Intensity, where Stress intensity results gives the location of possible fracture of Gears.
CASE 1: Cast Iron (Ductile)
- Given Geometry:
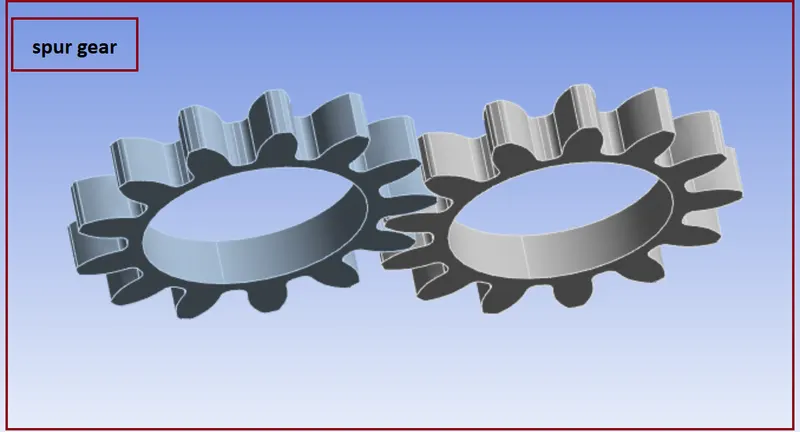
Spur Gear geometry for analysis of all cases is given as below
- Mesh:
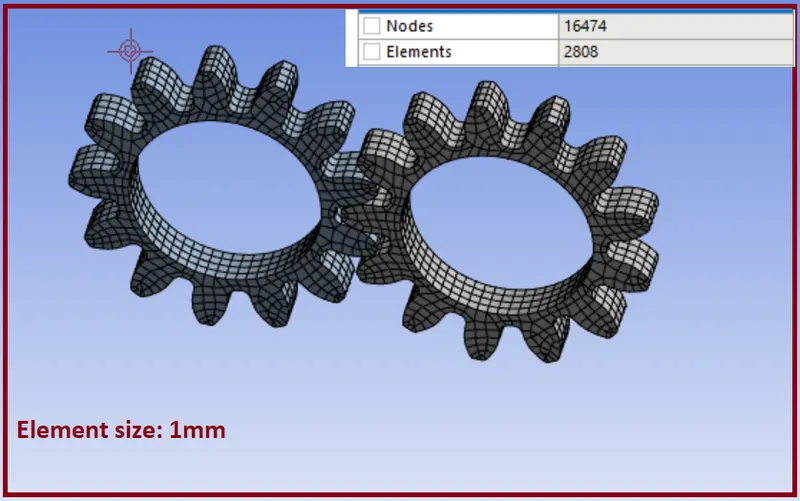
Here mesh is automatically generated most of the element are Hexahedral we work only for mesh refinement that is element size.
Important steps
- Get Static Structural from Analysis Systems.
- In Engineering Data, select “Granta Design Sample Materials”.
- From the Material list, add Material “Cast_Iron (Ductile)” and create new material “Cast_Steel” or “Cast Bronze” as per the given material property.
- After selecting material, import geometry as “Skill_Lync_Spur_Gear.stp”.
- Go to the Model.
- Create Mesh for 1 mm element size as shown.
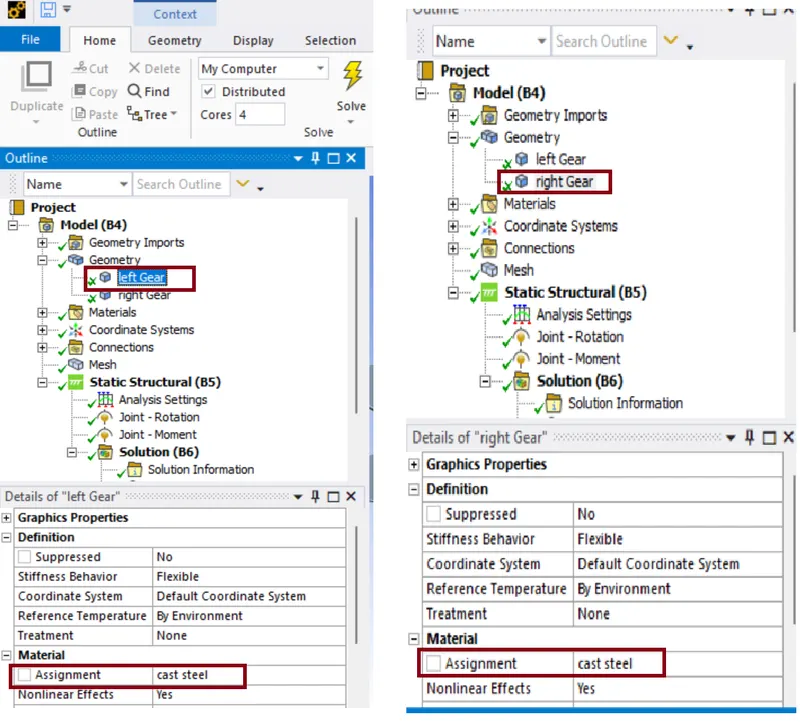
- Give material assignment to both gears as per case.
- From the project tree, select “Connections” and create “Contacts”.
- Contacts
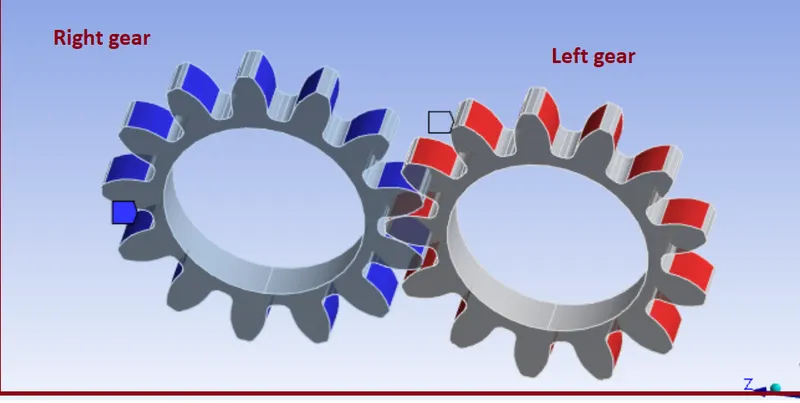
- Here we defining contacts between two gears, select faces of left gear as “Contact” and faces of right gear as “Target” for connection. There are 26 faces of each gear, we must select them.
- Select Contact type = Frictional. Because due to friction, there will be movement between gears.
- Select Behavior = Symmetric
- Select Formulation = Augmented Lagrange. As soon as teeth come in contact, it will tend to move from its position. So, Augmented Lagrange formulation reduces vibration and penetration and increases stiffness of gears.
- Select Interface Treatment = Adjust to Touch. Because if there is a gap between them or initial penetration, then this setting will help to adjust it and any error can be avoided.
- Joints:
After creating Contacts our next step is creating joints.
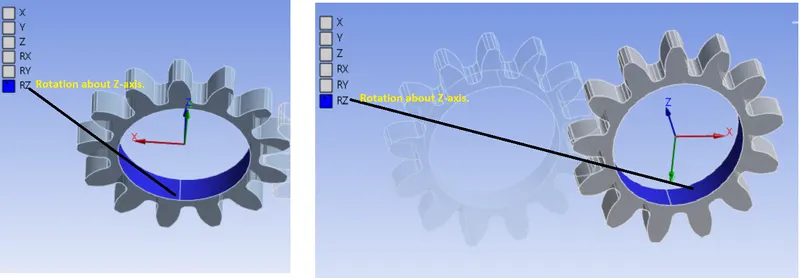
Here we select inner face of each gear and give it a Revolute Joint as described in above image.
For frame of reference for gears, select
- Connection Type = Body to Ground for both of the gears.
- We can see that in revolute joint, degree of freedom for gears automatically set to its axis or in RZ direction.
- Boundary Conditions settings:
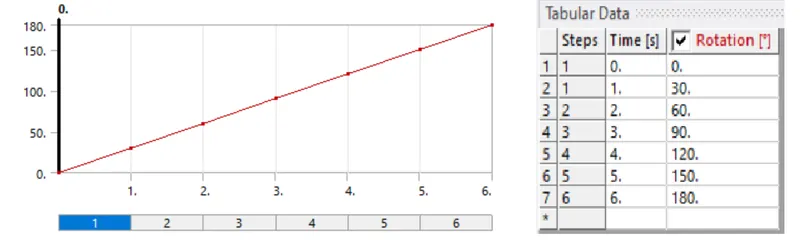
Here we are going to look at contact forces, traces and stress developed for 1 revolution of gear. So, for 180-degree angle, in analysis settings give values as given below:
- No. of Steps = 6
- Auto Time stepping = ON
- Defined by = Time
- Initial Time Step = 0.2 s
- Minimum Time Step = 0.05 s
- Maximum Time Step = 0.5 s
- Select all 6 steps and select “Large Deflection = ON” in solver controls.
Other Boundary conditions
- Joint: Revolute – Ground to Left
- Type: Rotation
- Magnitude: Tabular Data
- Tabular Data:
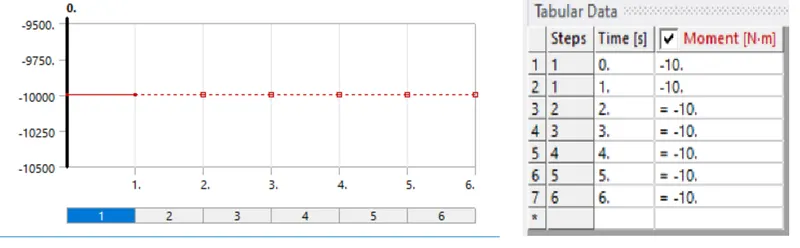
Joint Load for other Gear
- Joint: Revolute – Ground to Right
- Type: Moment
- Magnitude: Tabular Data
- Tabular Data:
- SOLUTION
After giving proper boundary conditions, create desired solutions for output results. Create Solutions for Equivalent (Von Mises) Stress, Total Deformation and for Stress Intensity. Also give Contact Tool and create solutions for contact Status and Pressure.
- Equivalent Stress
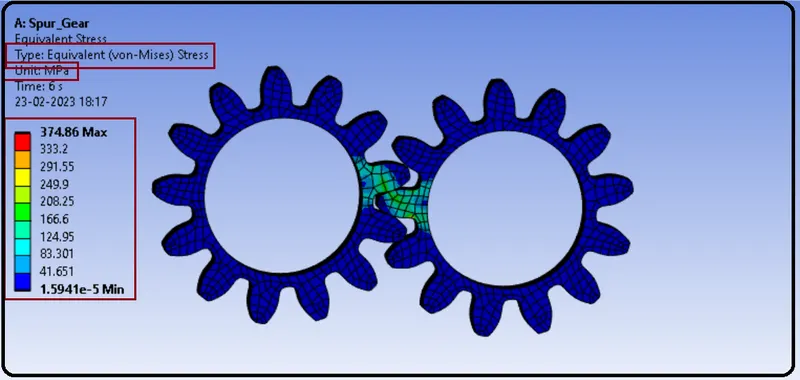
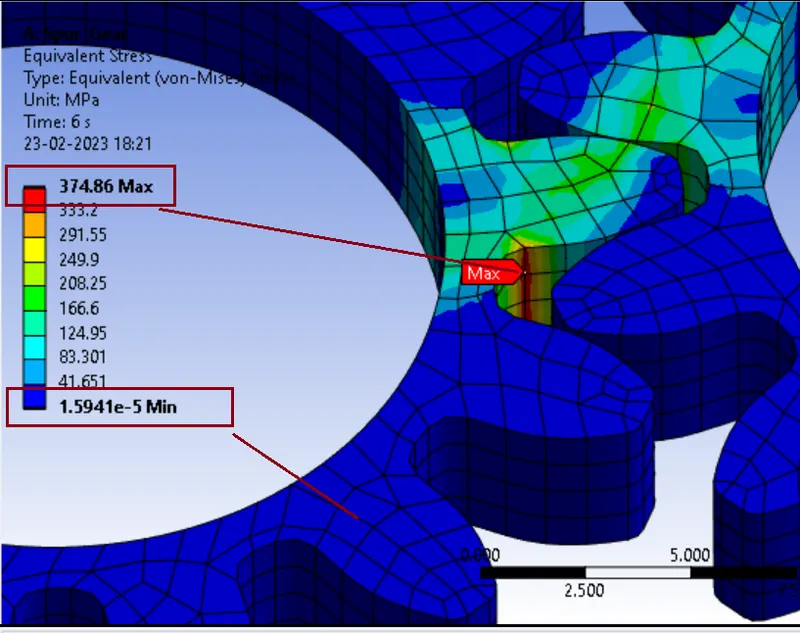
Here we observe maximum stress induced in gears is 374.86 MPa.
- Stress vs time plot
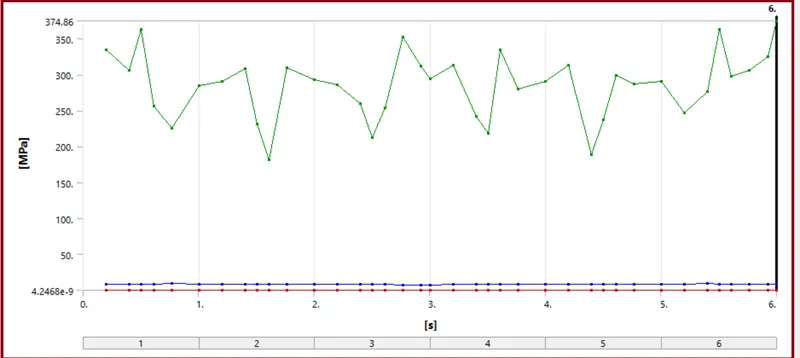
- Detailed Stress Result:
|
Time (sec) |
Minimum (MPa) |
Maximum (MPa) |
Average (MPa) |
|
0.2 |
6.4667e-008 |
334.36 |
8.3122 |
|
0.4 |
1.1195e-008 |
305.96 |
8.4083 |
|
0.61 |
6.8059e-007 |
255.94 |
8.8917 |
|
0.7675 |
2.3382e-006 |
225.16 |
9.09 |
|
1. |
5.1155e-008 |
285.11 |
8.1964 |
|
1.505 |
4.5718e-005 |
231.7 |
8.5447 |
|
2. |
2.5232e-008 |
293.06 |
7.966 |
|
2.505 |
6.4656e-006 |
211.88 |
8.4047 |
|
3. |
1.1233e-008 |
293.75 |
7.5597 |
|
3.505 |
4.2468e-009 |
218.1 |
8.4697 |
|
4. |
2.6105e-008 |
291.05 |
7.9276 |
|
4.505 |
1.9716e-006 |
236.72 |
8.6463 |
|
5. |
1.3987e-007 |
291.21 |
8.4018 |
|
5.505 |
6.9805e-006 |
363.1 |
8.4528 |
|
6. |
1.5941e-005 |
374.86 |
8.2355 |
- Total Deformation
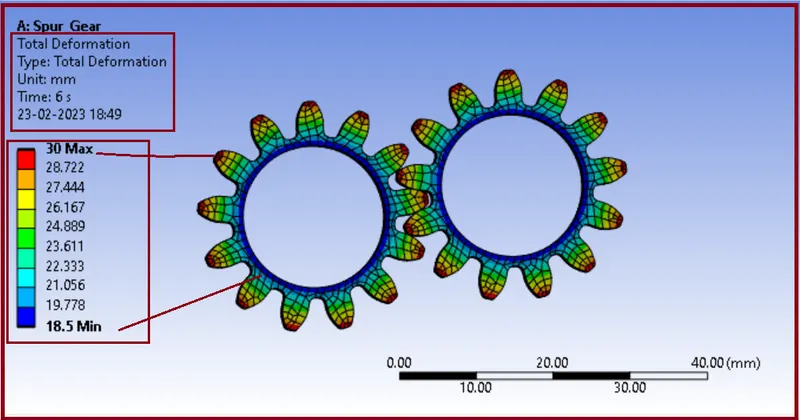
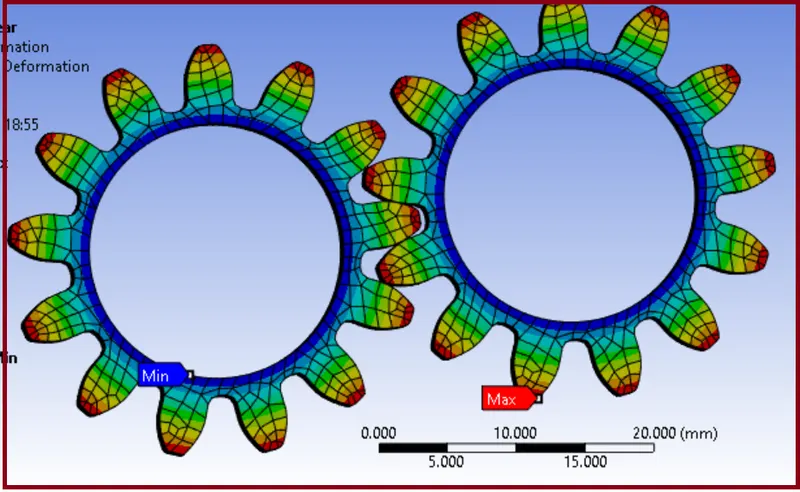
- Deformation graph with time:
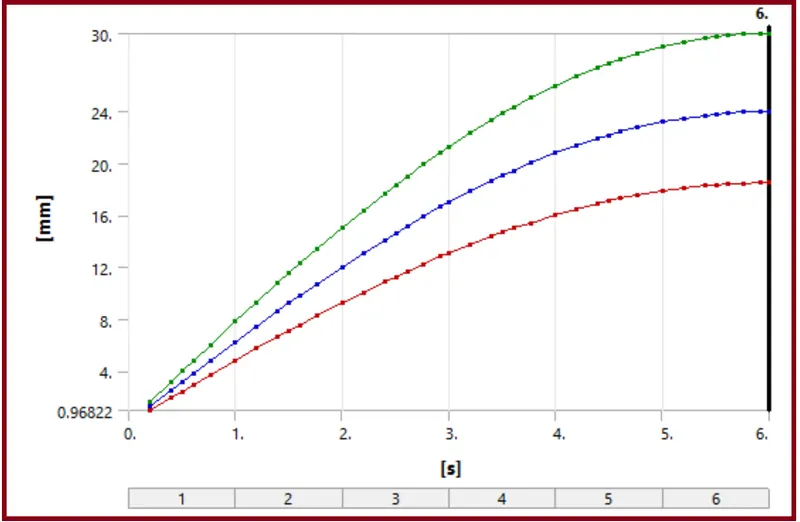
- Detailed Deformation Result:
|
Time (Sec) |
Minimum (mm) |
Maximum (mm) |
Average (mm) |
|
0.2 |
0.96822 |
1.5978 |
1.2669 |
|
0.4 |
1.9338 |
3.168 |
2.521 |
|
0.61 |
2.9419 |
4.7985 |
3.8268 |
|
0.7675 |
3.6923 |
6.015 |
4.8 |
|
1. |
4.7882 |
7.7907 |
6.2207 |
|
1.505 |
7.102 |
11.546 |
9.2232 |
|
2. |
9.25 |
15.019 |
12.005 |
|
2.505 |
11.281 |
18.317 |
14.641 |
|
3. |
13.081 |
21.235 |
16.975 |
|
3.505 |
14.692 |
23.841 |
19.062 |
|
4. |
16.021 |
25.992 |
20.784 |
|
4.505 |
17.101 |
27.744 |
22.185 |
|
5. |
17.87 |
28.985 |
23.18 |
|
5.505 |
18.345 |
29.753 |
23.795 |
|
6. |
18.5 |
30. |
23.995 |
- Stress Intensity
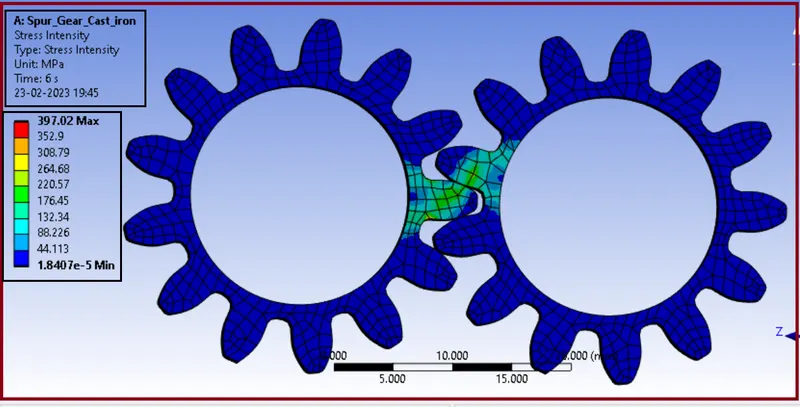
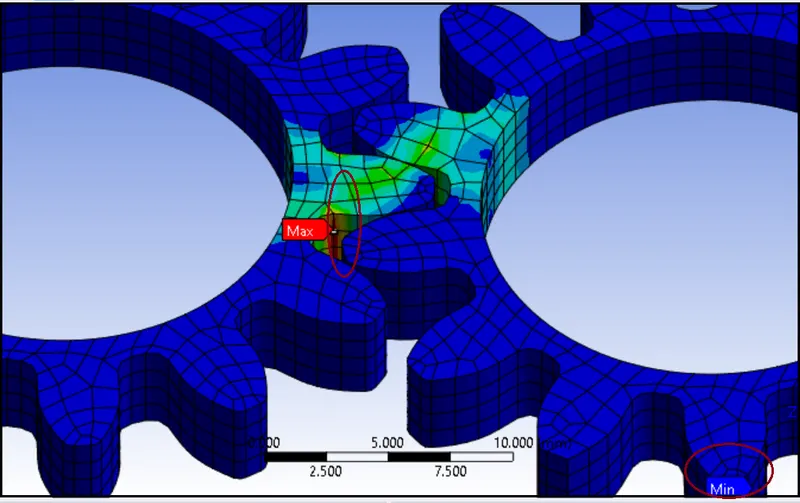
- Stress Intensity graph with time
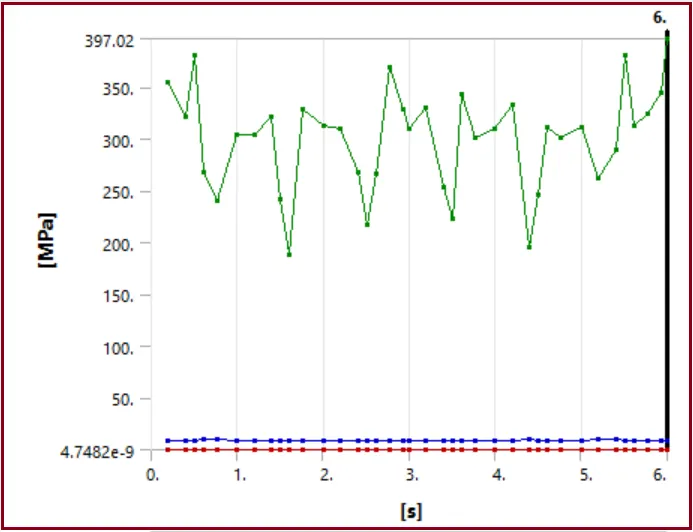
- Detailed Stress Intensity Result:
|
Time (sec) |
Minimum (MPa) |
Maximum (MPa) |
Average (MPa) |
|
0.2 |
6.7248e-008 |
354.64 |
9.022 |
|
0.4 |
1.2685e-008 |
322.11 |
9.13 |
|
0.61 |
7.2808e-007 |
268.38 |
9.6736 |
|
0.7675 |
2.3662e-006 |
239.98 |
9.89 |
|
1. |
5.7619e-008 |
304.68 |
8.9189 |
|
1.505 |
4.8427e-005 |
241.37 |
9.3 |
|
2. |
2.8863e-008 |
312.41 |
8.6784 |
|
2.505 |
7.4261e-006 |
217.12 |
9.135 |
|
3. |
1.2969e-008 |
309.39 |
8.2276 |
|
3.505 |
4.7482e-009 |
223.57 |
9.2033 |
|
4. |
2.9854e-008 |
310.28 |
8.6366 |
|
4.505 |
2.1531e-006 |
246.81 |
9.4065 |
|
5. |
1.576e-007 |
311.22 |
9.1424 |
|
5.505 |
7.8986e-006 |
381.68 |
9.185 |
|
6. |
1.8407e-005 |
397.02 |
8.9238 |
- Contact Status:
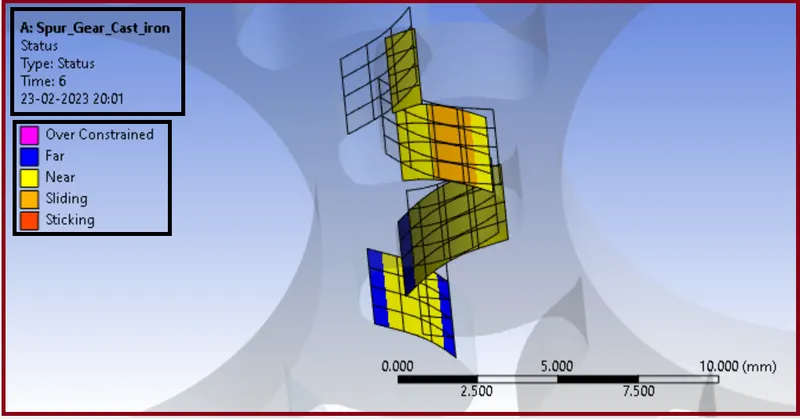
Here we observe sliding as well as sticking at the contact faces.
- Contact Pressure:
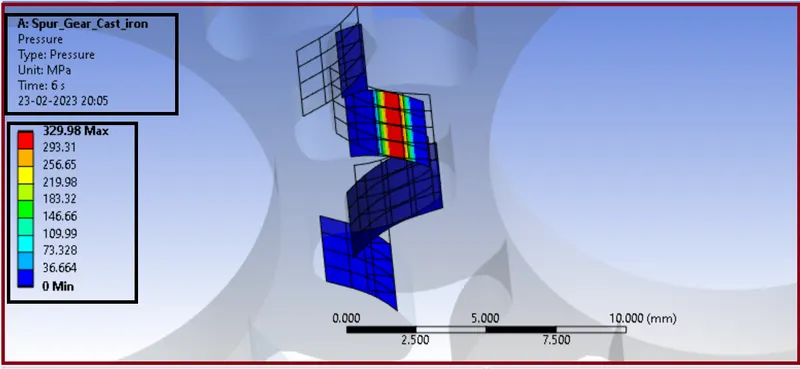
- Pressure graph with time
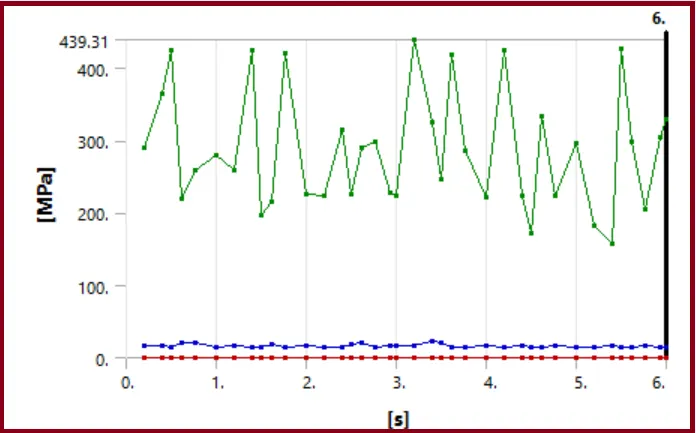
- Detailed Pressure Result:
|
Time (Sec) |
Minimum (MPa) |
Maximum (MPa) |
Average (MPa) |
|
0.2 |
0. |
289.69 |
17.085 |
|
0.4 |
0. |
365.16 |
15.617 |
|
0.61 |
0. |
219.2 |
20.011 |
|
1. |
0. |
280.1 |
15.146 |
|
1.505 |
0. |
196.12 |
15.196 |
|
2. |
0. |
225.64 |
16.338 |
|
2.505 |
0. |
226.36 |
18.301 |
|
3.2 |
0. |
439.31 |
15.989 |
|
3.505 |
0. |
245.81 |
20.369 |
|
4. |
0. |
221.9 |
16.26 |
|
4.505 |
0. |
172.51 |
15.514 |
|
5. |
0. |
296.97 |
15.502 |
|
5.505 |
0. |
426.55 |
15.483 |
|
6. |
0. |
329.98 |
15.514 |
CASE 2: Cast Steel
Here all the process are same we only change the gear model material as shown below…
SOLUTION
All the things are same as previous so, we go for solution
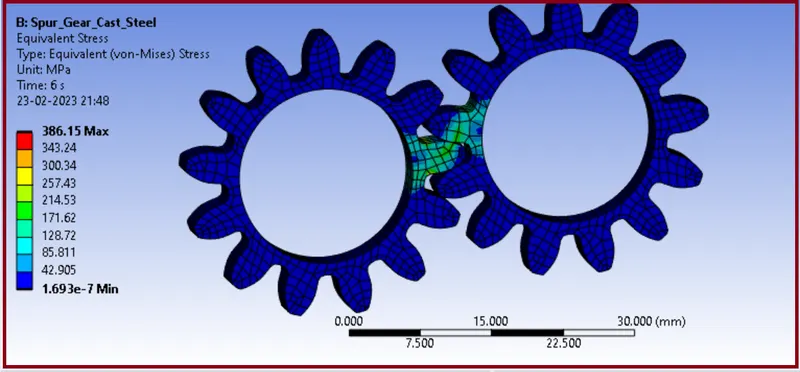
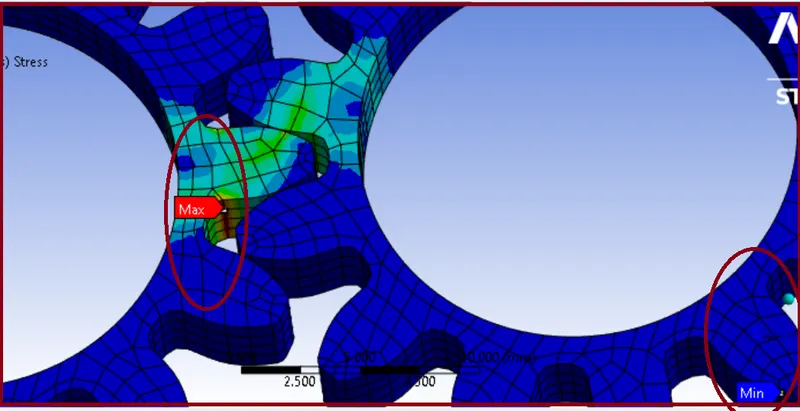
- Equivalent Stress
- Stress vs time plot
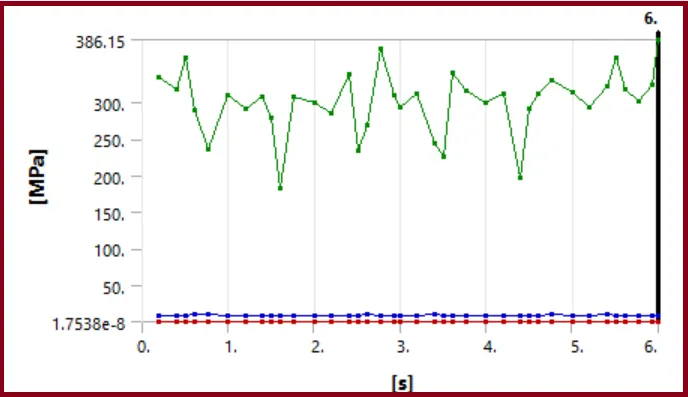
- Detailed Stress Result:
|
Time (Sec) |
Minimum (MPa) |
Maximum (MPa) |
Average (MPa) |
|
0.2 |
1.4701e-007 |
333.83 |
8.3673 |
|
0.4 |
3.0889e-008 |
319.05 |
9.1051 |
|
0.61 |
4.6601e-006 |
290.36 |
10.01 |
|
0.7675 |
9.3755e-007 |
237.12 |
10.29 |
|
1. |
2.2603e-007 |
311.1 |
9.0186 |
|
1.505 |
9.2029e-005 |
279.99 |
8.6216 |
|
2. |
2.5042e-005 |
300.48 |
9.0715 |
|
2.505 |
3.0354e-006 |
233.36 |
8.4641 |
|
3. |
1.7538e-008 |
293.23 |
7.5982 |
|
3.505 |
2.3483e-005 |
224.97 |
8.971 |
|
4. |
3.1599e-005 |
299.59 |
9.0434 |
|
4.505 |
3.5678e-004 |
290.89 |
8.5706 |
|
5. |
2.0027e-007 |
315.02 |
9.1552 |
|
5.505 |
1.2352e-006 |
362.51 |
8.4845 |
|
6. |
1.693e-007 |
386.15 |
8.302 |
- Total Deformation
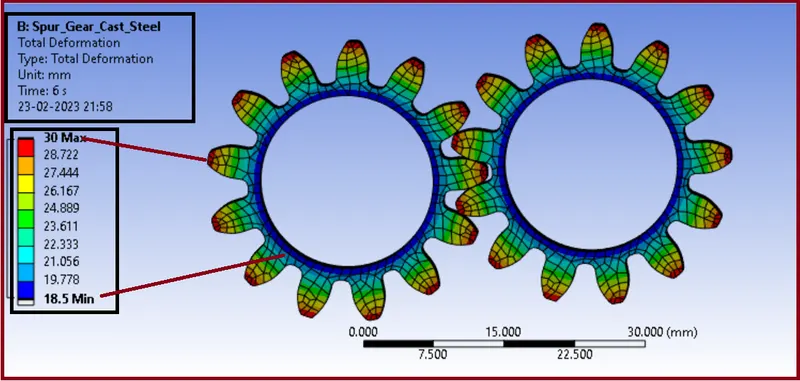
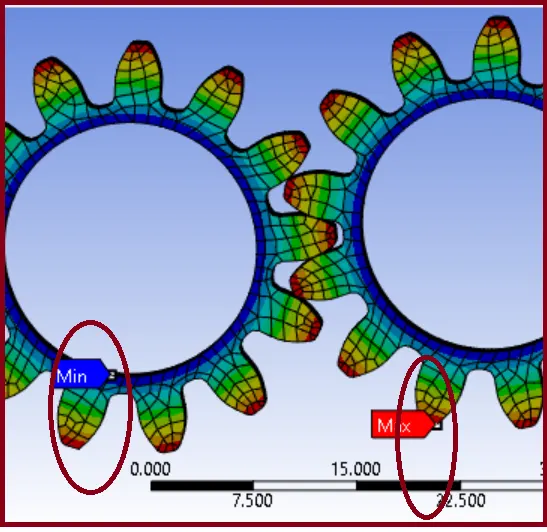
- Deformation graph with time:
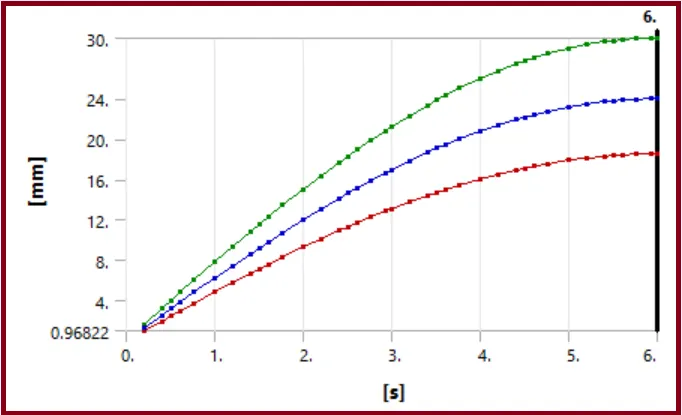
- Detailed Deformation Result:
|
Time (Sec) |
Minimum (mm) |
Maximum (mm) |
Average (mm) |
|
0.2 |
0.96822 |
1.5776 |
1.2588 |
|
0.4 |
1.9338 |
3.1478 |
2.5129 |
|
0.61 |
2.9419 |
4.7876 |
3.8224 |
|
0.7675 |
3.6923 |
6.0038 |
4.7955 |
|
1. |
4.7882 |
7.7732 |
6.2137 |
|
1.505 |
7.102 |
11.535 |
9.2187 |
|
2. |
9.25 |
15.003 |
11.999 |
|
2.505 |
11.281 |
18.307 |
14.637 |
|
3. |
13.081 |
21.221 |
16.97 |
|
3.505 |
14.692 |
23.834 |
19.059 |
|
4. |
16.021 |
25.983 |
20.781 |
|
4.505 |
17.101 |
27.739 |
22.183 |
|
5. |
17.87 |
28.98 |
23.178 |
|
5.505 |
18.345 |
29.75 |
23.794 |
|
6. |
18.5 |
30. |
23.995 |
- Stress Intensity
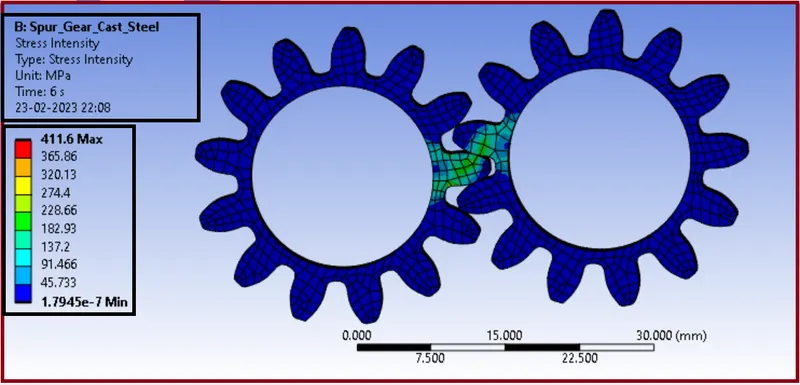
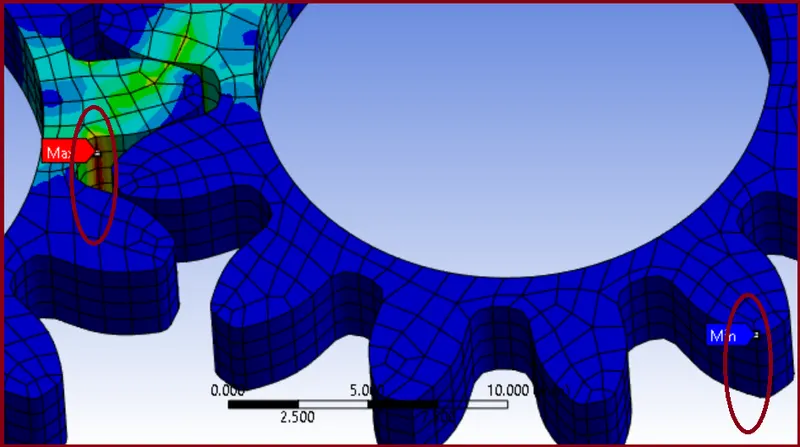
- Stress Intensity graph with time
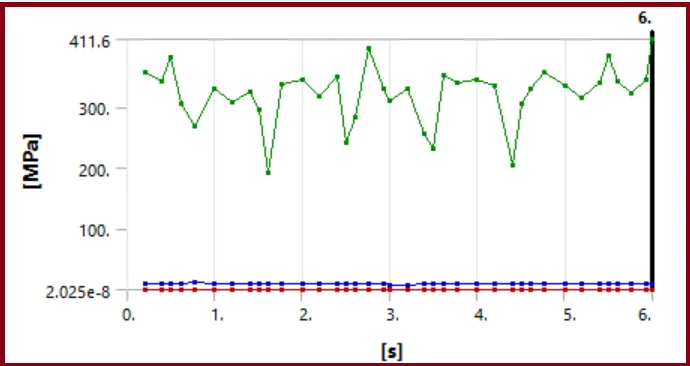
- Detailed Stress Intensity Result:
|
Time (Sec) |
Minimum (MPa) |
Maximum (MPa) |
Average (MPa) |
|
0.2 |
1.5182e-007 |
356.41 |
9.1011 |
|
0.4 |
3.4806e-008 |
343.46 |
9.9014 |
|
0.61 |
5.2298e-006 |
305.42 |
10.915 |
|
0.7675 |
1.0584e-006 |
269.5 |
11.215 |
|
1. |
2.609e-007 |
330.01 |
9.8251 |
|
1.505 |
1.0602e-004 |
294.56 |
9.3932 |
|
2. |
2.5043e-005 |
345.16 |
9.8973 |
|
2.505 |
3.5045e-006 |
241.1 |
9.2192 |
|
3. |
2.025e-008 |
310.93 |
8.2863 |
|
3.505 |
2.5429e-005 |
232.14 |
9.7608 |
|
4. |
3.5022e-005 |
344.13 |
9.8667 |
|
4.505 |
4.0118e-004 |
306.22 |
9.3328 |
|
5. |
2.2686e-007 |
334.18 |
9.9747 |
|
5.505 |
1.3443e-006 |
383.45 |
9.2405 |
|
6. |
1.7945e-007 |
411.6 |
9.0172 |
- Contact Status:
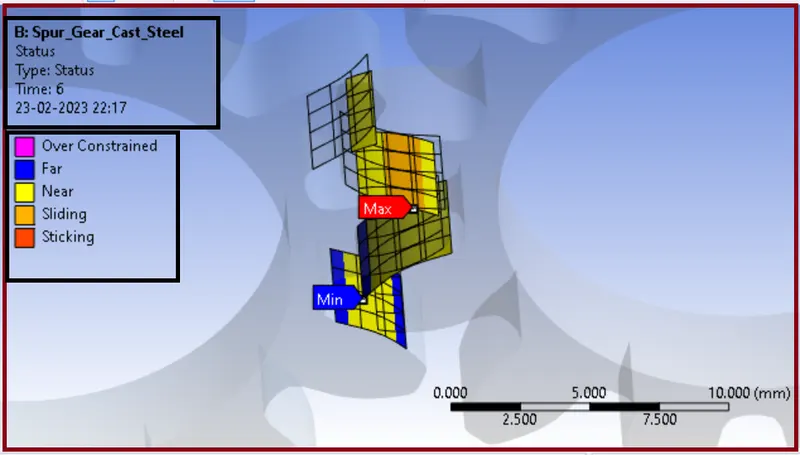
- Contact Pressure:
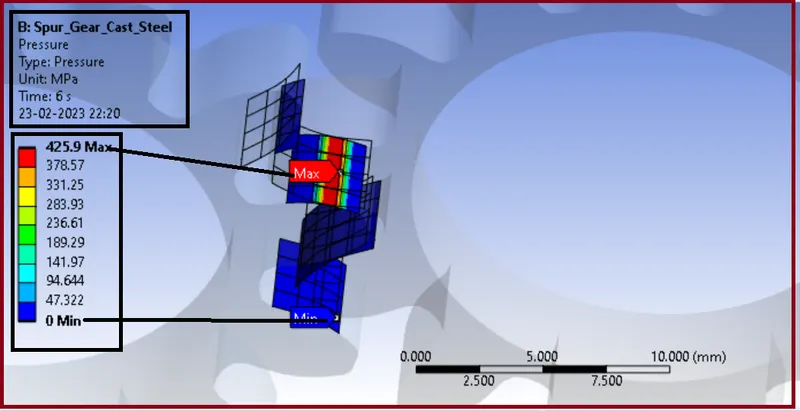
- Pressure graph with time
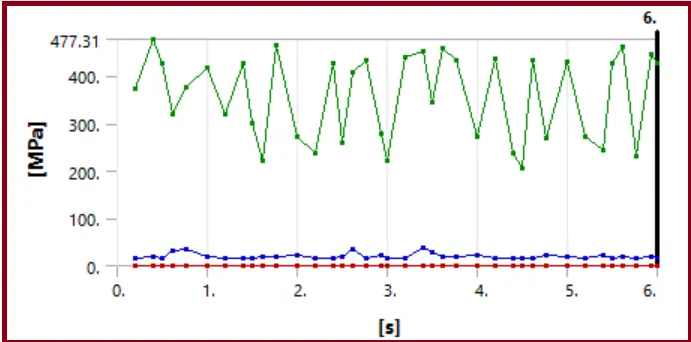
- Detailed Pressure Result:
|
Time (sec) |
Minimum (MPa) |
Maximum (MPa) |
Average (MPa) |
|
0.2 |
0. |
373.39 |
17.043 |
|
0.4 |
0. |
477.31 |
18.932 |
|
0.61 |
0. |
317.9 |
31.542 |
|
0.7675 |
0. |
376.94 |
34.259 |
|
1. |
0. |
418.68 |
19.305 |
|
1.505 |
0. |
301.02 |
15.659 |
|
2. |
0. |
273.27 |
21.95 |
|
2.505 |
0. |
259.85 |
18.119 |
|
3. |
0. |
222.65 |
17.163 |
|
3.505 |
0. |
344.59 |
28.405 |
|
4. |
0. |
271.65 |
21.963 |
|
4.505 |
0. |
205.29 |
15.222 |
|
5. |
0. |
431.05 |
19.385 |
|
5.505 |
0. |
427.64 |
15.034 |
|
6. |
0. |
425.9 |
15.399 |
CASE 3: Cast Bronze
Here all the process are same we only change the gear model material as shown below…
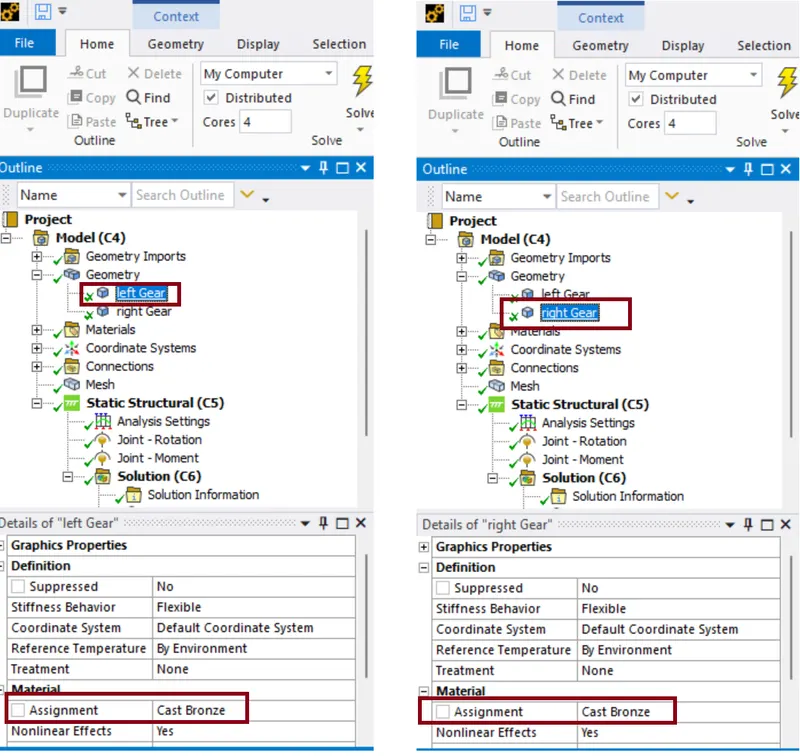
SOLUTION
All the things are same as previous so, we go for solution
- Equivalent Stress
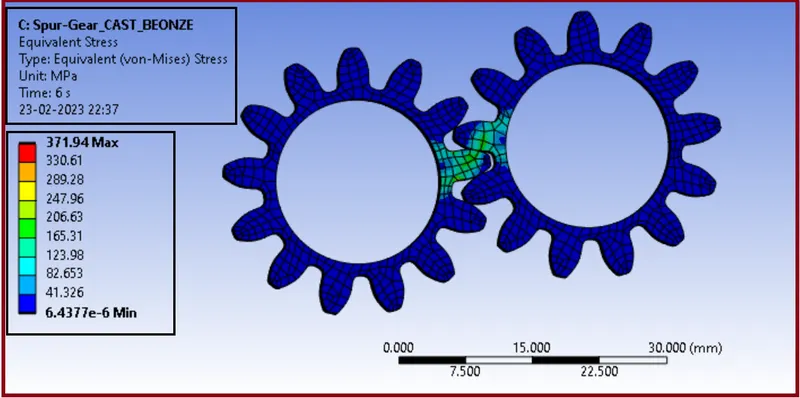
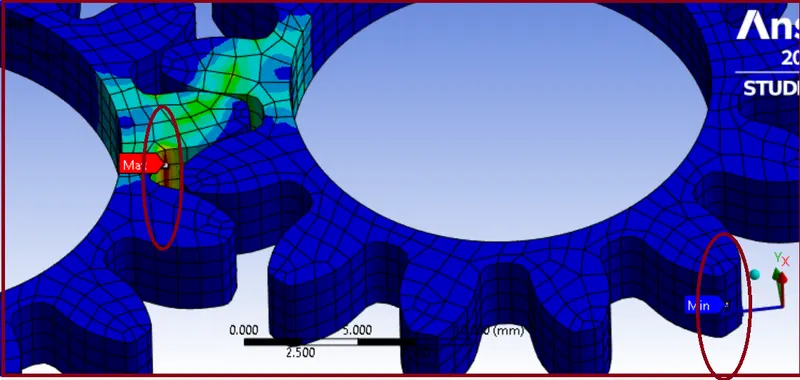
- Stress vs time plot
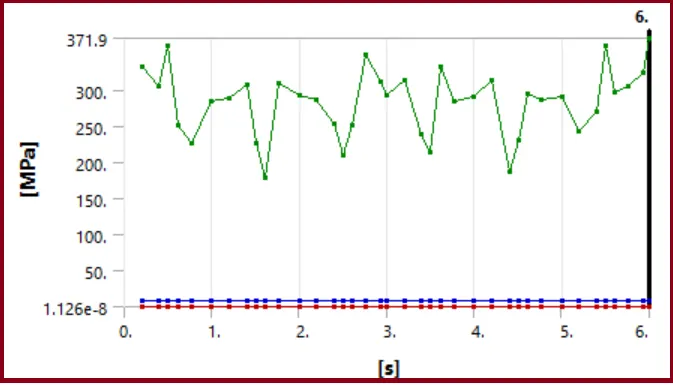
- Detailed Stress Result:
|
Time (Sec) |
Minimum (MPa) |
Maximum (MPa) |
Average (MPa) |
|
0.2 |
1.7171e-008 |
333.08 |
8.3617 |
|
0.4 |
1.652e-008 |
305.09 |
8.4516 |
|
0.61 |
7.9757e-007 |
251.77 |
8.858 |
|
0.7675 |
2.8111e-006 |
225.54 |
9.046 |
|
1. |
1.0162e-007 |
285.56 |
8.2402 |
|
1.505 |
4.5552e-005 |
227.06 |
8.5751 |
|
2. |
4.1504e-008 |
294. |
8.0228 |
|
2.505 |
1.2194e-007 |
208.87 |
8.4442 |
|
3. |
2.9173e-008 |
292.85 |
7.6051 |
|
3.505 |
1.1262e-008 |
214.79 |
8.5051 |
|
4. |
3.2716e-008 |
291.91 |
7.9844 |
|
4.505 |
5.9733e-007 |
231.66 |
8.6871 |
|
5. |
3.102e-007 |
291.58 |
8.4474 |
|
5.505 |
7.4766e-006 |
361.81 |
8.5122 |
|
6. |
6.4377e-006 |
371.94 |
8.3006 |
- Total Deformation
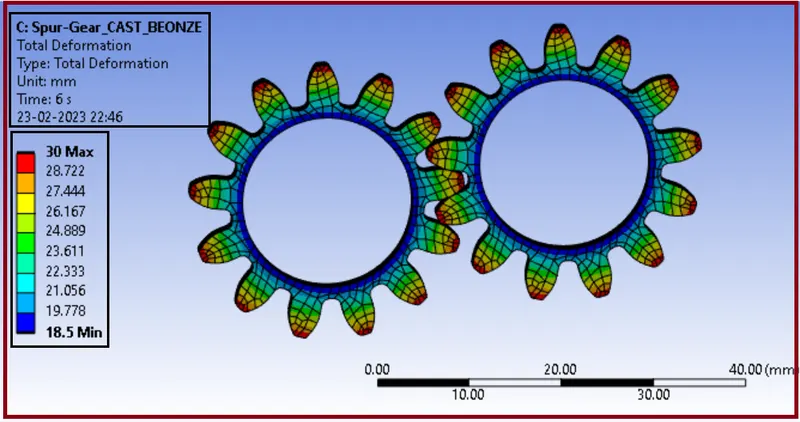
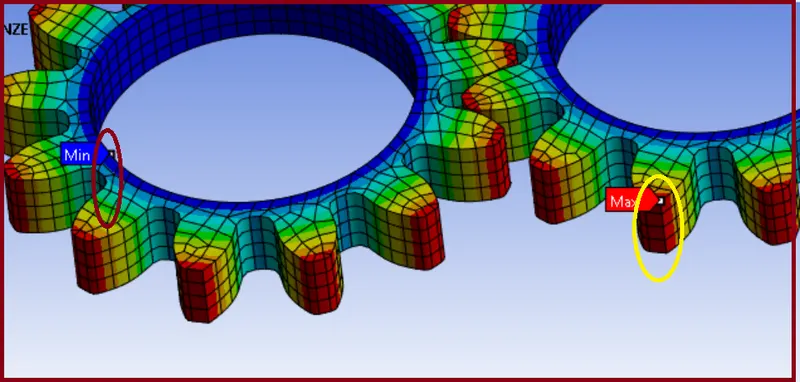
- Deformation graph with time:
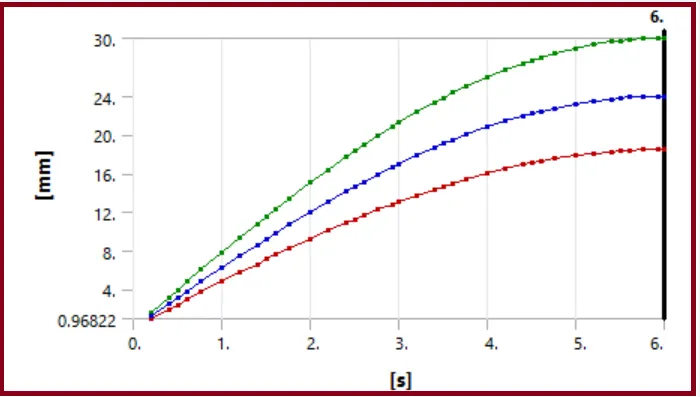
- Detailed Deformation Result:
|
Time (Sec) |
Minimum (mm) |
Maximum (mm) |
Average (mm) |
|
0.2 |
0.96822 |
1.6018 |
1.2686 |
|
0.4 |
1.9338 |
3.1722 |
2.5227 |
|
0.61 |
2.9419 |
4.8008 |
3.8277 |
|
0.7675 |
3.6923 |
6.0174 |
4.8009 |
|
1. |
4.7882 |
7.7944 |
6.2222 |
|
1.505 |
7.102 |
11.549 |
9.2241 |
|
2. |
9.25 |
15.022 |
12.006 |
|
2.505 |
11.281 |
18.319 |
14.642 |
|
3. |
13.081 |
21.237 |
16.976 |
|
3.505 |
14.692 |
23.843 |
19.063 |
|
4. |
16.021 |
25.994 |
20.785 |
|
4.505 |
17.101 |
27.745 |
22.186 |
|
5. |
17.87 |
28.986 |
23.18 |
|
5.505 |
18.345 |
29.754 |
23.796 |
|
6. |
18.5 |
30. |
23.995 |
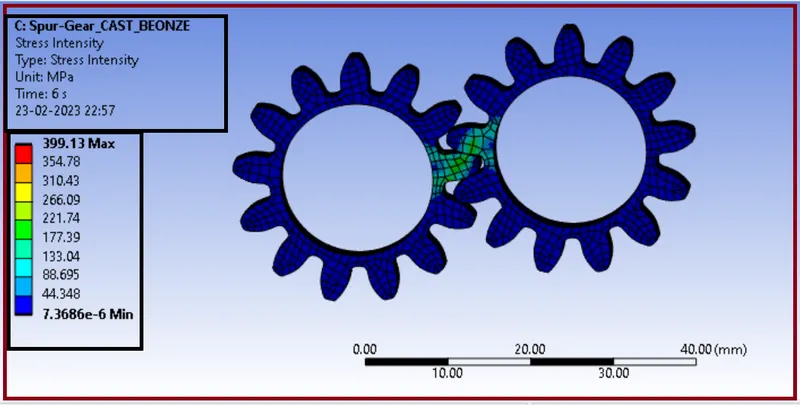
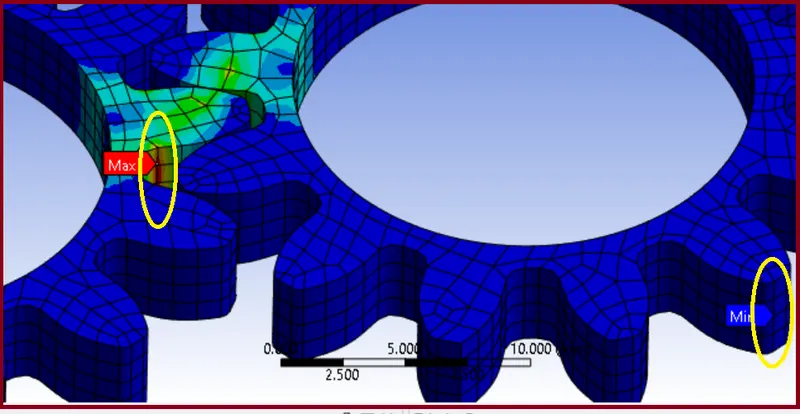
- Stress Intensity:
- Stress Intensity graph with time
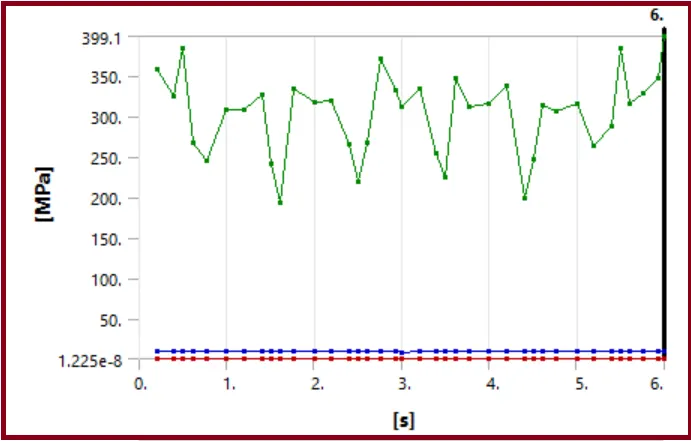
- Detailed Stress Intensity Result:
|
Time (Sec) |
Minimum (MPa) |
Maximum (MPa) |
Average (MPa) |
|
0.2 |
1.8917e-008 |
357.89 |
9.1199 |
|
0.4 |
1.8239e-008 |
325.17 |
9.2224 |
|
0.61 |
8.4361e-007 |
267.68 |
9.68 |
|
0.7675 |
2.8353e-006 |
244.81 |
9.885 |
|
1. |
1.141e-007 |
308.88 |
9.0071 |
|
1.505 |
5.0405e-005 |
241.7 |
9.3695 |
|
2. |
4.7713e-008 |
317.16 |
8.7817 |
|
2.505 |
1.3756e-007 |
218.28 |
9.2212 |
|
3. |
3.364e-008 |
312.55 |
8.3128 |
|
3.505 |
1.2252e-008 |
223.85 |
9.2846 |
|
4. |
3.7759e-008 |
314.92 |
8.7397 |
|
4.505 |
6.2732e-007 |
246.76 |
9.4918 |
|
5. |
3.5217e-007 |
315.41 |
9.2336 |
|
5.505 |
8.4768e-006 |
385.11 |
9.2958 |
|
6. |
7.3686e-006 |
399.13 |
9.0422 |
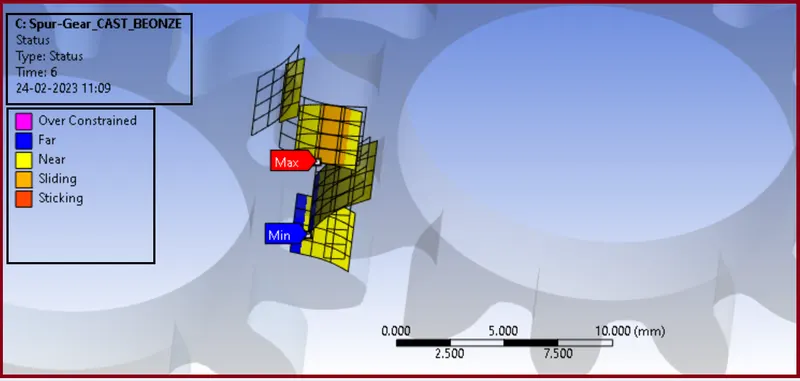
- Contact Status:
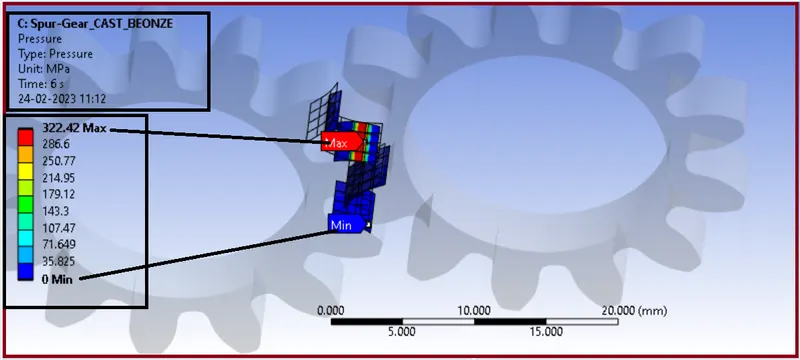
- Contact Pressure:
- Pressure graph with time
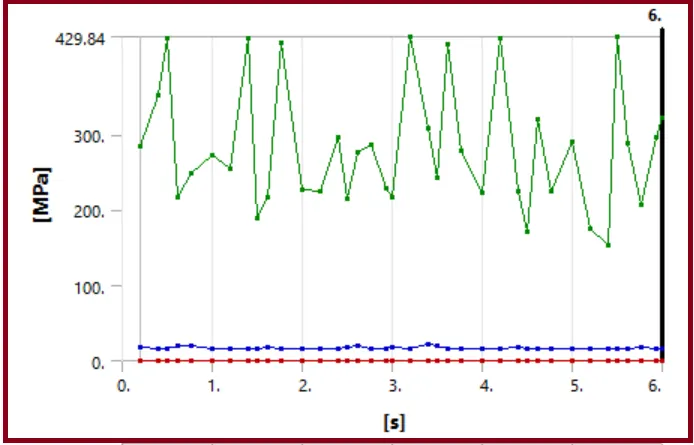
- Detailed Pressure Result:
|
Time (Sec) |
Minimum (MPa) |
Maximum (MPa) |
Average (MPa) |
|
0.2 |
0. |
284.18 |
17.023 |
|
0.4 |
0. |
352.4 |
15.617 |
|
0.61 |
0. |
216.14 |
19.153 |
|
0.7675 |
0. |
248.83 |
19.928 |
|
1. |
0. |
272.85 |
15.08 |
|
1.505 |
0. |
188.64 |
15.167 |
|
2. |
0. |
226.29 |
16.274 |
|
2.505 |
0. |
214.97 |
18.345 |
|
3. |
0. |
215.94 |
17.05 |
|
3.2 |
0. |
429.84 |
15.944 |
|
4. |
0. |
222.37 |
16.196 |
|
4.505 |
0. |
171.12 |
15.478 |
|
5. |
0. |
289.97 |
15.431 |
|
5.505 |
0. |
429.2 |
15.444 |
|
6. |
0. |
322.42 |
15.528 |
Comparing the result
|
CASE |
Max. Equivalent (von mises) stress [MPa] |
Max. Total Deformation [mm] |
Max. Stress Intensity [MPa] |
|
Cast Iron (ductile) |
374.86 |
30 |
397.02 |
|
Cast Steel |
386.15 |
30 |
411.6 |
|
Cast Bronze |
371.94 |
30 |
399.13 |
CONCLUSION:
- As per above results, we can observe that Cast Iron (Ductile) material has lowest stress and stress intensity. Cast iron is a type of metal that is commonly used in the manufacturing of gears due to its durability, strength, and wear-resistant properties. Ductile cast iron, also known as nodular cast iron, is a type of cast iron that has been treated with magnesium to create spherical graphite nodules within the material, giving it enhanced ductility and toughness.
- Spur gears are one of the most commonly used types of gears and are characterized by their teeth that run parallel to the gear's axis. Spur gears can be made from a variety of materials, including cast iron (ductile).
- Ductile cast iron spur gears are commonly used in applications where high torque and strength are required, such as in heavy machinery, construction equipment, and automotive transmissions.
- So, from the above analysis stand point we can choose Cast Iron (ductile) or Cast Bronze as a material for gears.
*********************************************************************************************************************************************************************************************************************************************************************************END
Thanks & regards,
Devesh kashyap