Week 1- Mixing Tee
AIM: To set up steady-state simulations to compare the mixing effectiveness for two different versions of mixing tee.
To test k-epsilon and k-omega turbulence models and determine why that model suits our simulation process.
To determine the effect of length on mixing effectiveness.
WORKFLOW:
PREPARATION OF GEOMETRY:
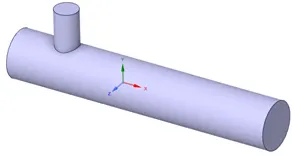
Short mixing tee
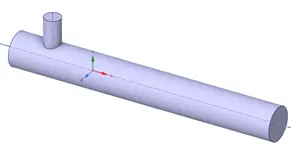
Long mixing tee
PREPARATION OF MESH:
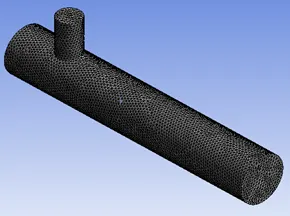
Short mixing tee
Element size = 1.2e-003 m
Total number of elements = 368452
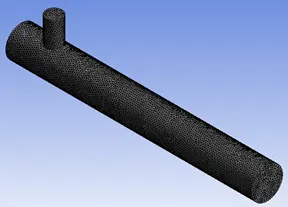
Long mixing tee
Element size = 1.2e-003 m
Total number of elements = 506080
SETUP AND SOLUTION:
CASE I: Short mixing tee
Hot inlet air velocity = 3 m/s
Momentum ratio = 2
Cold inlet air velocity = 6 m/s
Hot air temperature = 36 C
Cold air temperature = 19°C
Turbulence model = k-epsilon
Solver = Pressure-based
Velocity Formulation = Absolute
Time = Steady-State
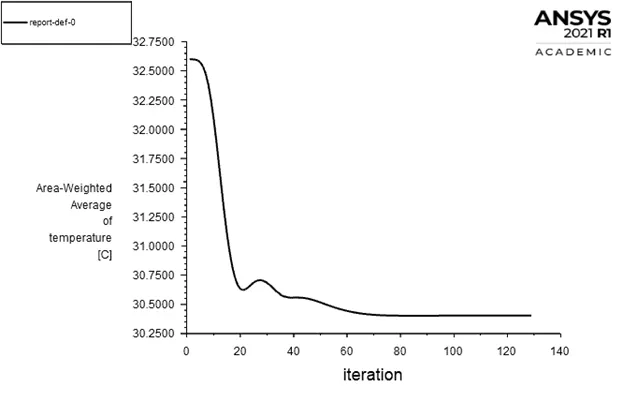
Definitions: Area-weighted-average = Temperature at outlet
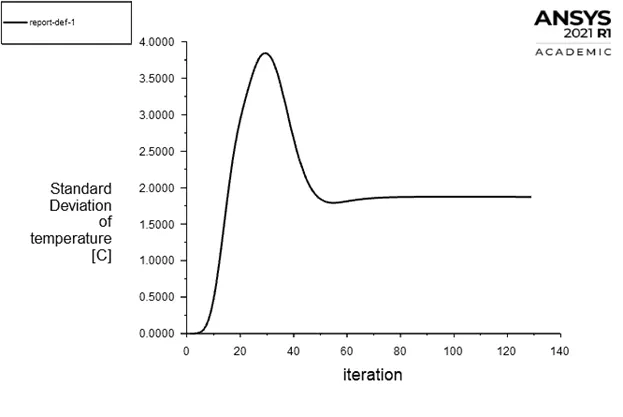
Standard-Deviation = Temperature at outlet
RESULTS:
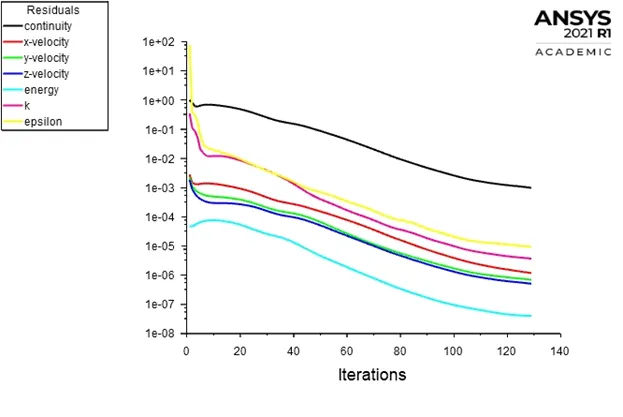
Number of iterations for convergence = 131
Residuals
Average outlet temperature = 30.4C
Standard deviation of temperature at outlet = 1.82C
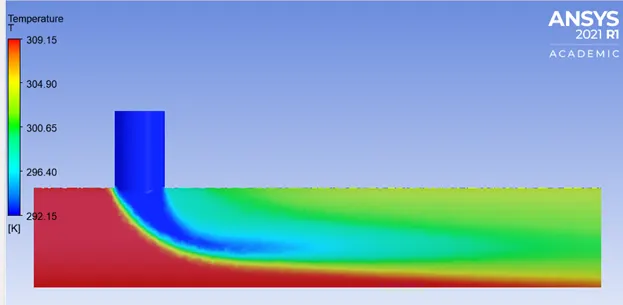
CONTOUR PLOTS:
Temperature distribution
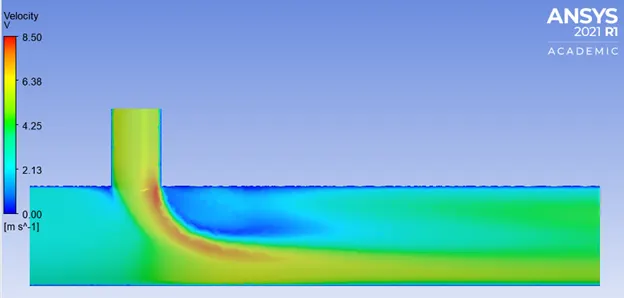
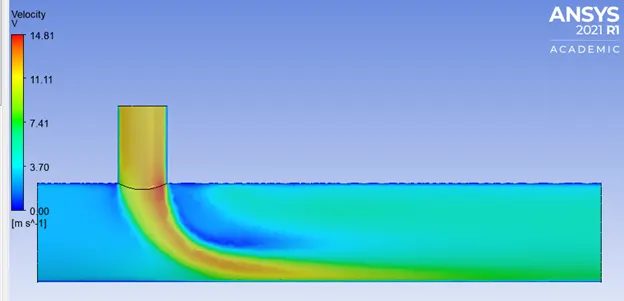
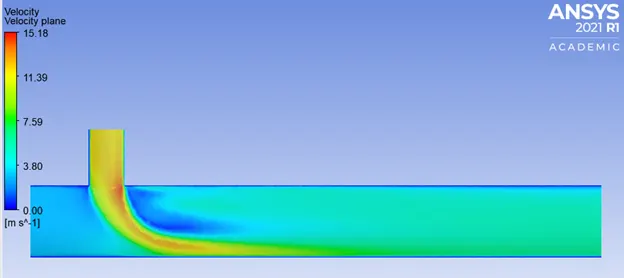
Velocity distribution
CASE II: Short mixing tee
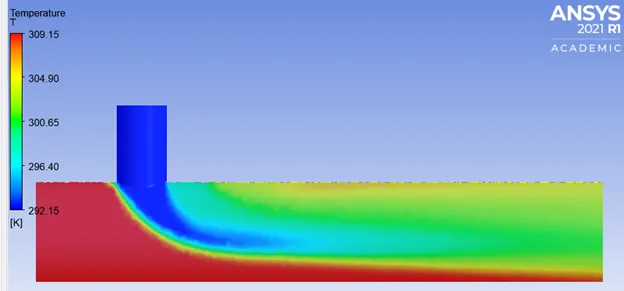
We change the turbulence model to k-omega and all the other configurations are kept same to determine which model suits best for our case.
Hot inlet air velocity = 3 m/s
Momentum ratio = 2
Cold inlet air velocity = 6 m/s
Hot air temperature = 36C
Cold air temperature = 19C
Turbulence model = k-omega
Solver = Pressure-based
Velocity Formulation = Absolute
Time = Steady-State
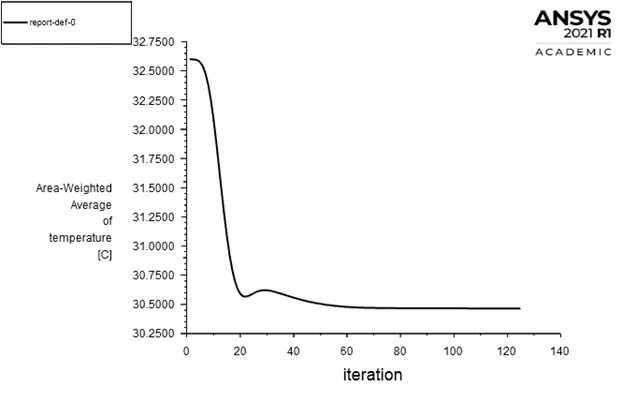
Definitions: Area-weighted-average = Temperature at outlet
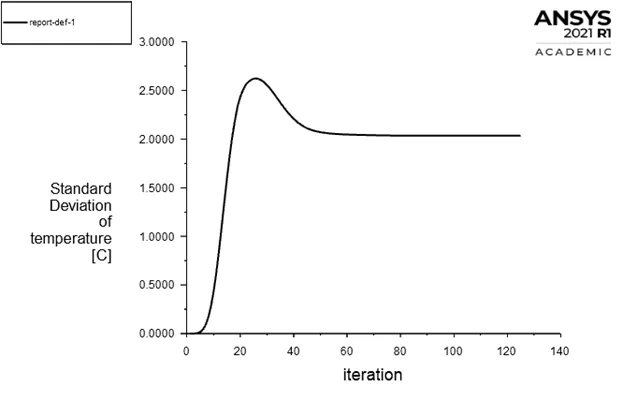
Standard-Deviation = Temperature at outlet
RESULTS:
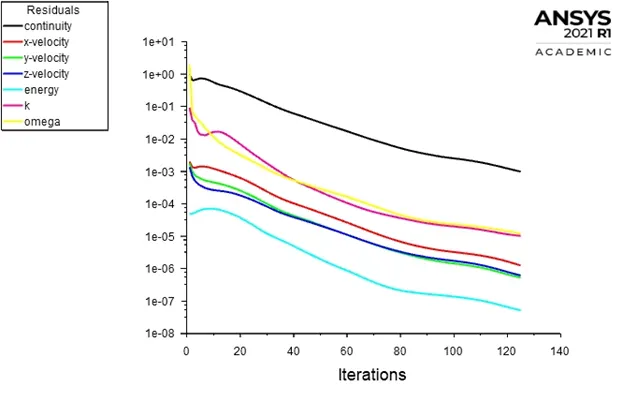
Number of iterations for convergence = 126
Residuals
Average temperature at outlet = 30.51C
Standard deviation of temperature at outlet = 2.0C
CONTOUR PLOTS:
Temperature distribution
Velocity distribution
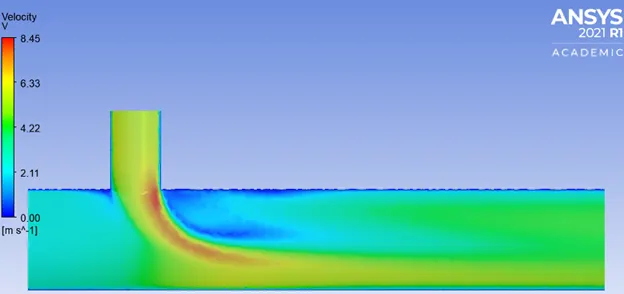
k-epsilon model is used to predict flow in regions away from the wall, whereas k-omega SST model is used to predict flow in near wall regions.
CASE III: Short mixing tee
Hot inlet air velocity = 3 m/s
Momentum ratio = 4
Cold inlet air velocity = 12 m/s
Hot air temperature = 36C
Cold air temperature = 19C
Turbulence model = k-epsilon
Solver = Pressure-based
Velocity Formulation = Absolute
Time = Steady-State
Definitions: Area-weighted-average = Temperature at outlet
Standard-Deviation = Temperature at outlet
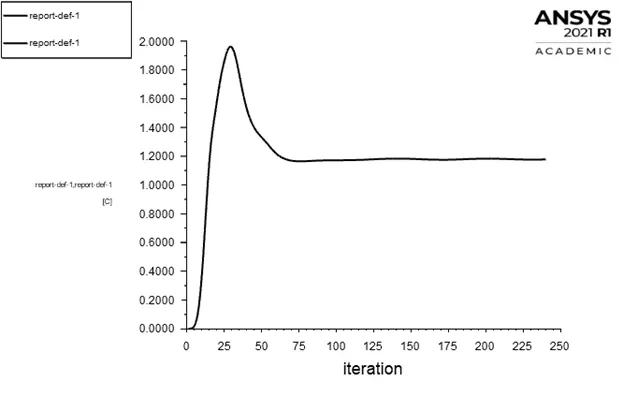
RESULTS:
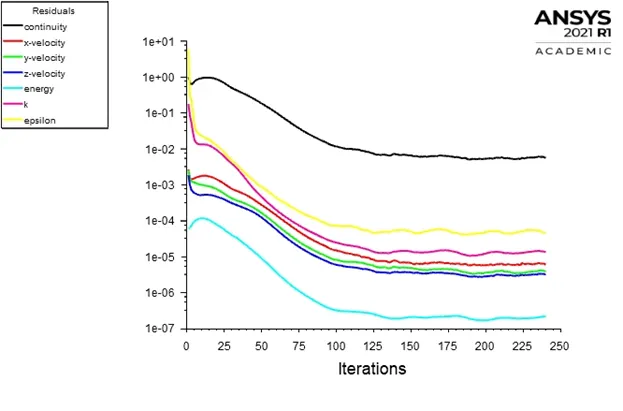
Number of iterations for convergence = 242
Residuals
Average temperature at outlet = 27.56C
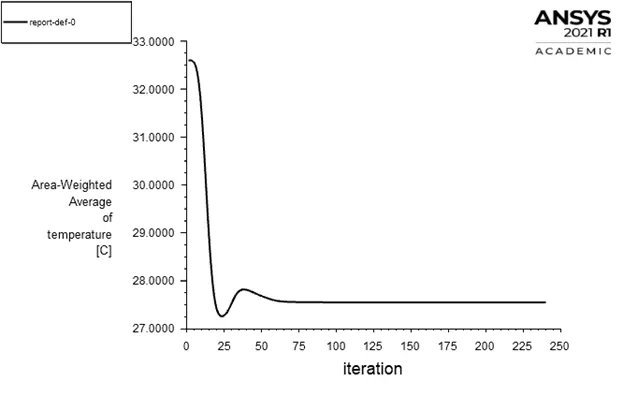
Standard deviation of temperature at outlet = 2.2C
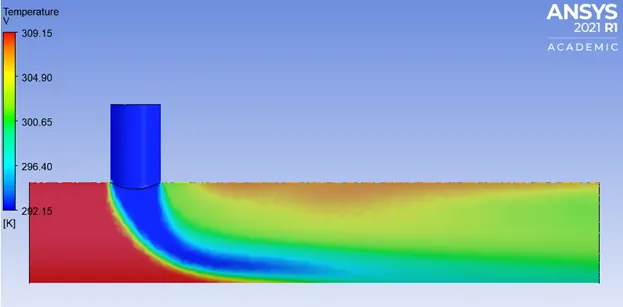
CONTOUR PLOTS:
Temperature distribution
Velocity distribution
CASE IV: Long mixing tee
Hot inlet air velocity = 3 m/s
Momentum ratio = 2
Cold inlet air velocity = 6 m/s
Hot air temperature = 36 C
Cold air temperature = 19 C
Turbulence model = k-epsilon
Solver = Pressure-based
Velocity Formulation = Absolute
Time = Steady-State
Definitions: Area-weighted-average = Temperature at outlet
Standard-Deviation = Temperature at outlet
RESULTS:
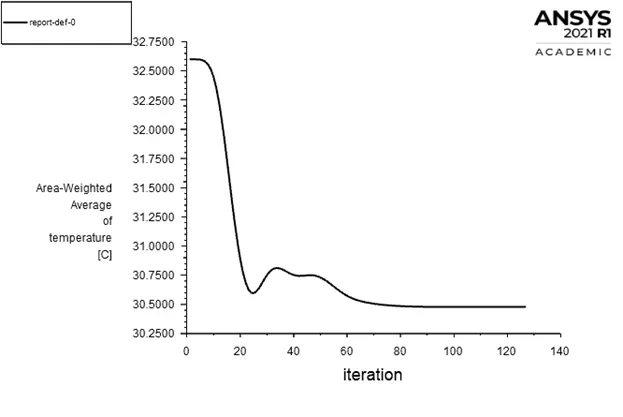
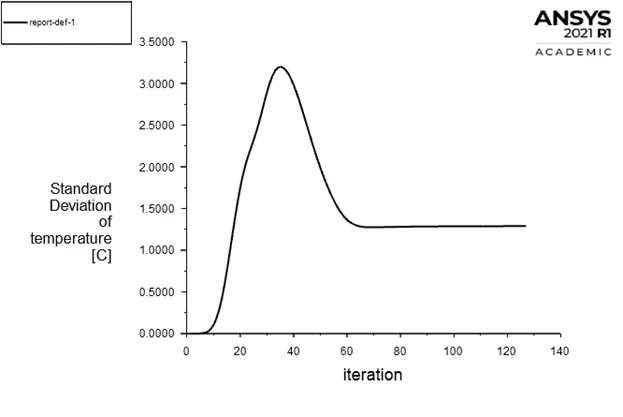
Number of iterations for convergence = 127
Residuals
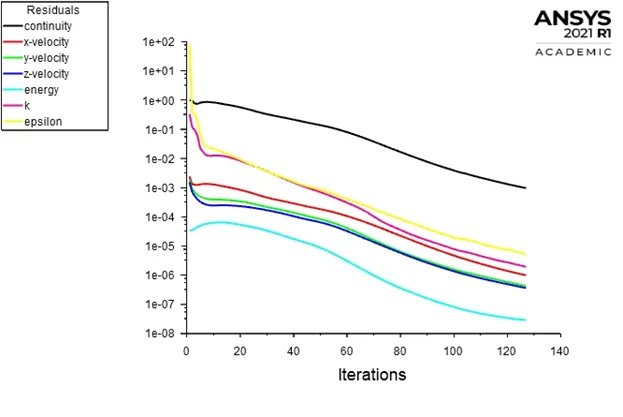
Average temperature at outlet = 30.42C
Standard deviation of temperature at outlet = 1.3C
CONTOUR PLOTS:
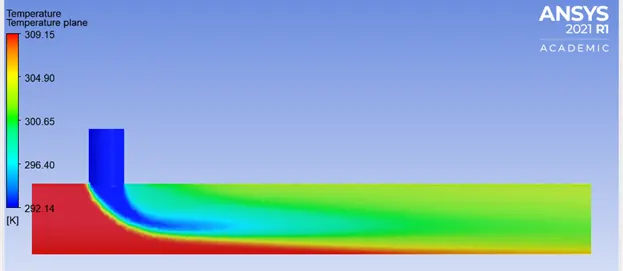
Temperature distribution
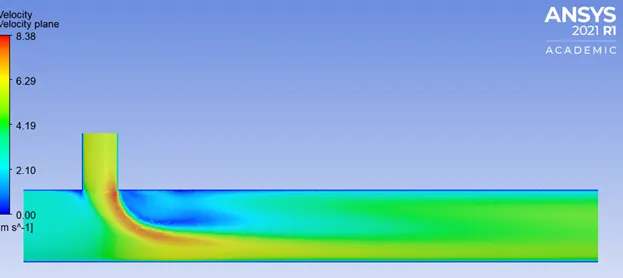
Velocity distribution
CASE V: Long mixing tee
Hot inlet air velocity = 3 m/s
Momentum ratio = 4
Cold inlet air velocity = 12 m/s
Hot air temperature = 36C
Cold air temperature = 19C
Turbulence model = k-epsilon
Solver = Pressure-based
Velocity Formulation = Absolute
Time = Steady-State
Definitions: Area-weighted-average = Temperature at outlet
Standard-Deviation = Temperature at outlet
RESULTS:
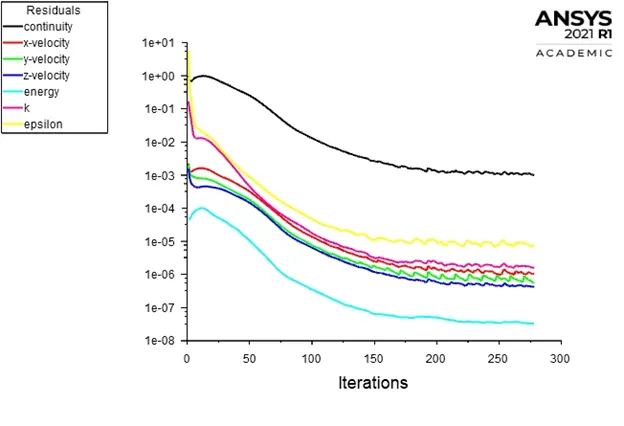
Number of iterations for convergence = 276
Residuals
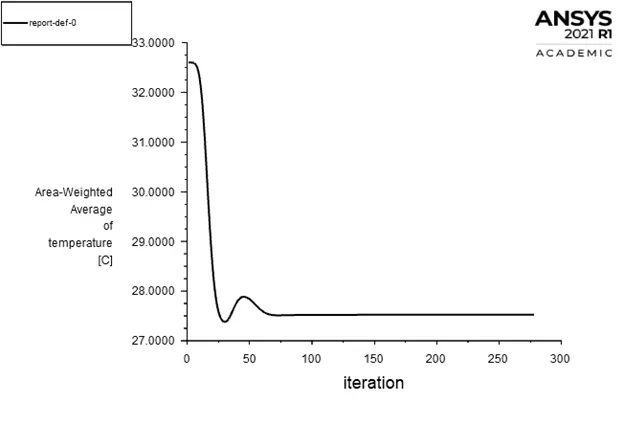
Average temperature at outlet = 27.56C
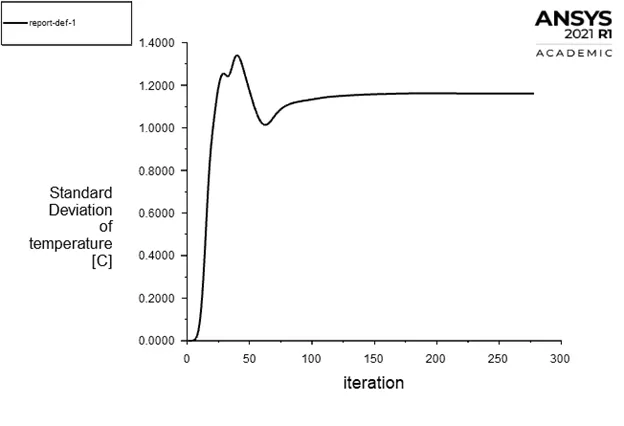
Standard deviation of temperature at outlet = 1.2C
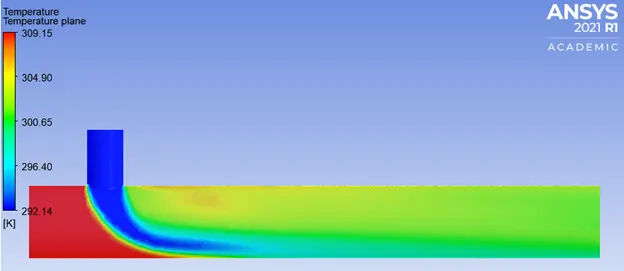
CONTOUR PLOTS:
Temperature distribution
Velocity distribution
OBSERVATIONS:
- When the momentum ratio is higher, the average outlet temperature is lower.
- The average outlet temperature does not depend much on the length of the mixing tee.
- The standard deviation of temperature is not much affected by the changes in momentum ratio and length of the mixing tee.
OBSERVATION TABLE:
|
Short mixing tee |
Long mixing tee |
||||
|
(k-epsilon) |
(k-omega) |
(k-epsilon) |
(k-epsilon) |
(k-epsilon) |
|
|
Momentum ratio=2 |
Momentum ratio=2 |
Momentum ratio=4 |
Momentum ratio=2 |
Momentum ratio=4 |
|
|
Element size |
1.2e-003 m |
1.2e-003 m |
1.2e-003 m |
1.2e-003 m |
1.2e-003 m |
|
Cell count |
318215 |
368452 |
368452 |
506080 |
506080 |
|
Average outlet temperature |
30.4C |
30.51C |
27.56C |
30.42C |
27.56C |
|
Standard deviation of temperature |
1.82C |
2.0C |
2.2C |
1.3C |
1.2C |
|
Number of iterations for convergence |
131 |
126 |
242 |
127 |
276 |