Week 1- Mixing Tee
1. Aim:
To study mixing effectiveness between hot and cold fluid at T junction at steady state condition
2. Introduction:
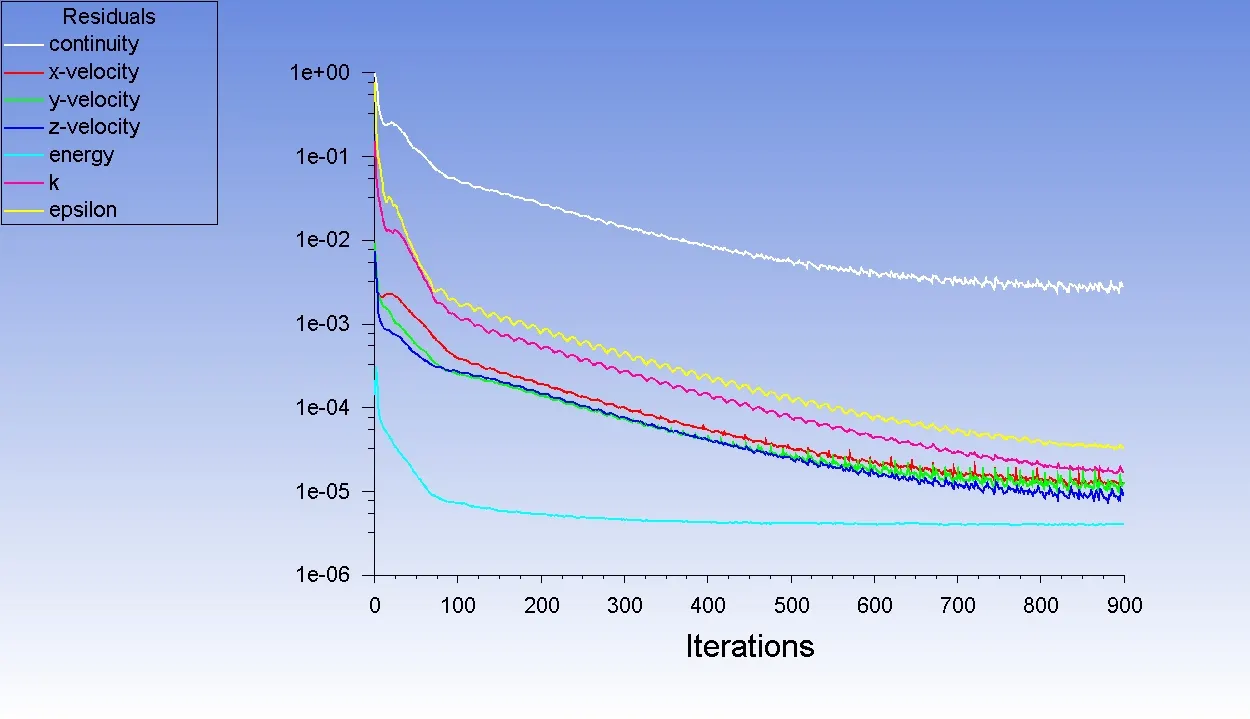
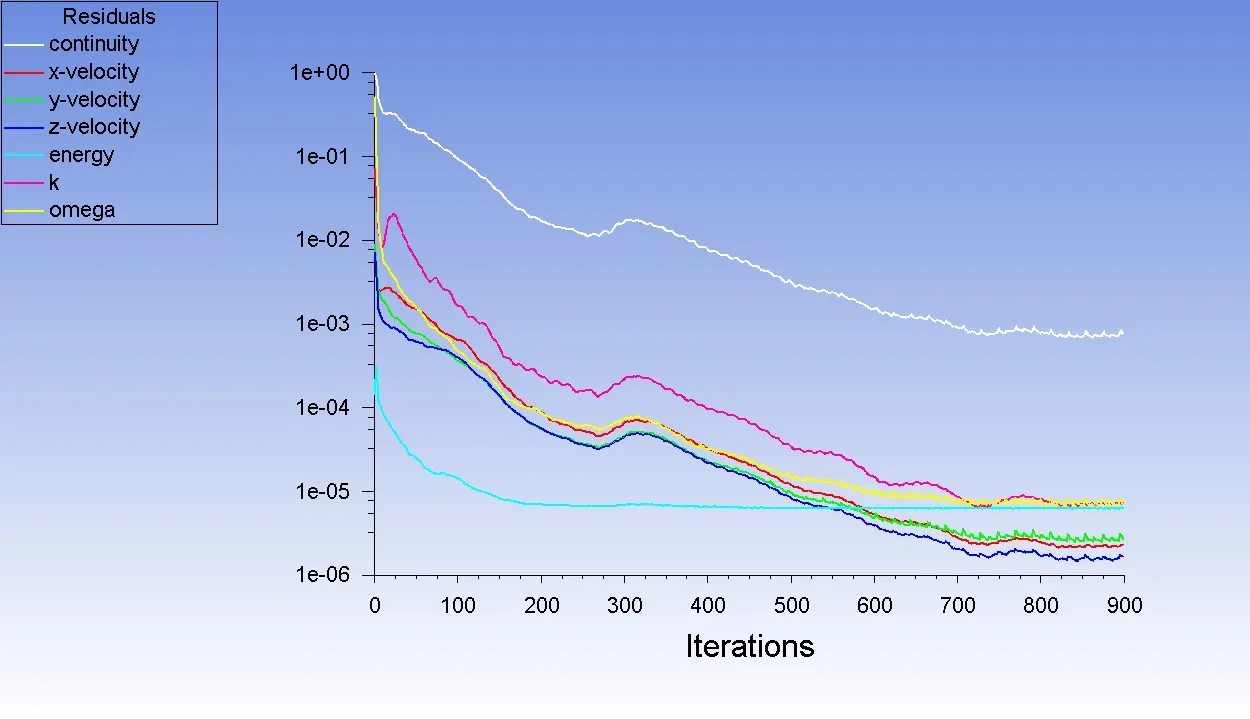
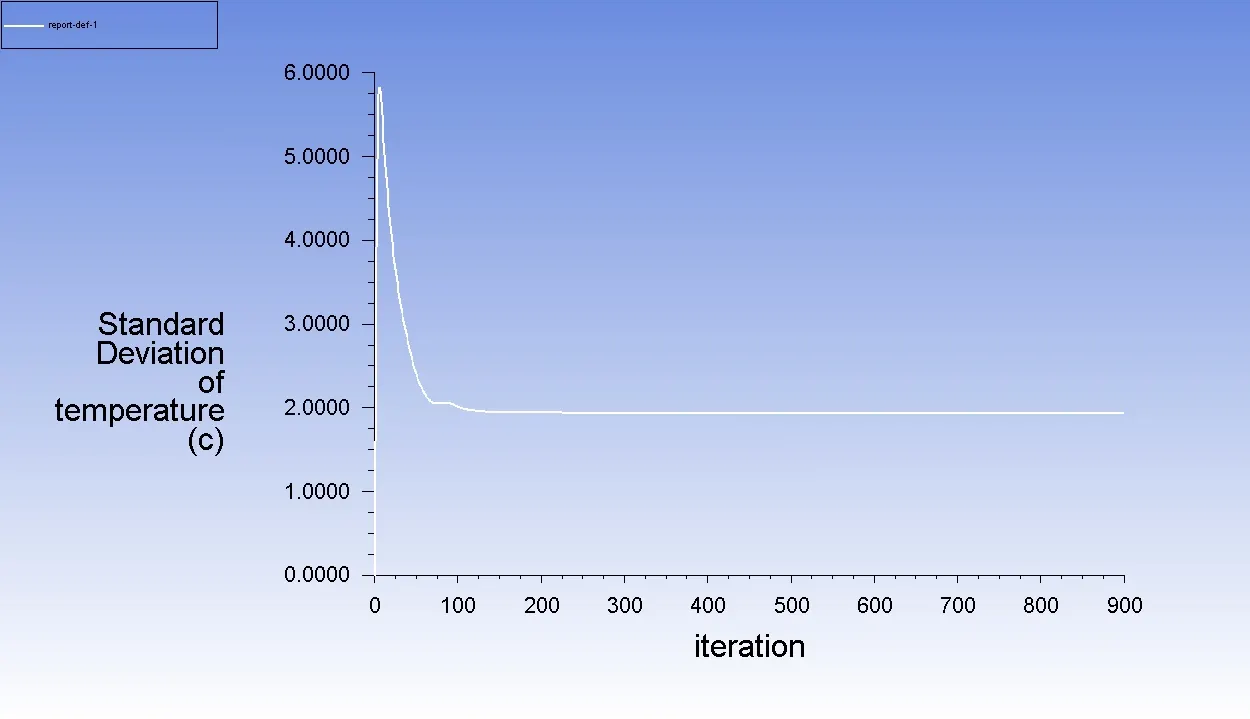
To study steady state fluid flow thermal mixing using different turbulence models i.e. k epsilon and k omega SSt model. Two different geometries short and long pipe will be used to understand the effect of length on thermal mixing effectiveness. For that, stnadard deviation of temperature will be computed. Simulations will be perfomed till convergence.
3. Theory
Two fluids at hot and cold temperature mix at T junction which leads to change in fluid velocity and temperature downstream.
Tmix = (mhTh + mcTc)/(mh + mc)
where mh = mass of hot fluid
Th = temp of hot fluid
mc = mass of cold fluid
Tc = temp of cold fluid
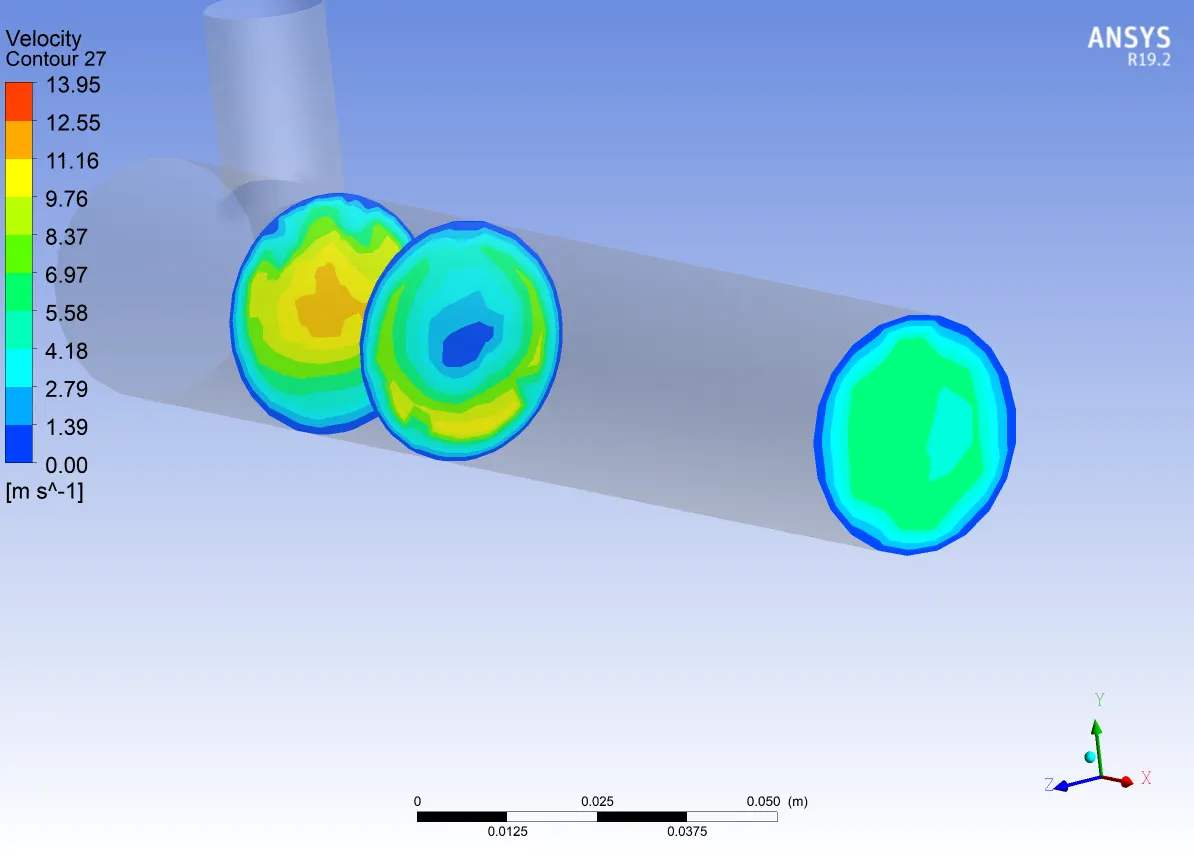
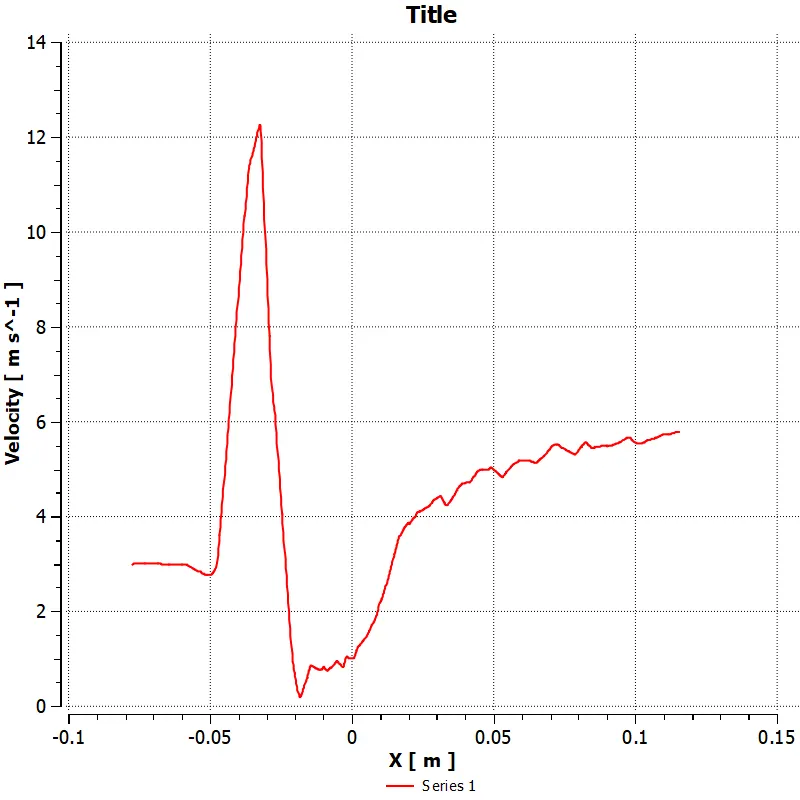
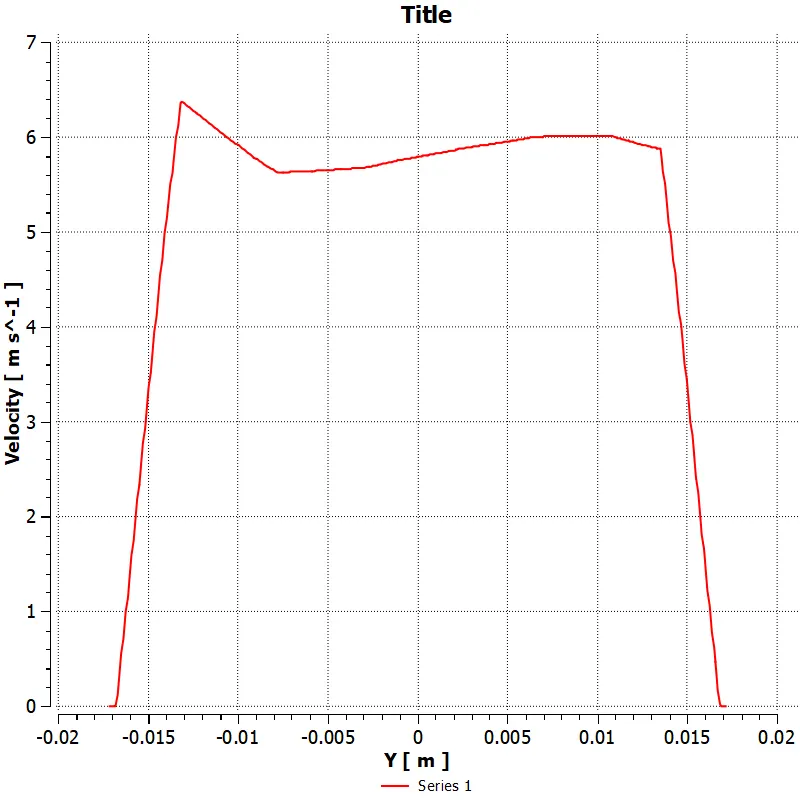
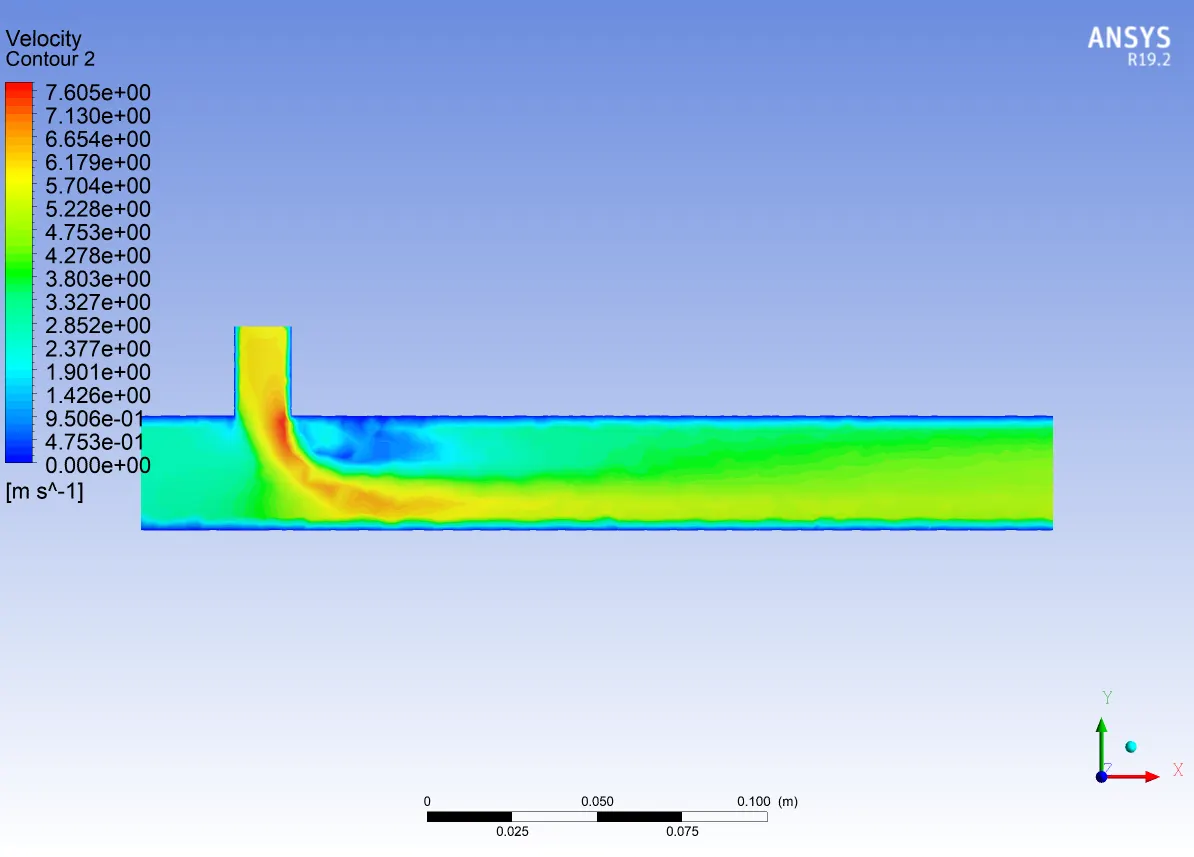
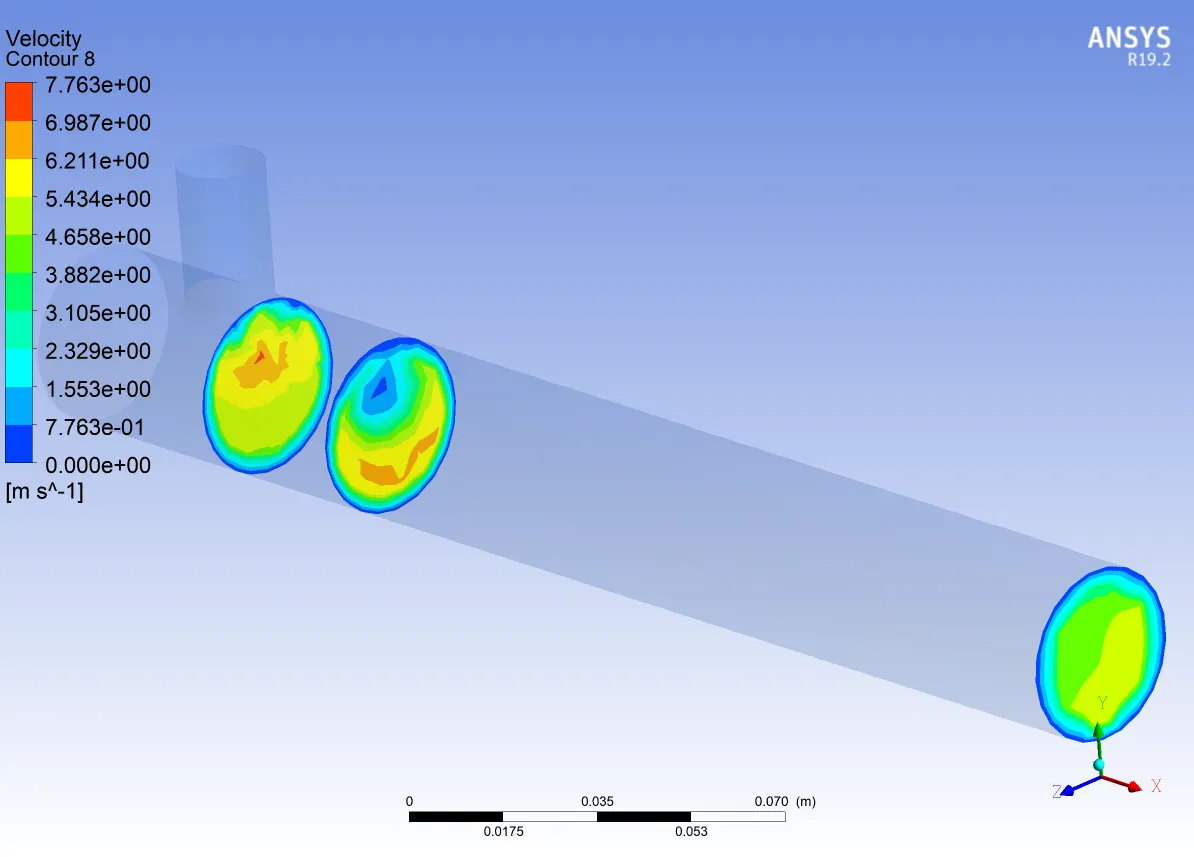
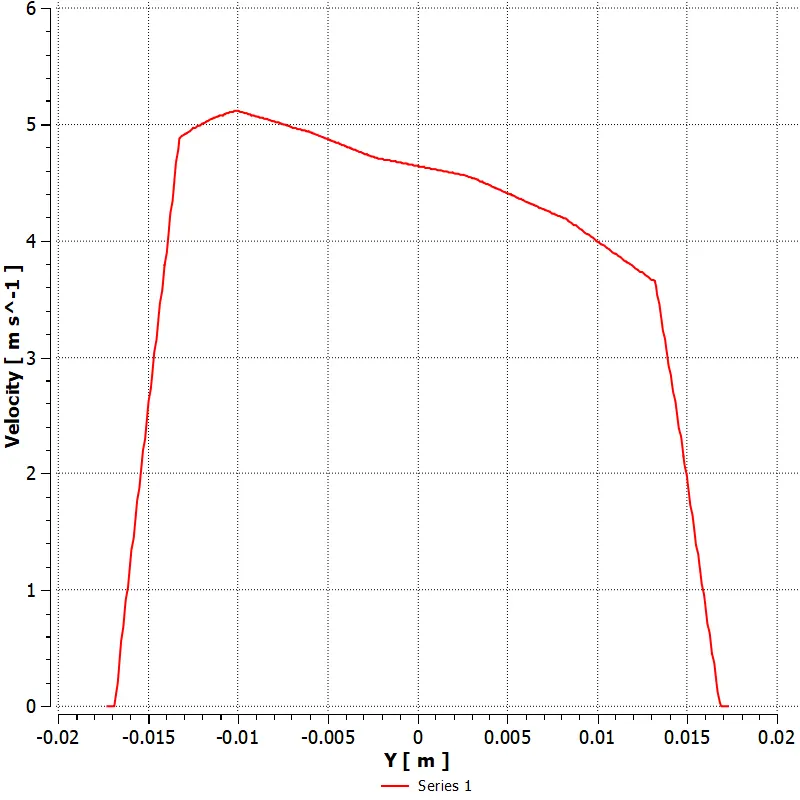
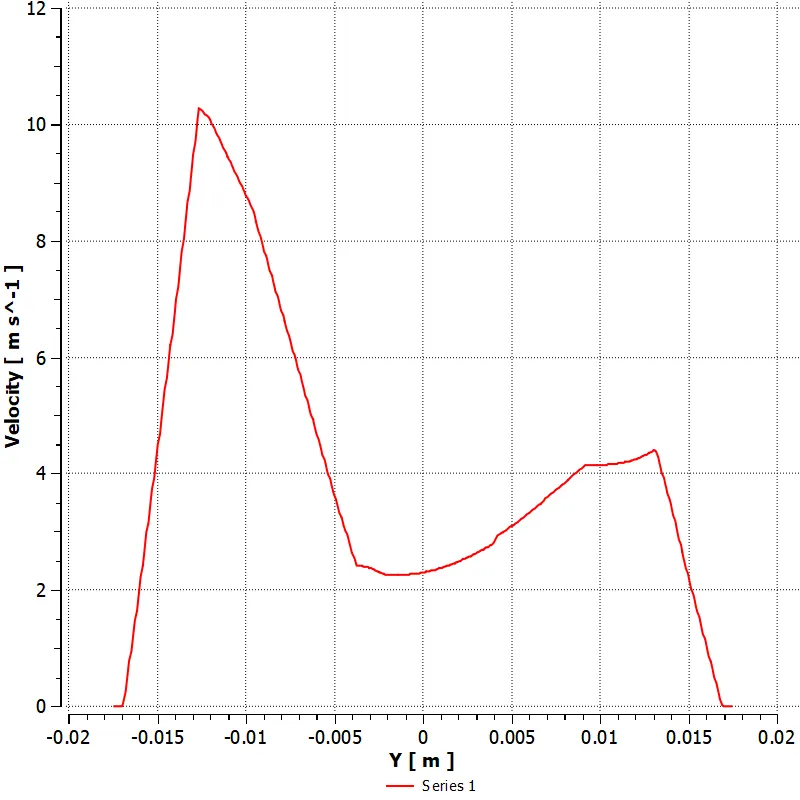
As no slip condition is applicable on walls, velocity will be zero at walls and will increase and become maximum at the centreline of the pipe.
4. Solving and modeling approach
we will use case 1 with momentum ratio =2 and compare k epsilon and k omega SST model for obtaining better result
boundary conditions
inlet x- v = vh, T = Th
inlet y- v = vc, T =Tc
outlet- p =0
wall- no slip condition
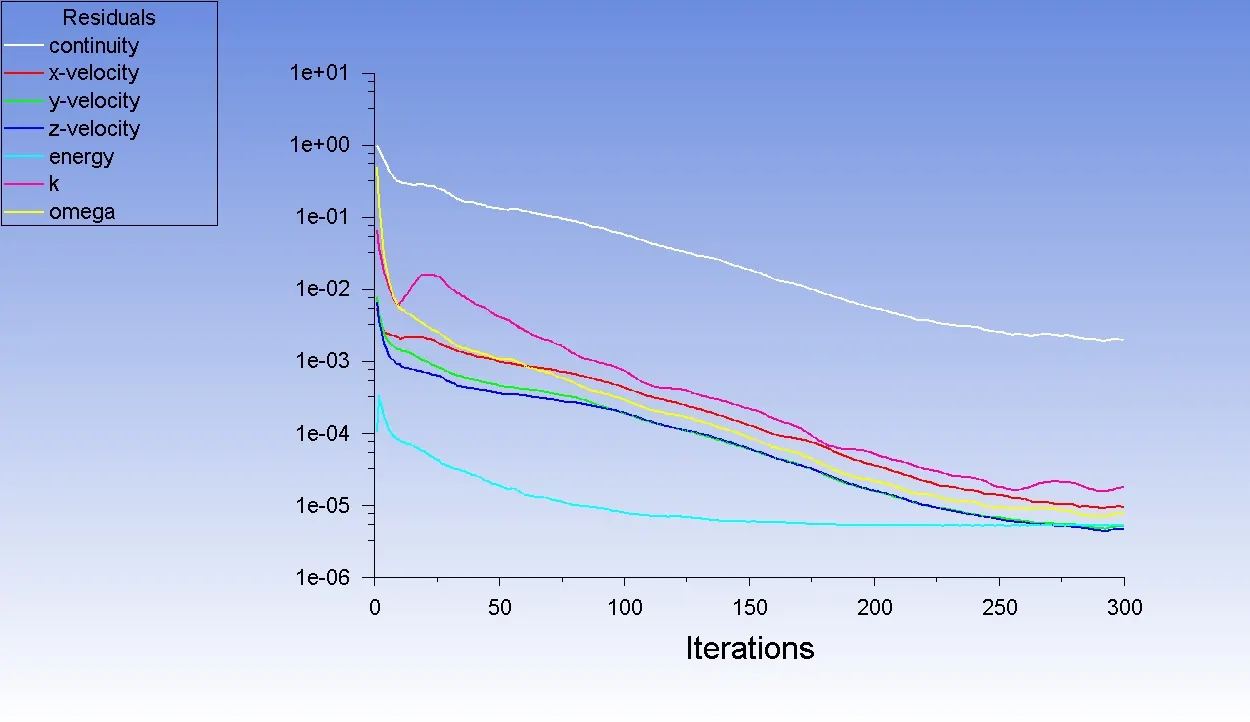
solve for steady state pressure based condition with energy parameter checked in to account for thermal effect
5. solution
MESH INDEPENDENCE STUDY USING CASE 1 WITH MOMENTUM RATIO = 2 AND K EPSILON MODEL
| mesh element size | cells | Tavg outlet, deg C | v avg outlet , m/s |
| 0.005 | 14322 | 30.222 | 4.504 |
| 0.0035 | 29304 | 30.267 | 4.49 |
| 0.002 | 106870 | 30.469 | 4.49 |
from above table, it can be seen that there is no significant change in average temperature and velocity with finer mesh. so for this particular problem, calculations are preformed with coarse mesh with element size of 0.005 in order to maintain a faster computational speed.
CASE 1 MOMENTUM RATIO = 2
k epsilon model
</>
<>>
<> < src alt="">
< /></> <>> <>< />< src alt="">
t line plot along pipe
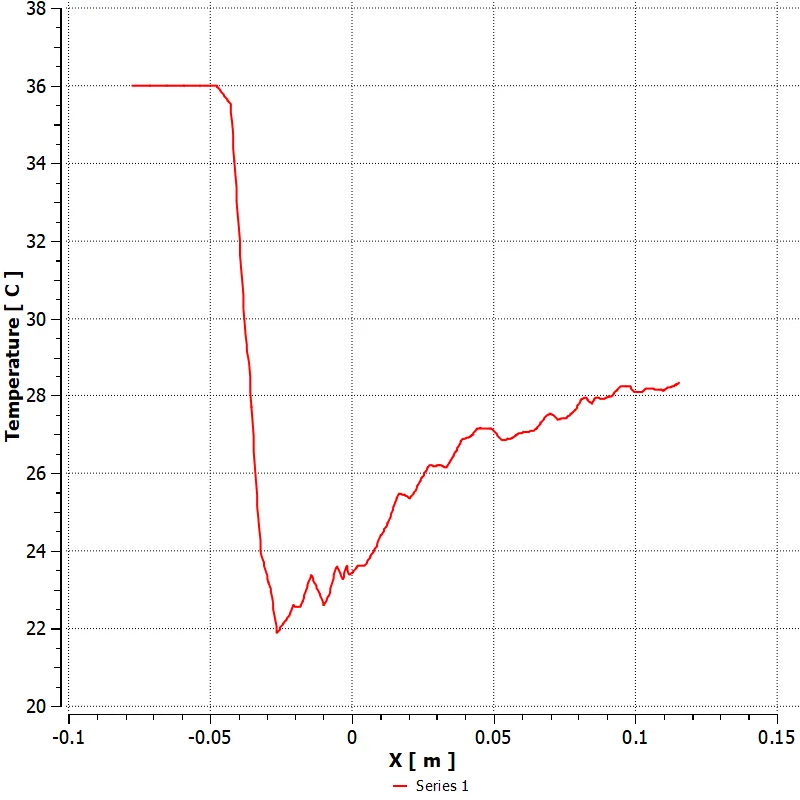
t line plot across pipe
< src alt="">
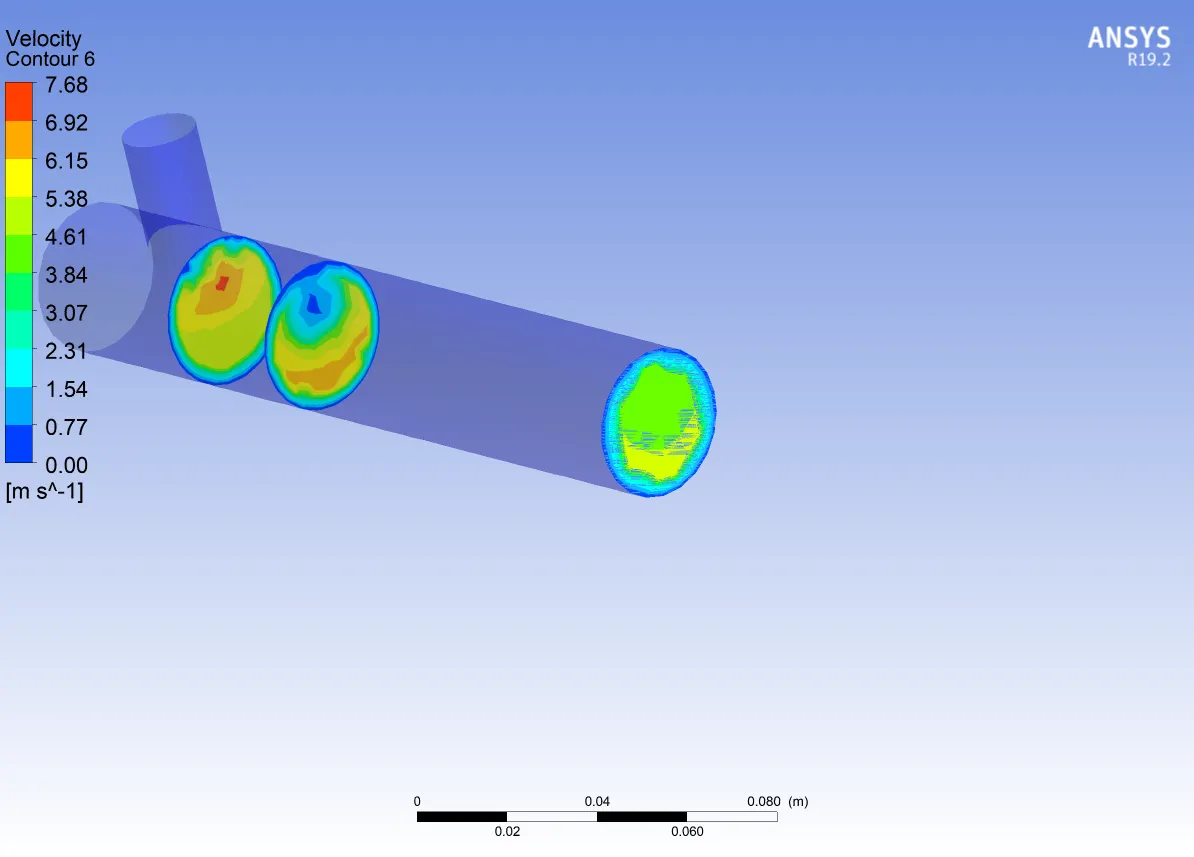
v contour laong pipe
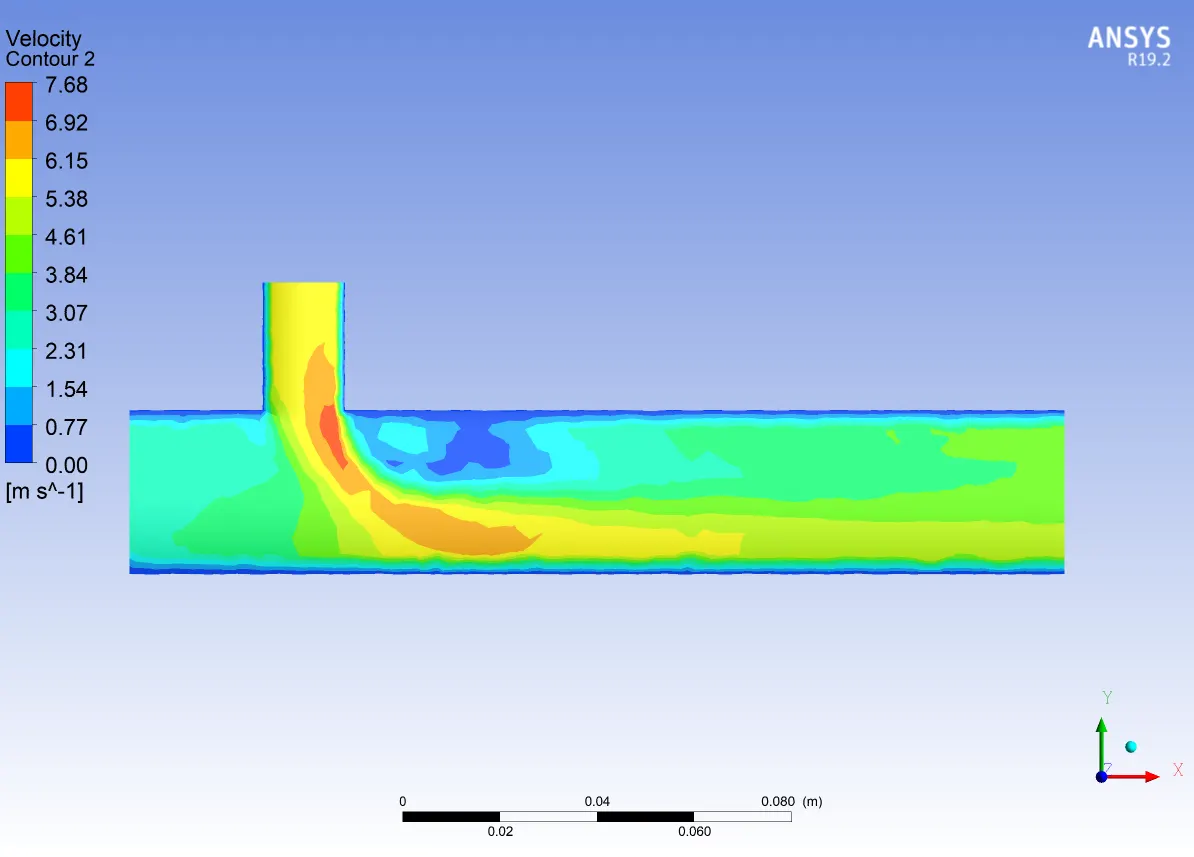
v contour across pipe
</>
<>>
<>< alt>
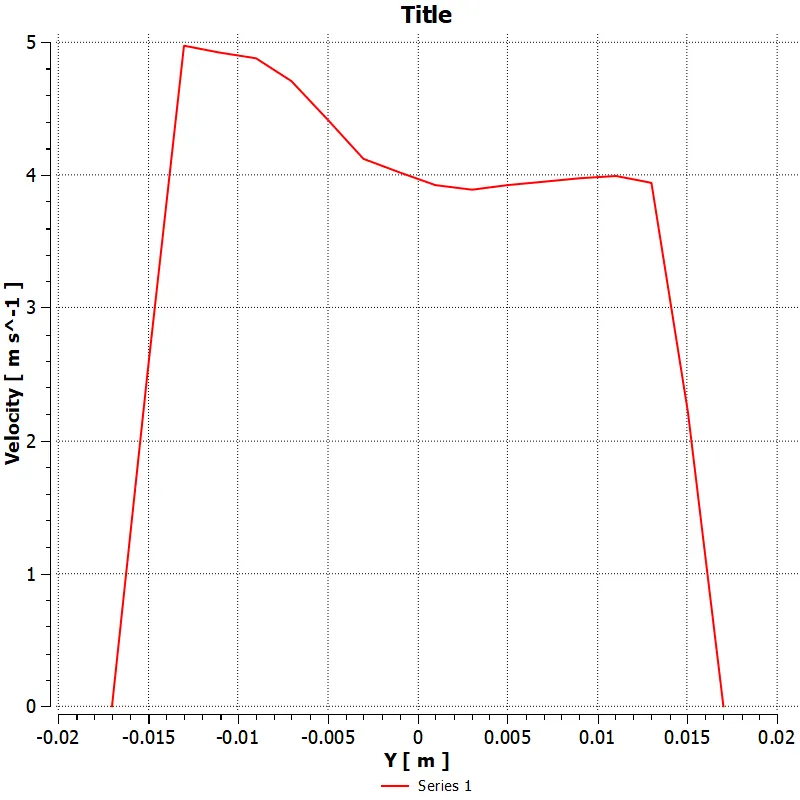
v line plot across pipe at x = outlet
k omega SST model
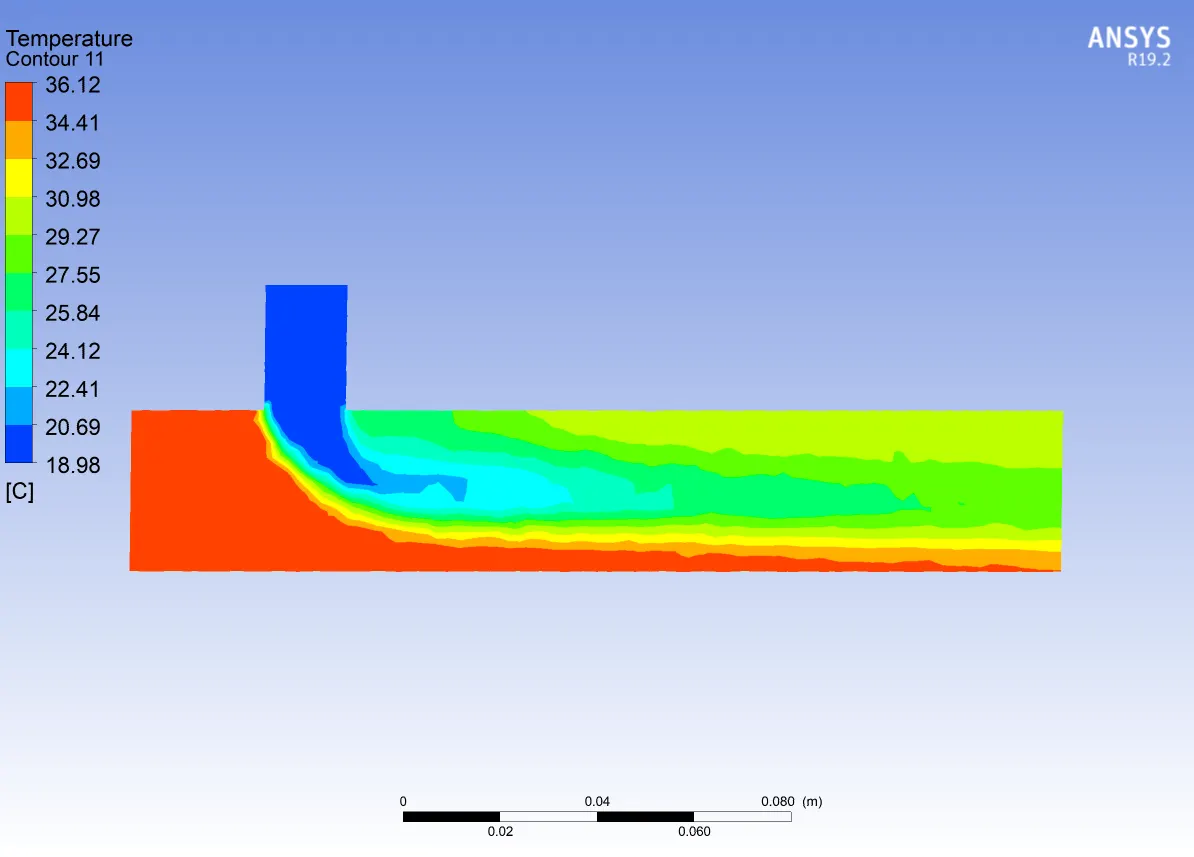
t contour along pipe
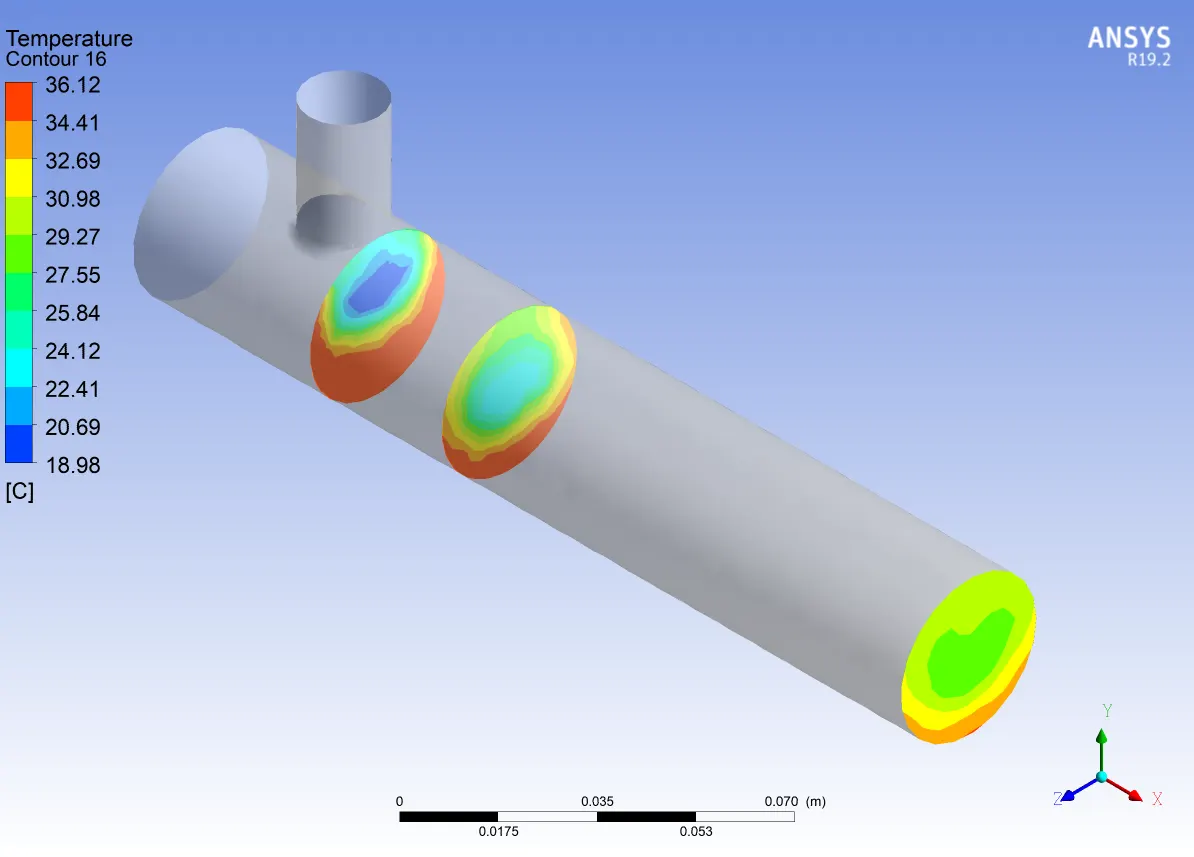
t contour across pipe
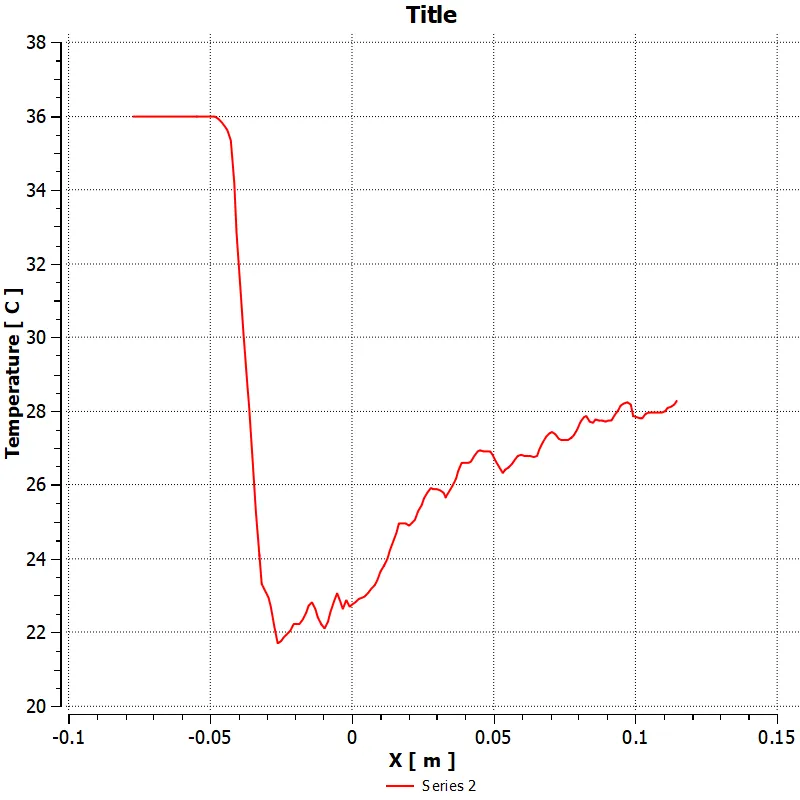
t line plot along pipe
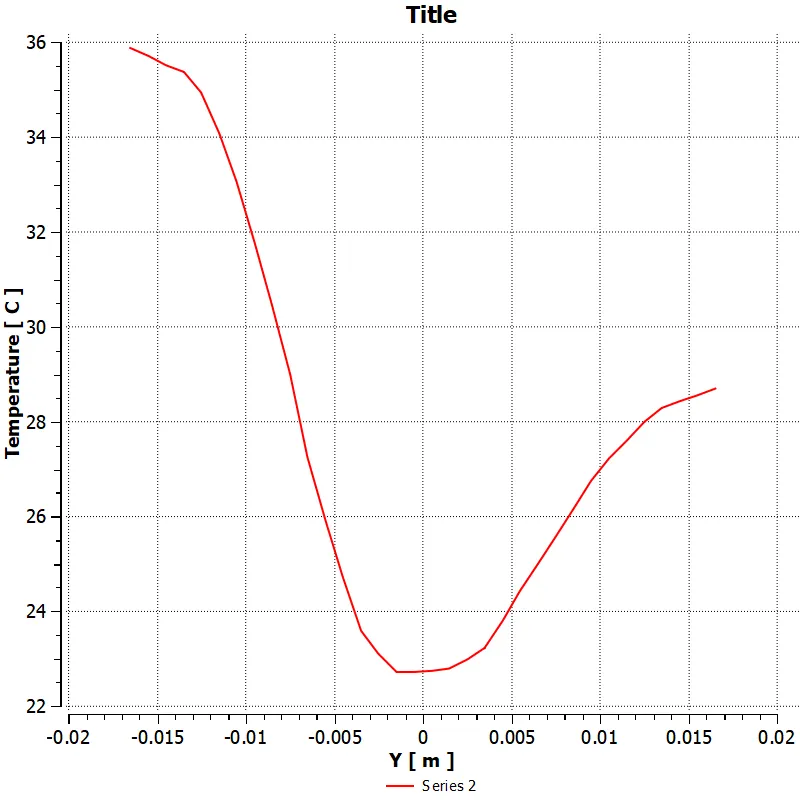
t line plot across pipe
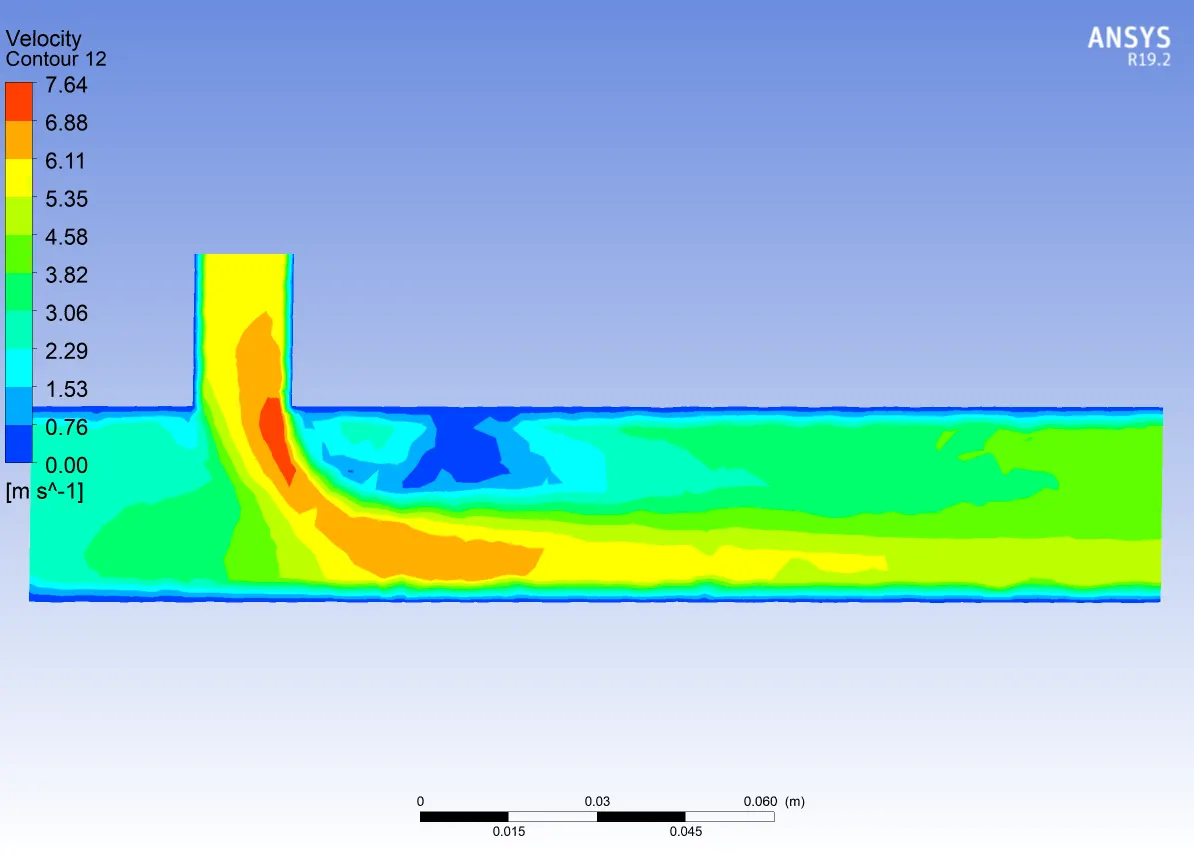
v contour along pipe
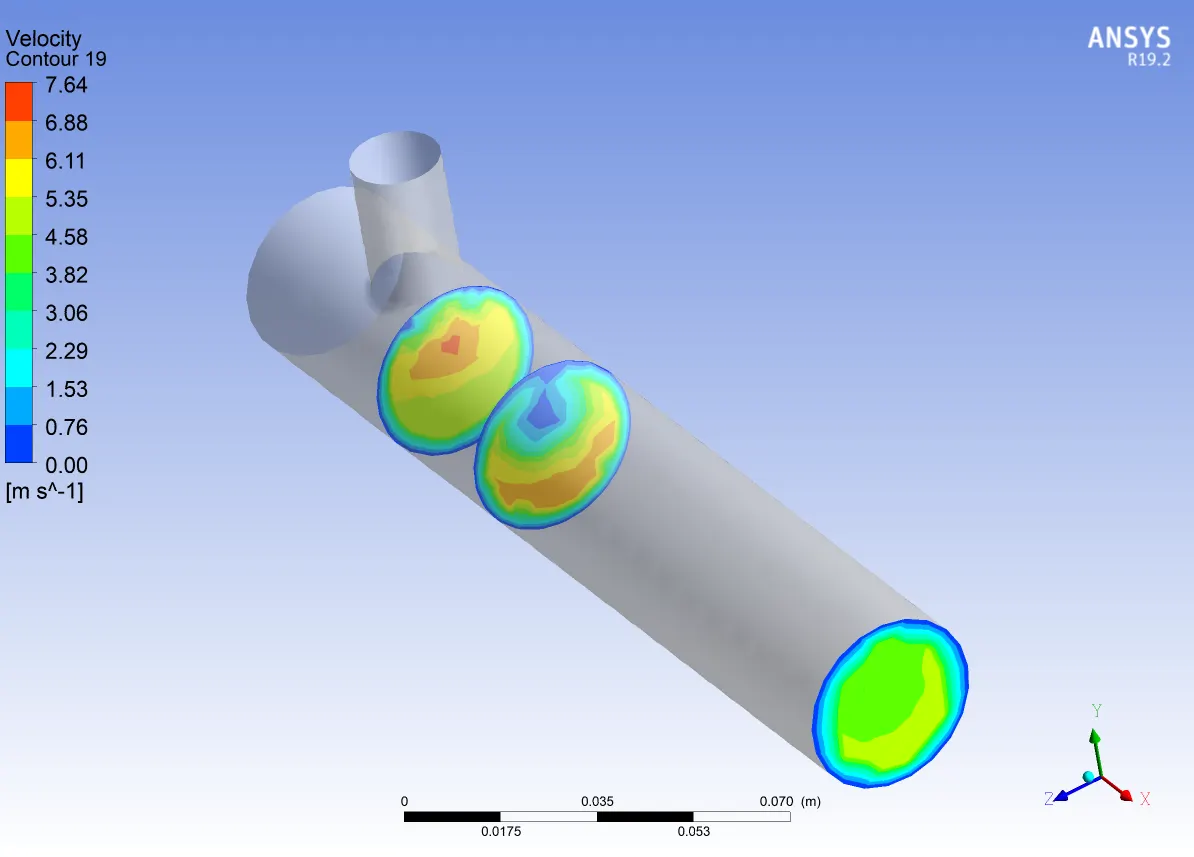
v contour across pipe
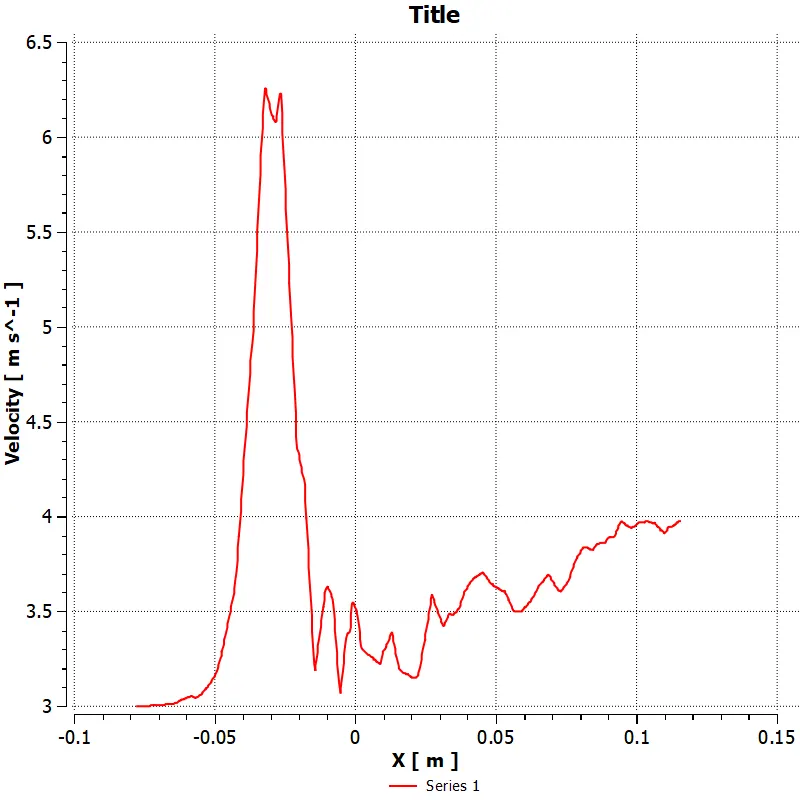
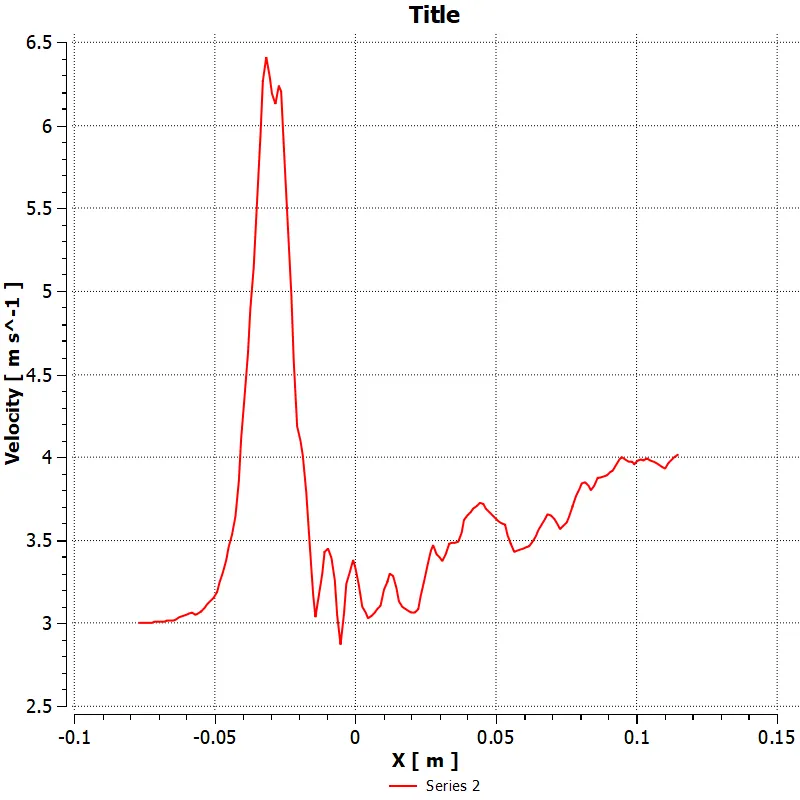
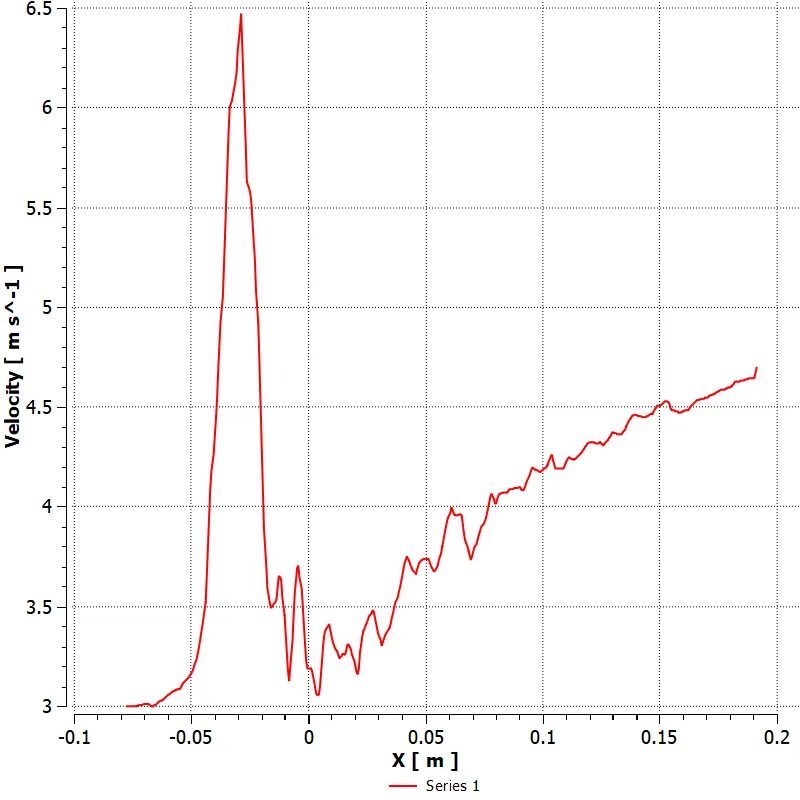
v line plot along pipe
v line plot across pipe
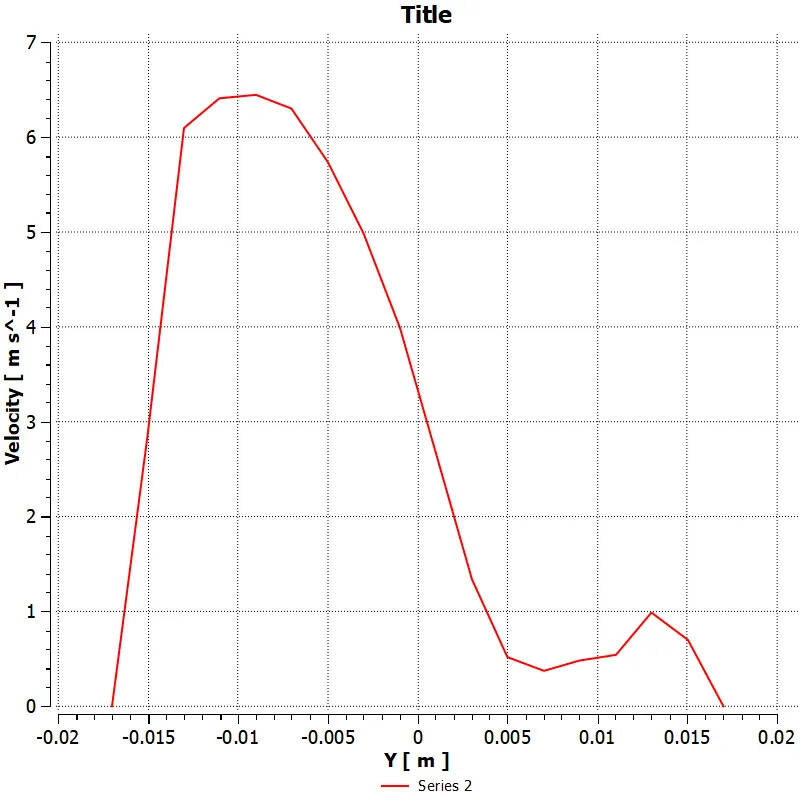
from above results it is understood that k epsilon model is good for free steam flow whereas k omega SST model gives better result for boundary layer flows i.e. near walls. Hence, considering this in order to get accurate result near walls we are procedding with k omega SST model for further calculations.
CASE 1 MOMENTUM RATIO = 4
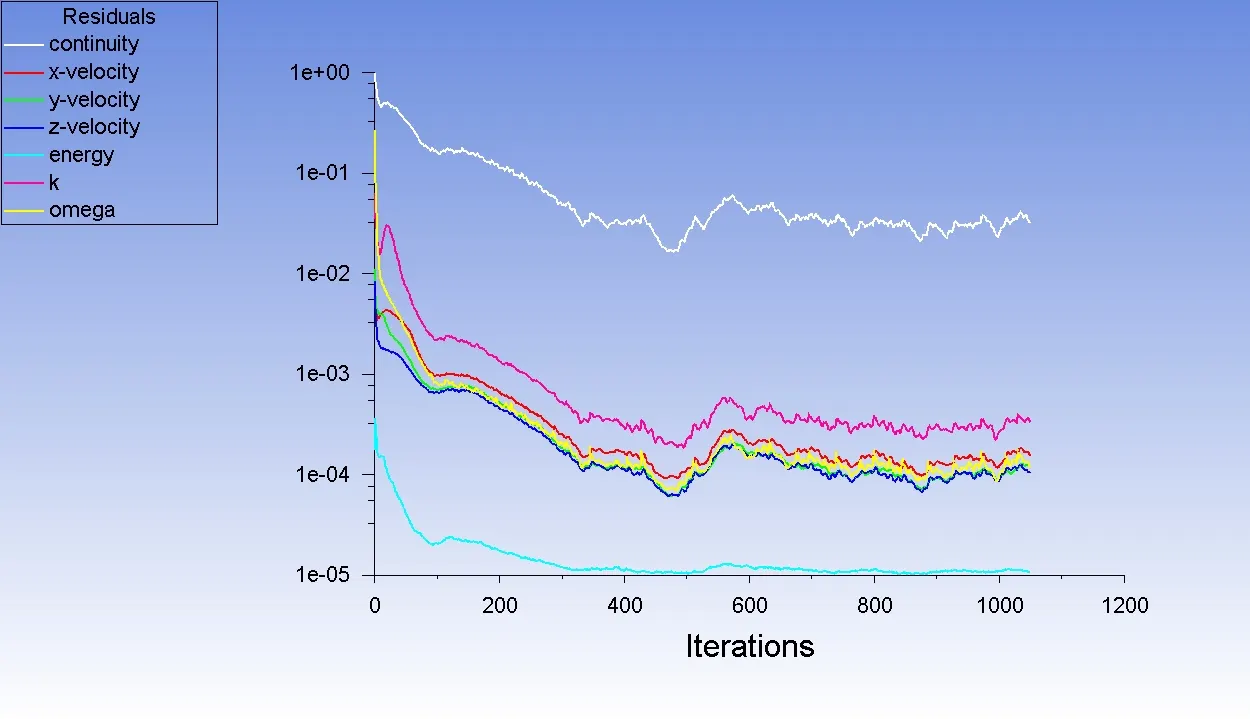
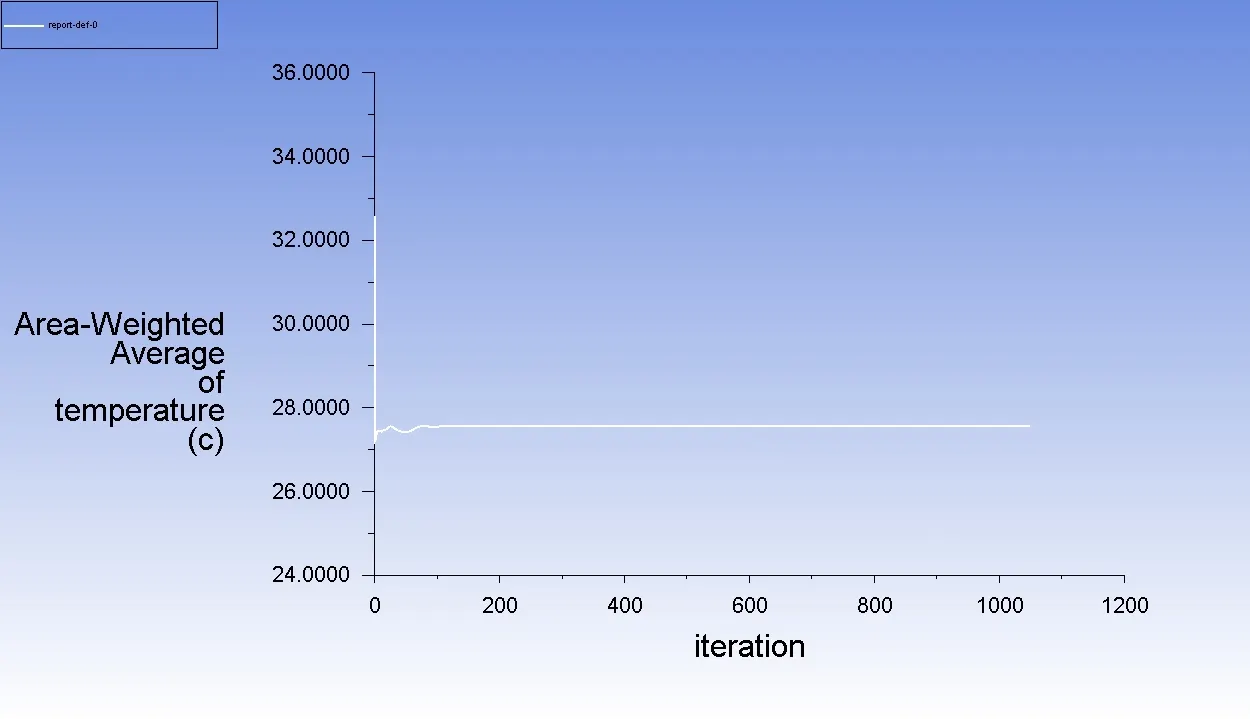
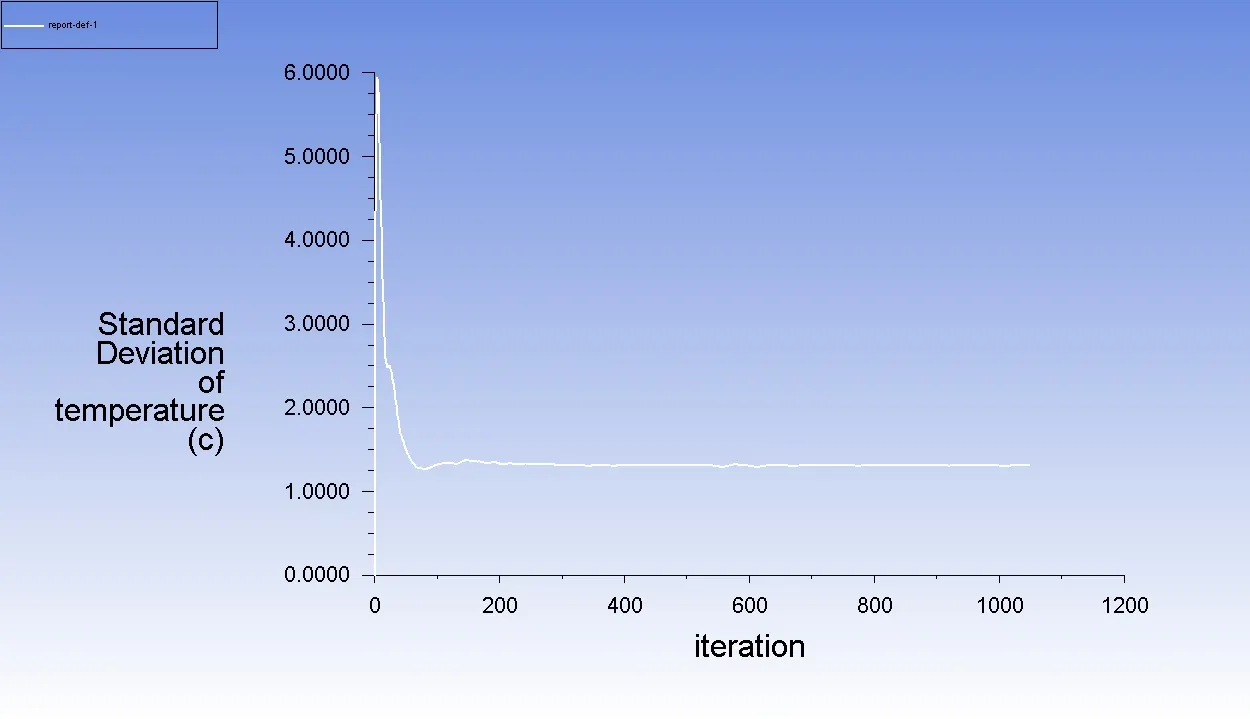
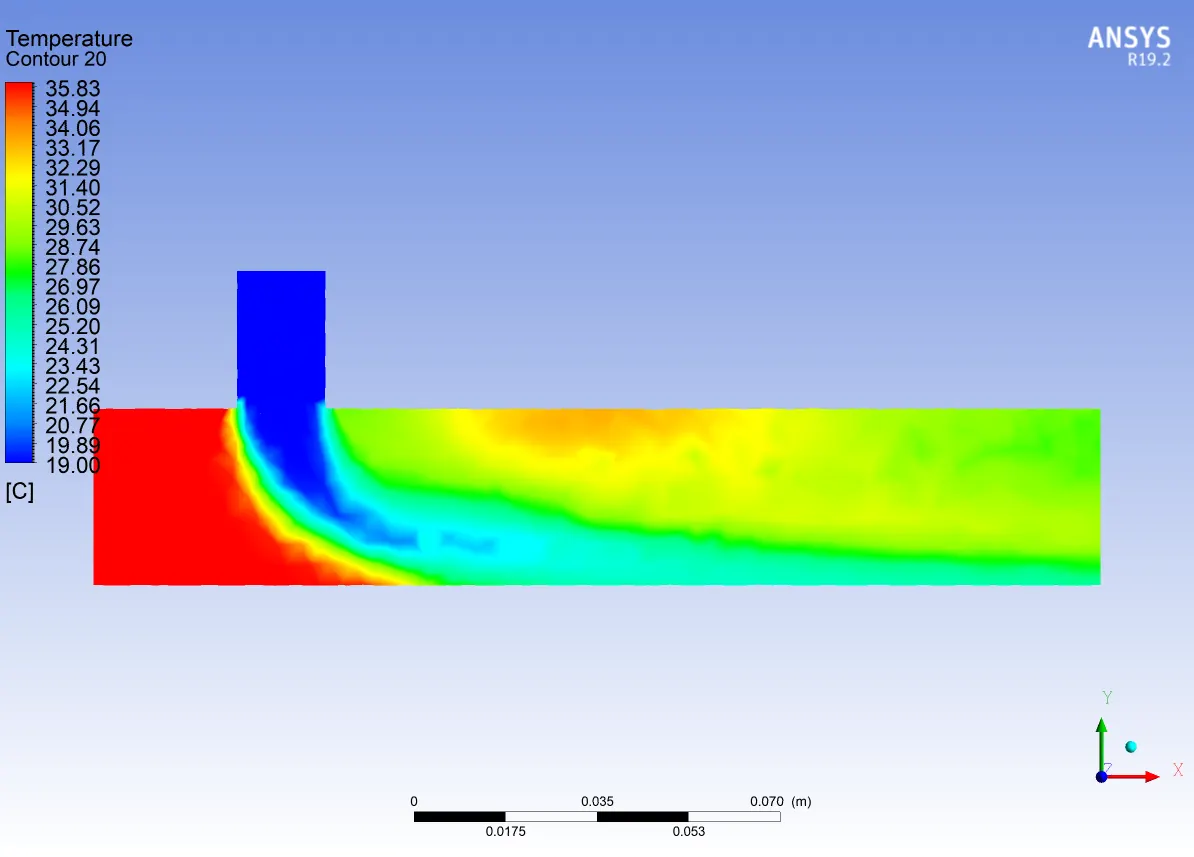
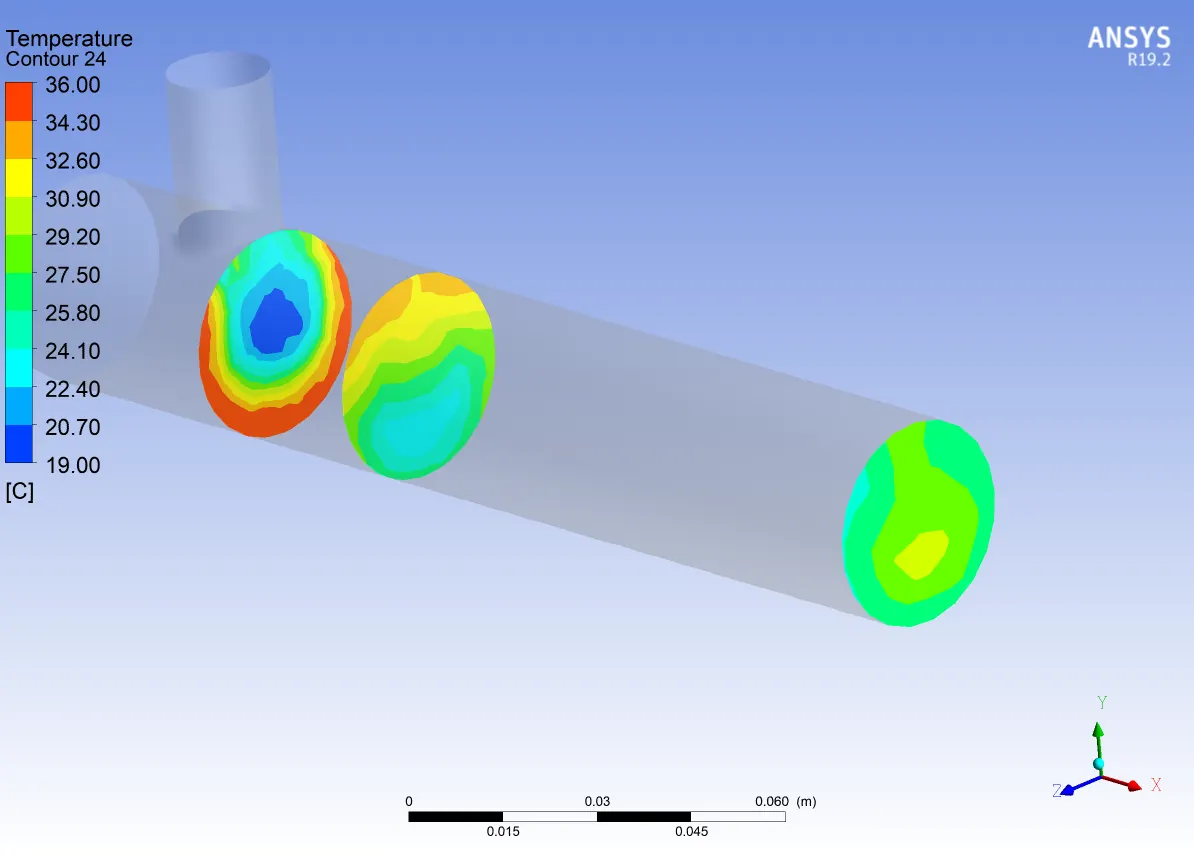
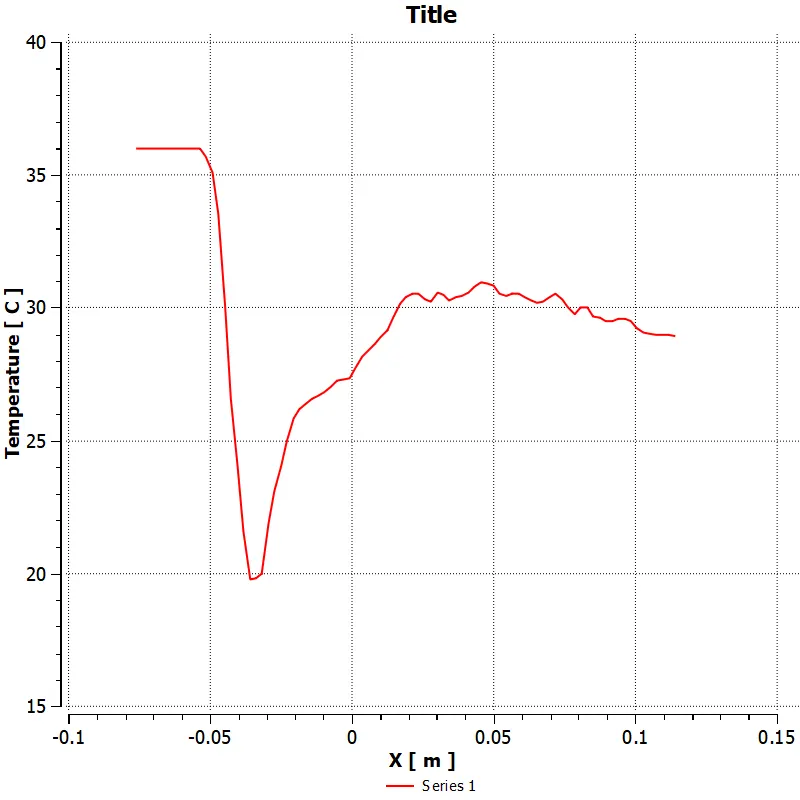
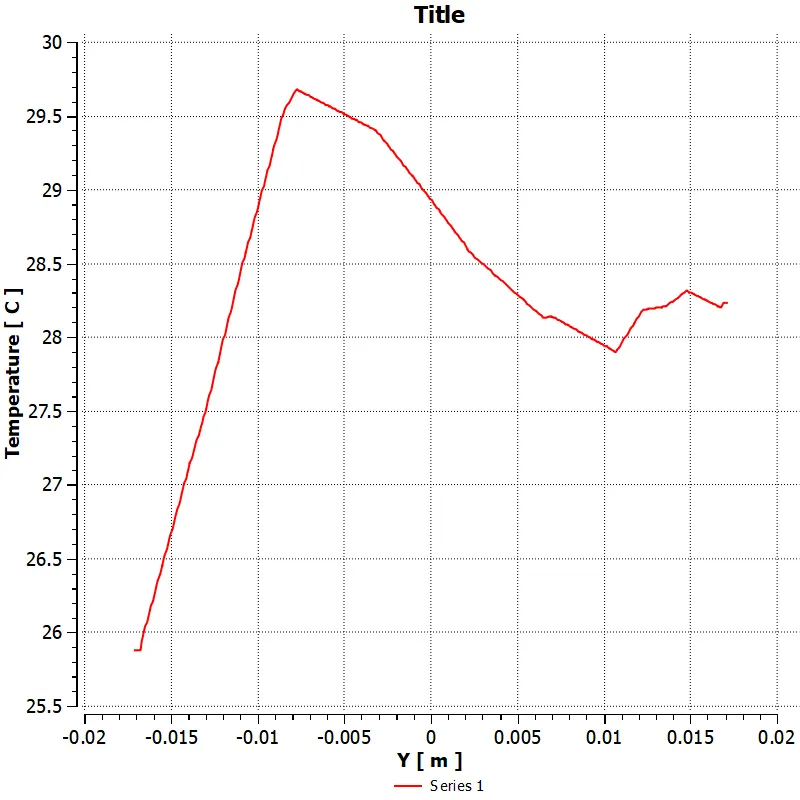
follow similar steps only vc = 12 m/s
t contour along pipe
</>
<>>
<>< alt>
t line plot along pipe
</>
<>>
<>< alt>
v contour along pipe
< src alt="">
v contour across pipe
v line plot along pipe
v line plot across pipe at x = outlet
CASE 2 MOMENTUM RATIO = 2
< /></>
<>< /></>
<>T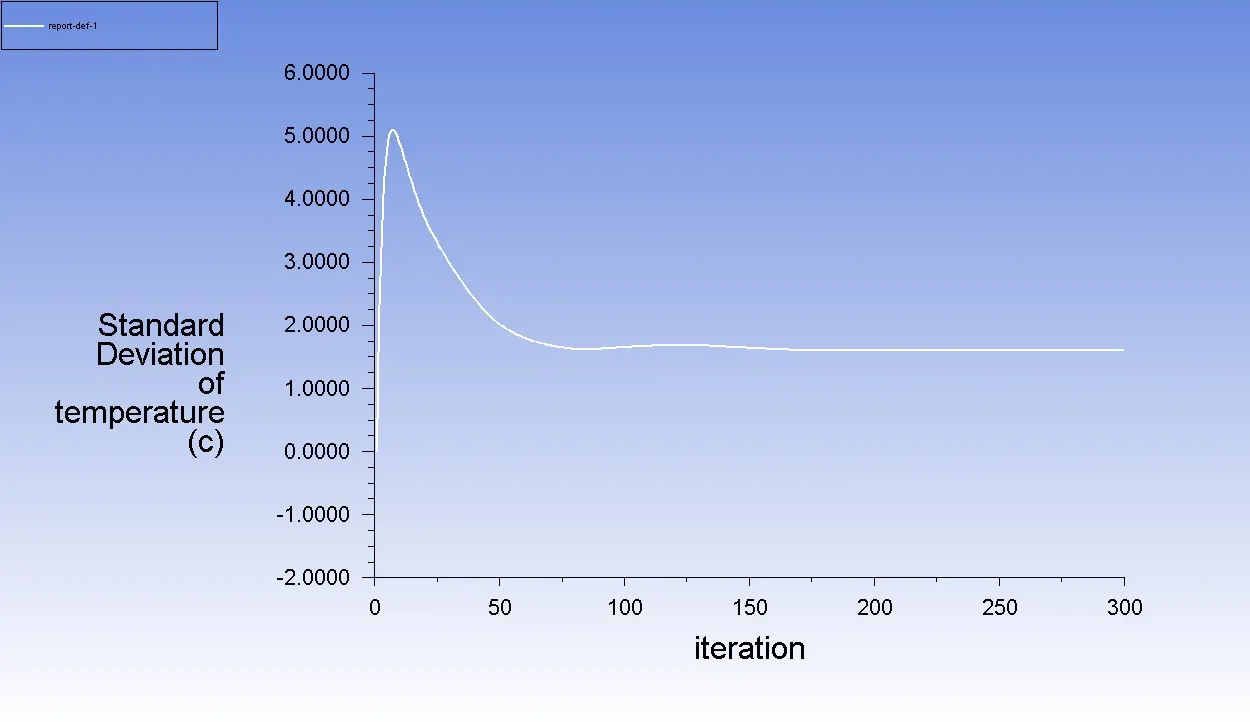
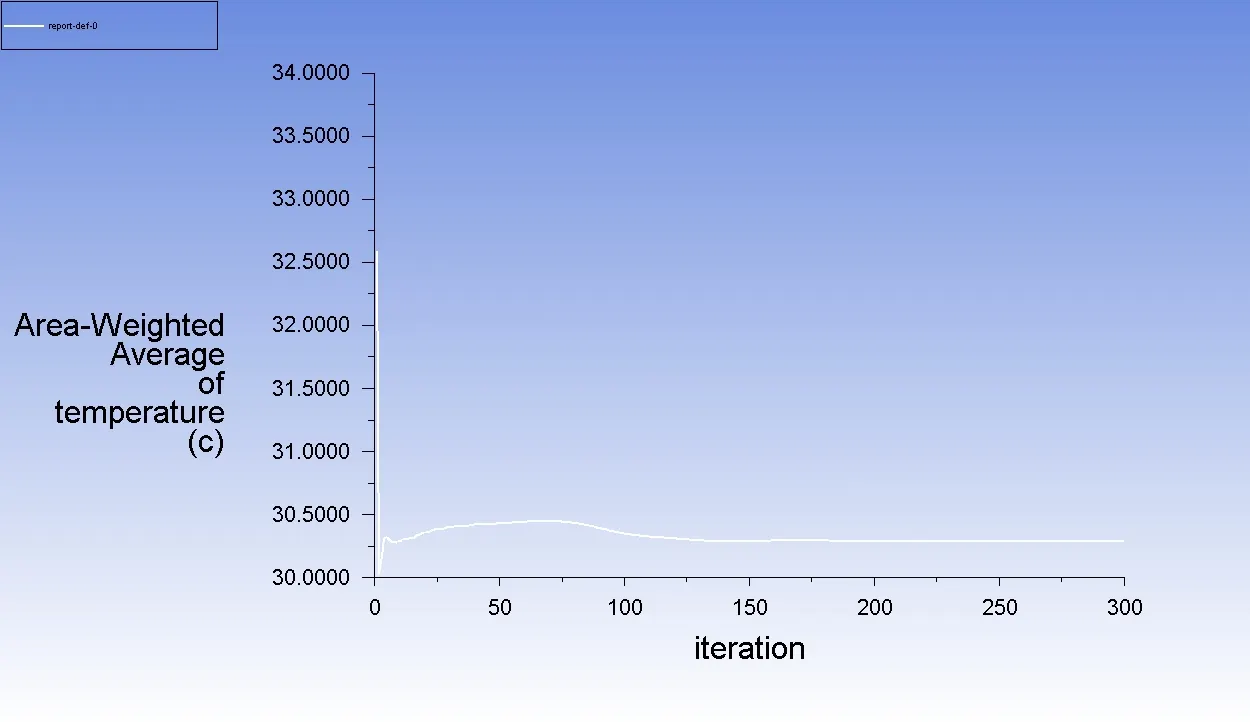
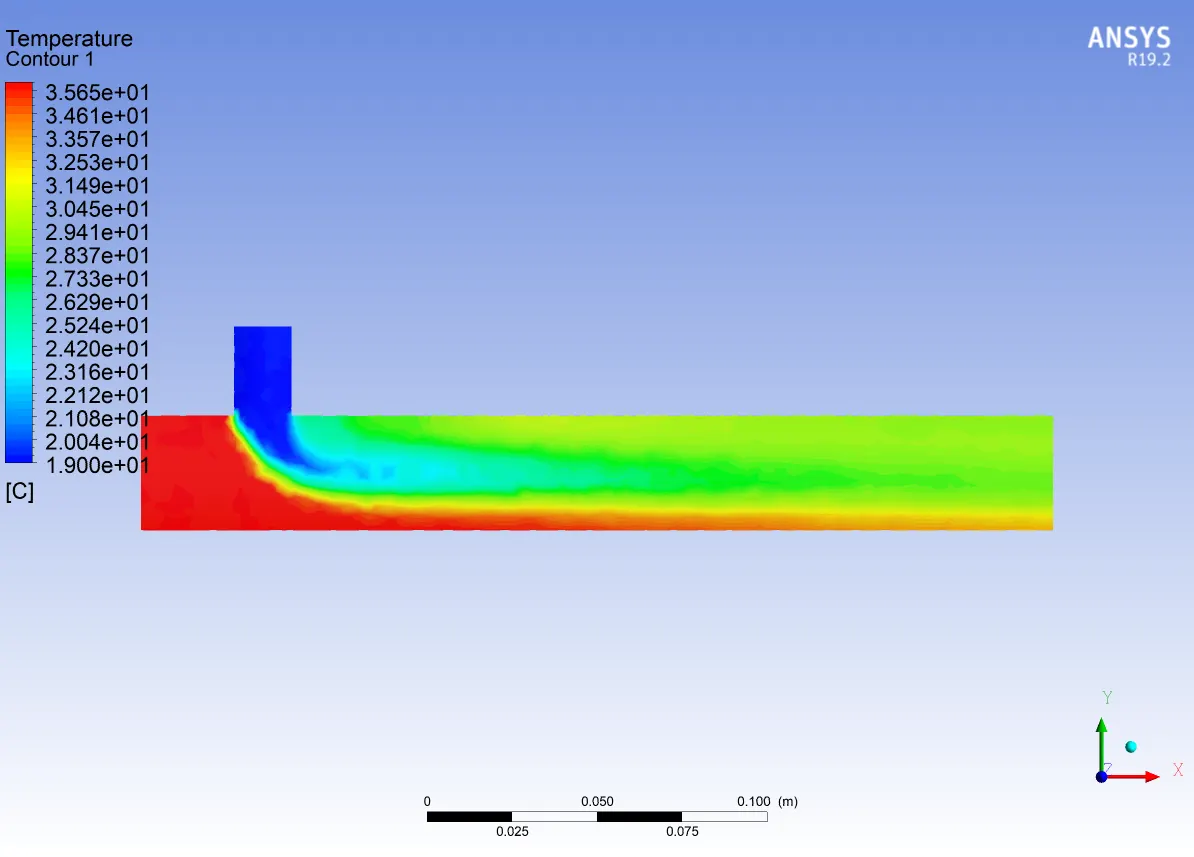
t conTOUR along pipe
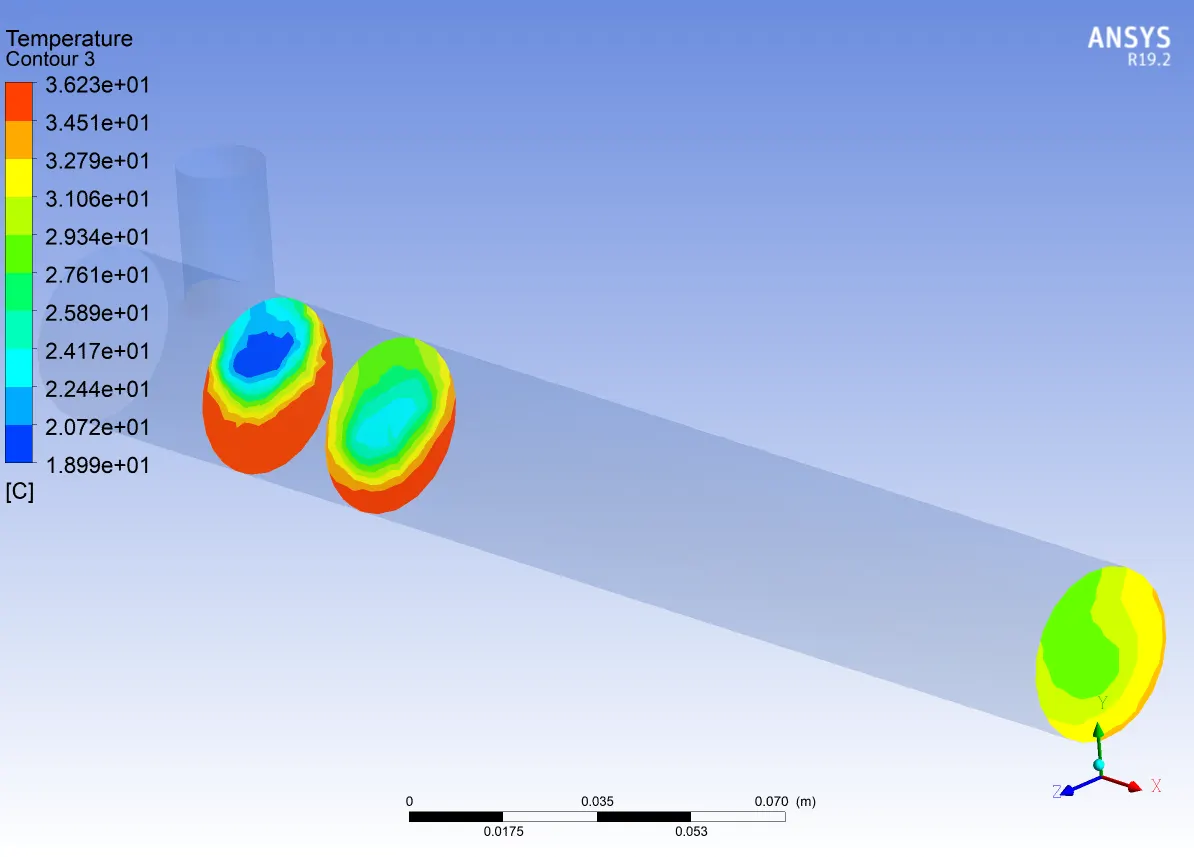
t contour across pipe
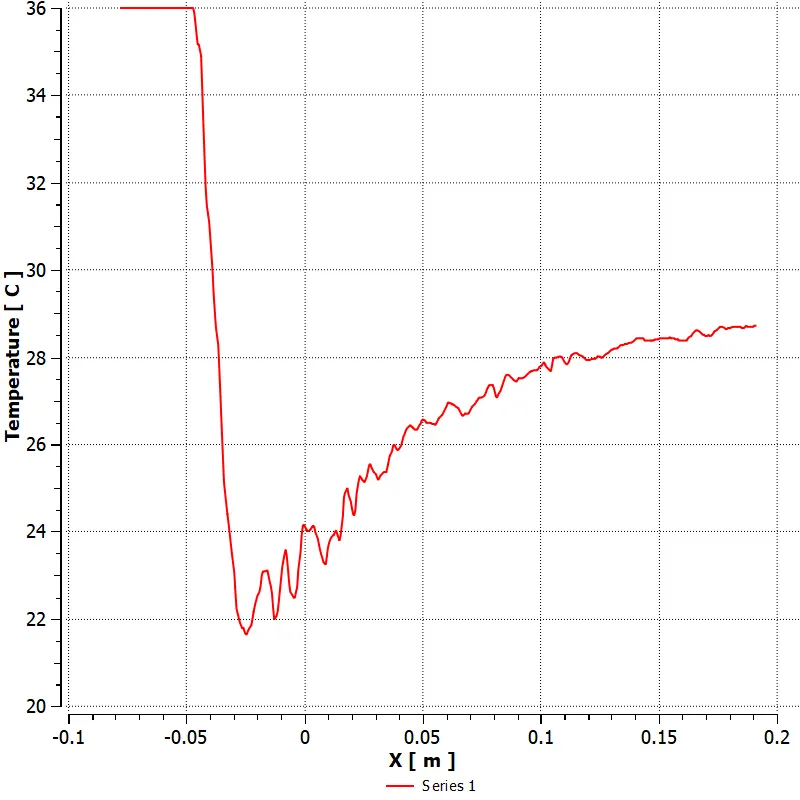
t line plot along pipe
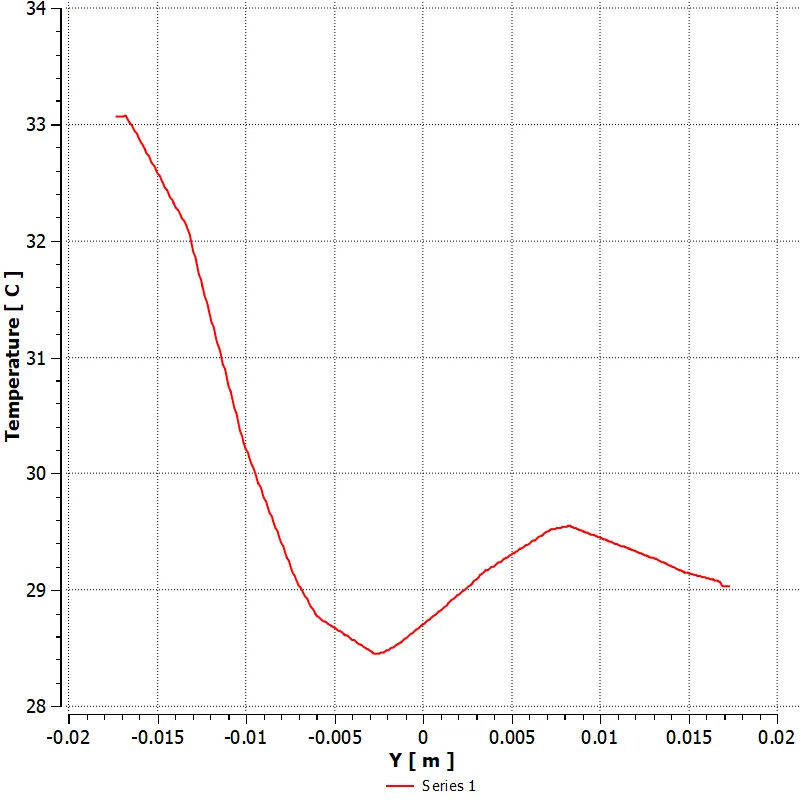
t line plot across pipe
v contour along pipe
v contour across pipe
v line plot along pipe
v line plot across pipe at outlet
CASE 2 MOMENTUM RATIO = 4
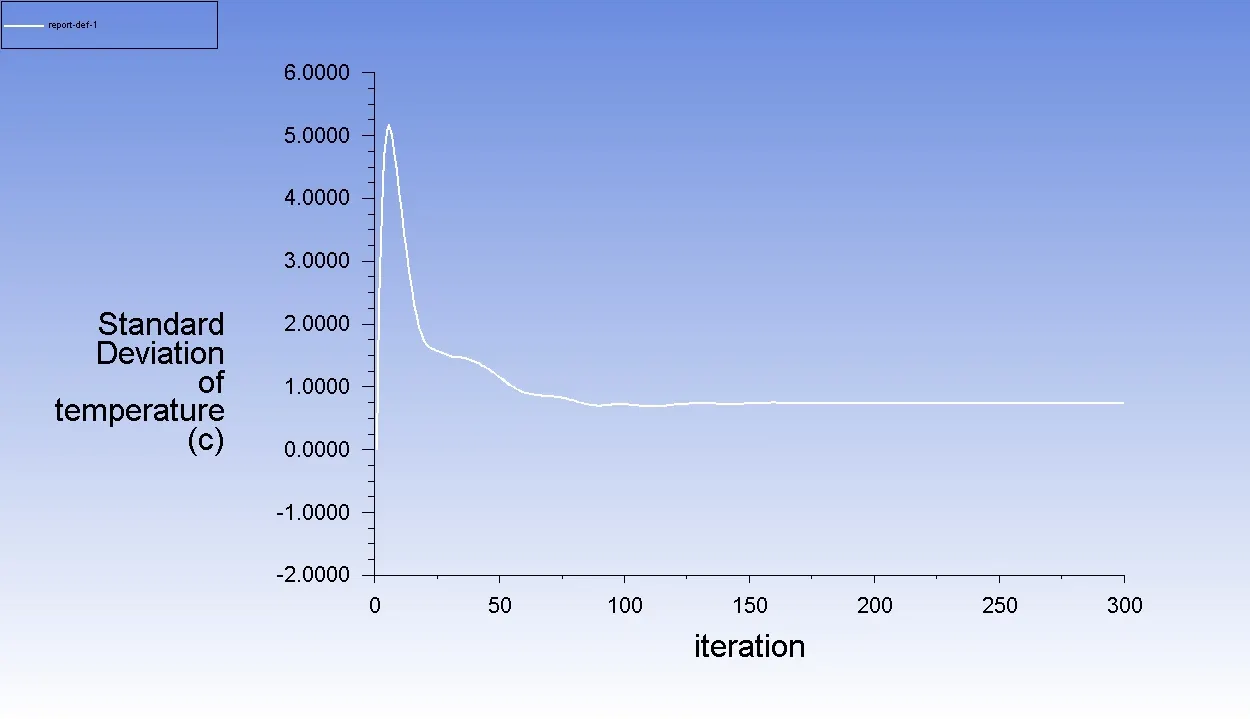
t contour along pipe
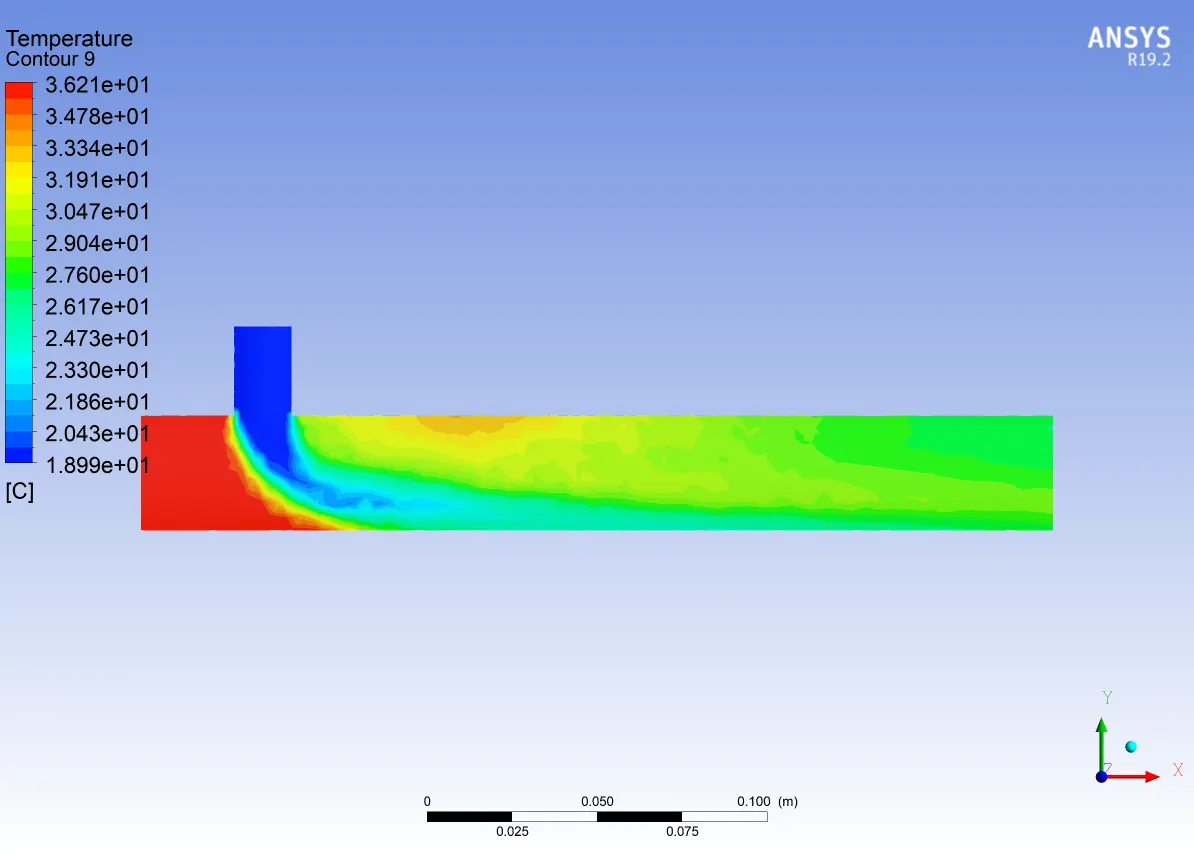
t contour across pipe
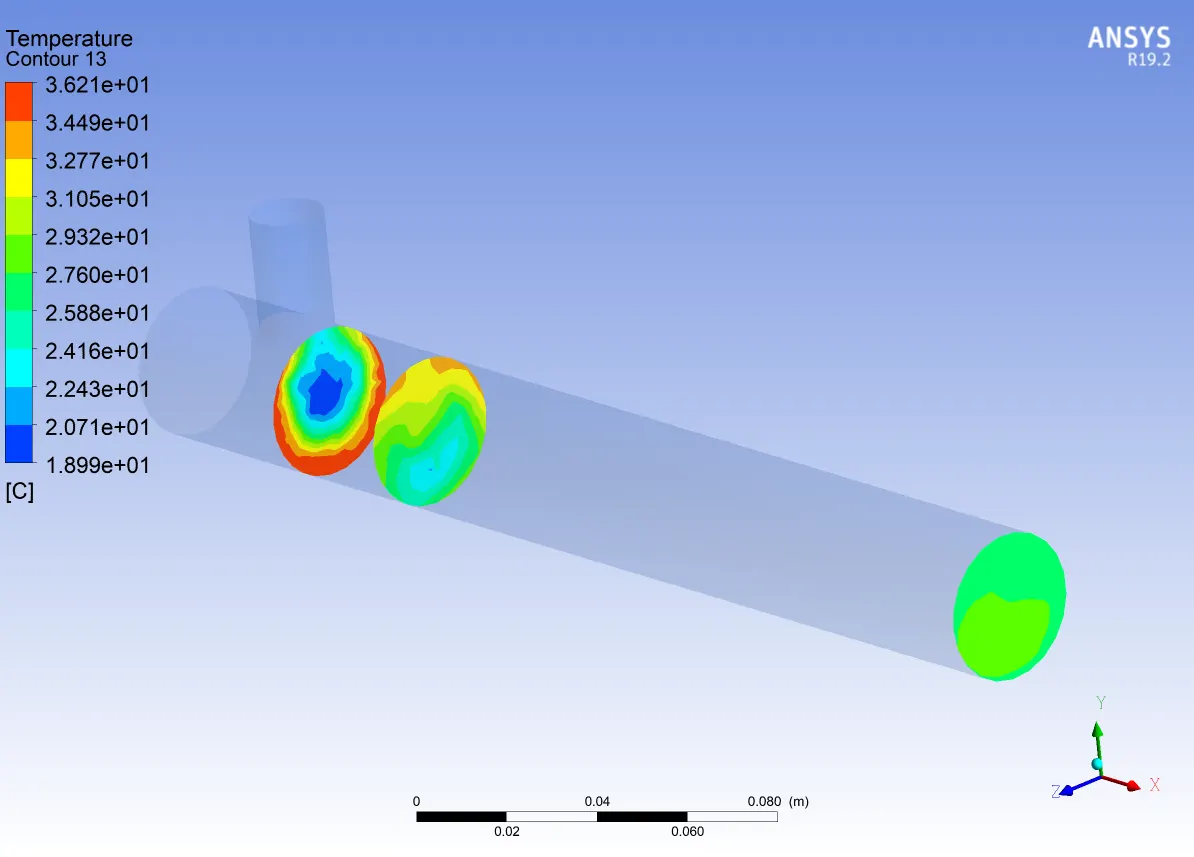
t line plot along pipe
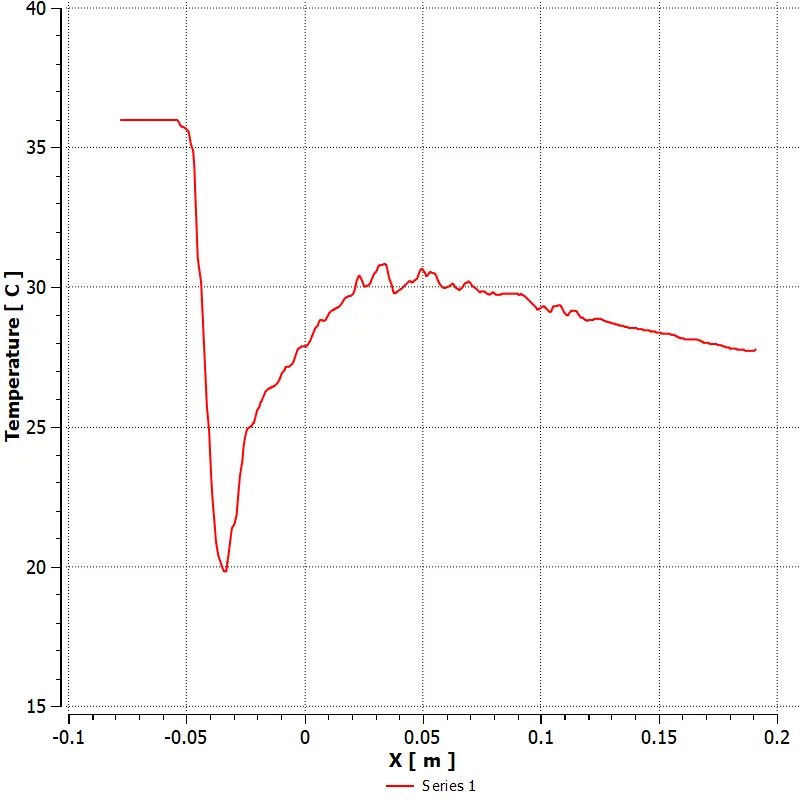
t line plot across pipe at outlet
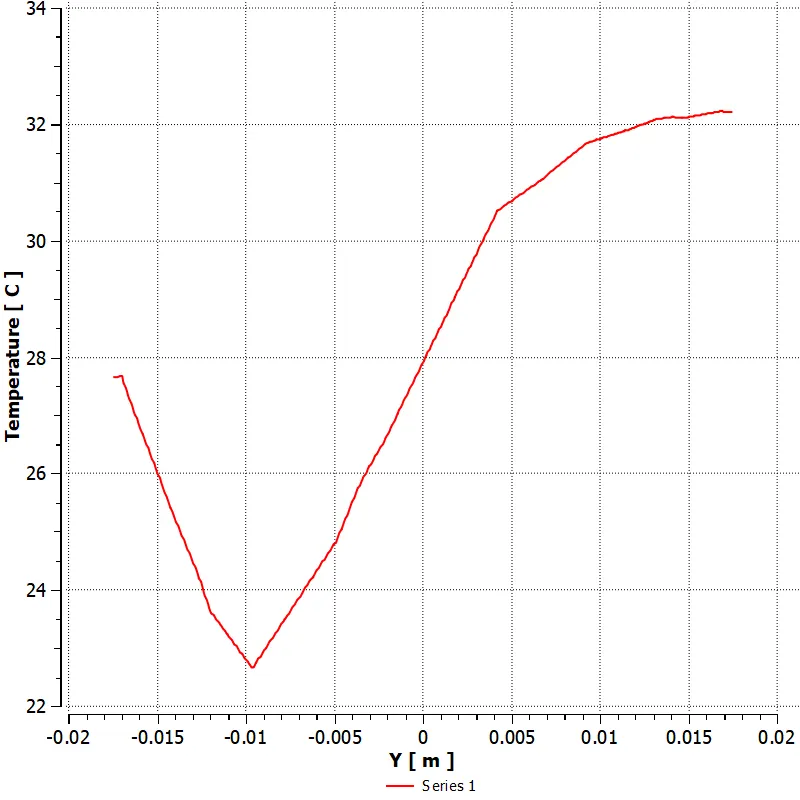
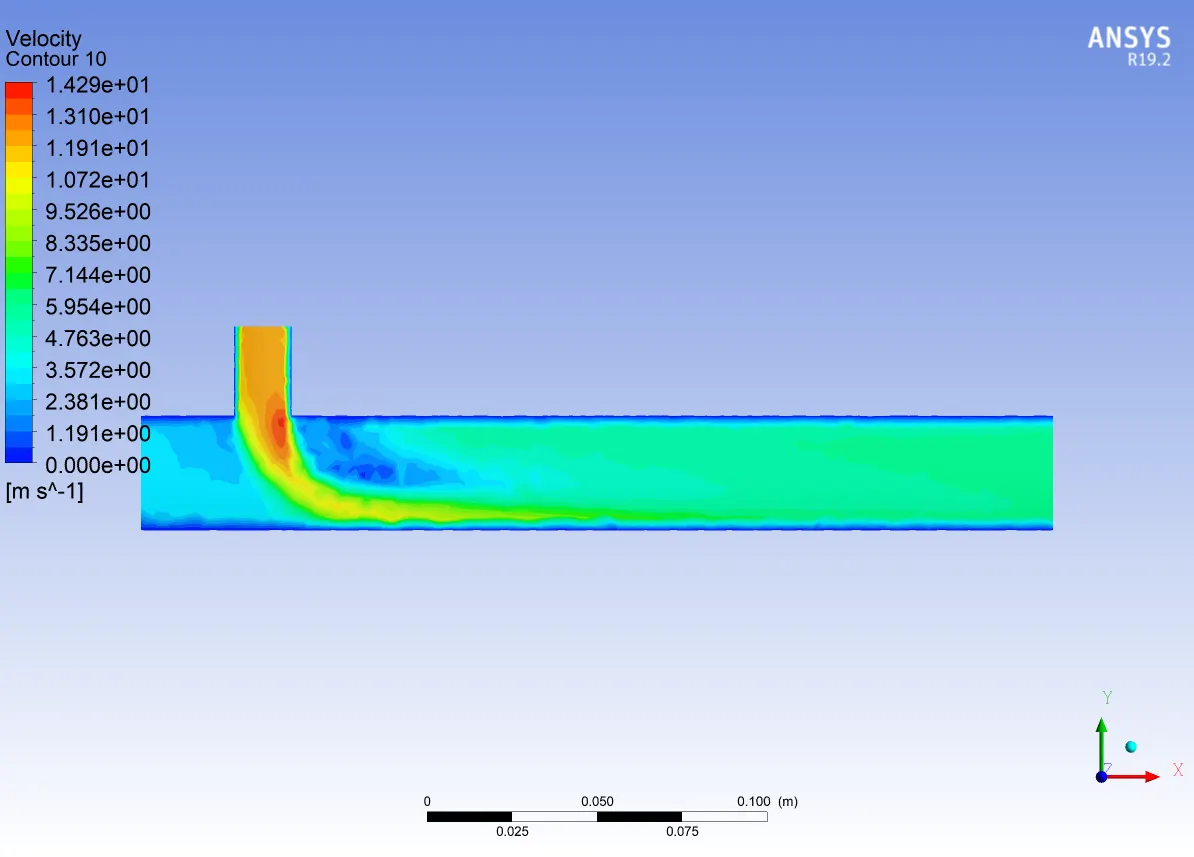
v contour alon pipe
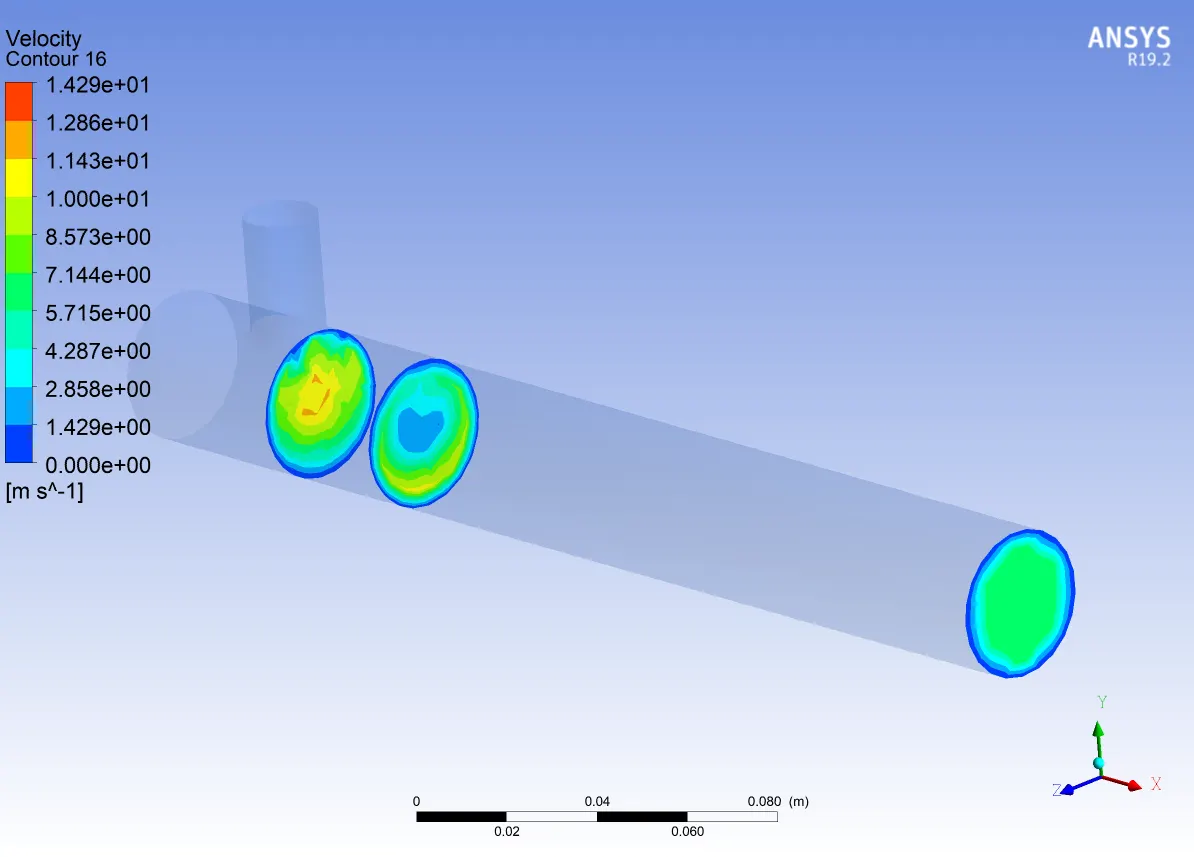
v contour across pipe
v line plot along pipe
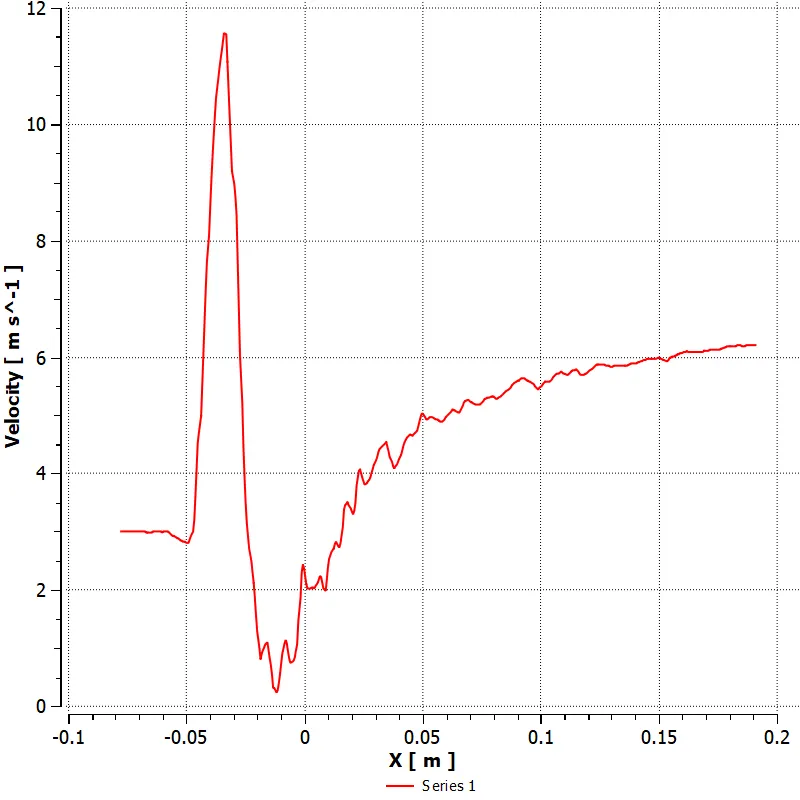
v line plot across pipe at outlet
| case | model | momentum ratio | cell count | Tavg outlet, deg C | std deviation | no. of iterations |
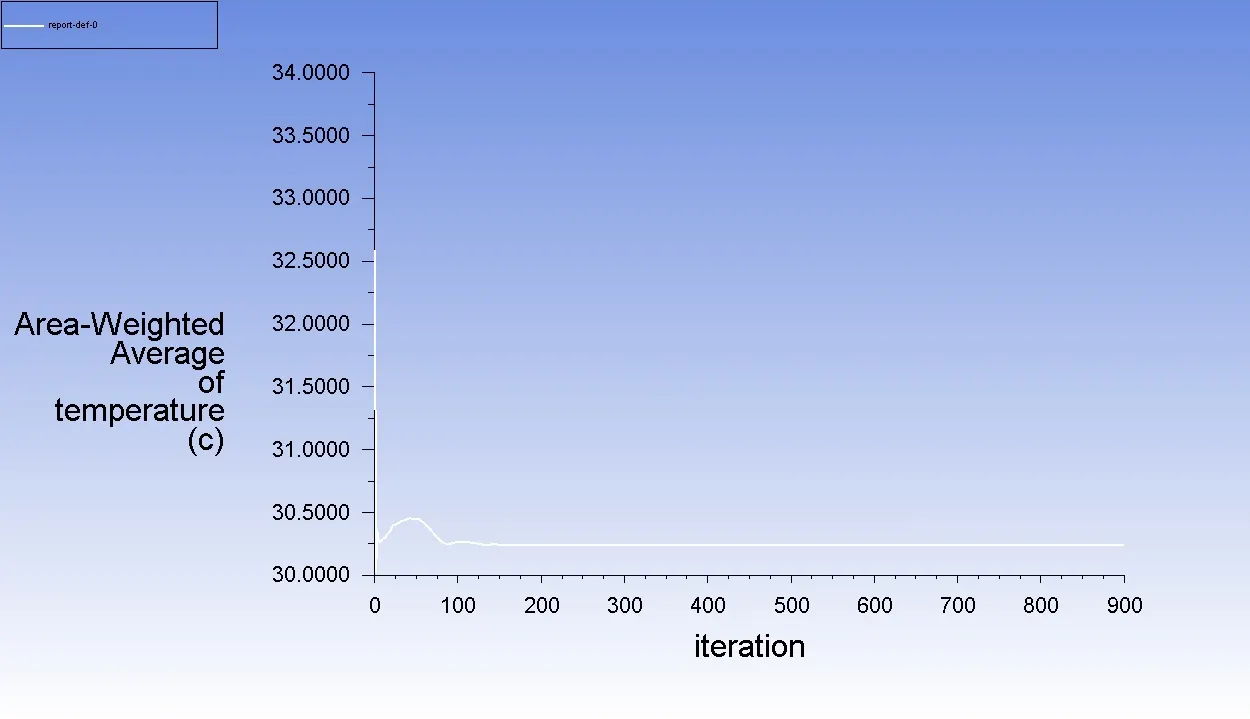
| 1 | k omega | 2 | 14322 | 30.244 | 1.94 | 850 |
| 1 | k omega | 4 | 14322 | 27.580 | 1.320 | 1000 |
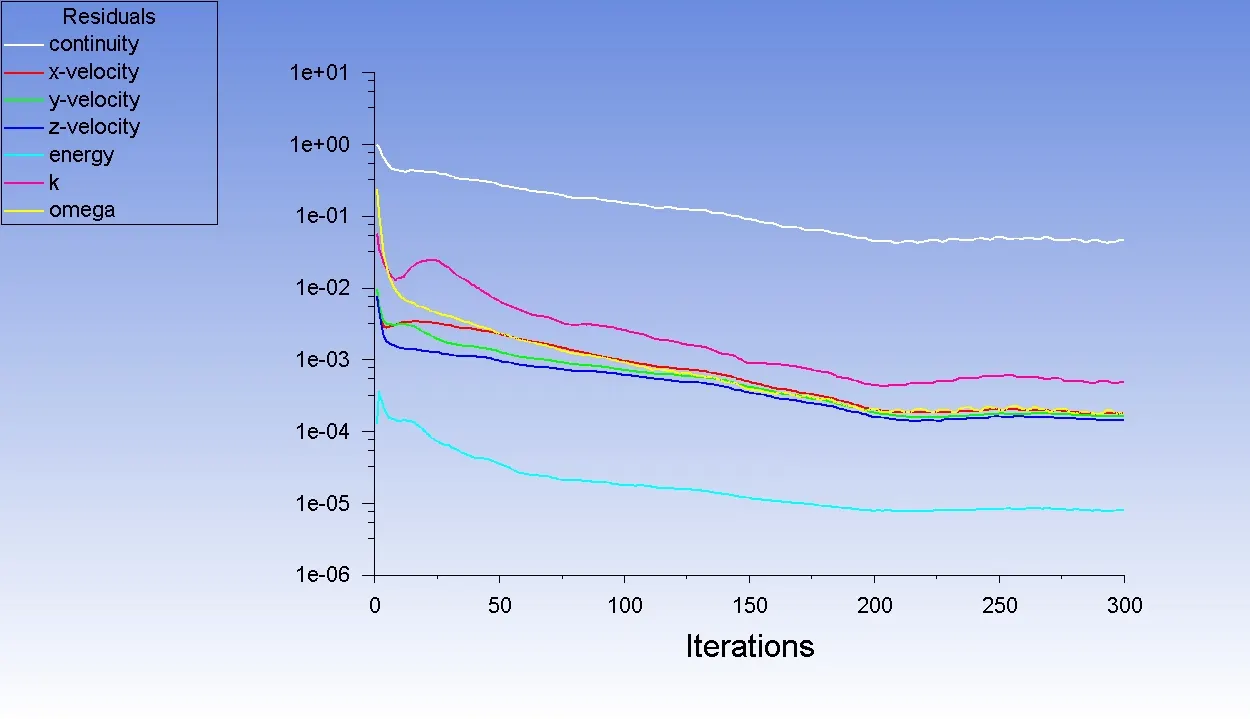
| 2 | k omega | 2 | 18141 | 30.29 | 1.625 | 300 |
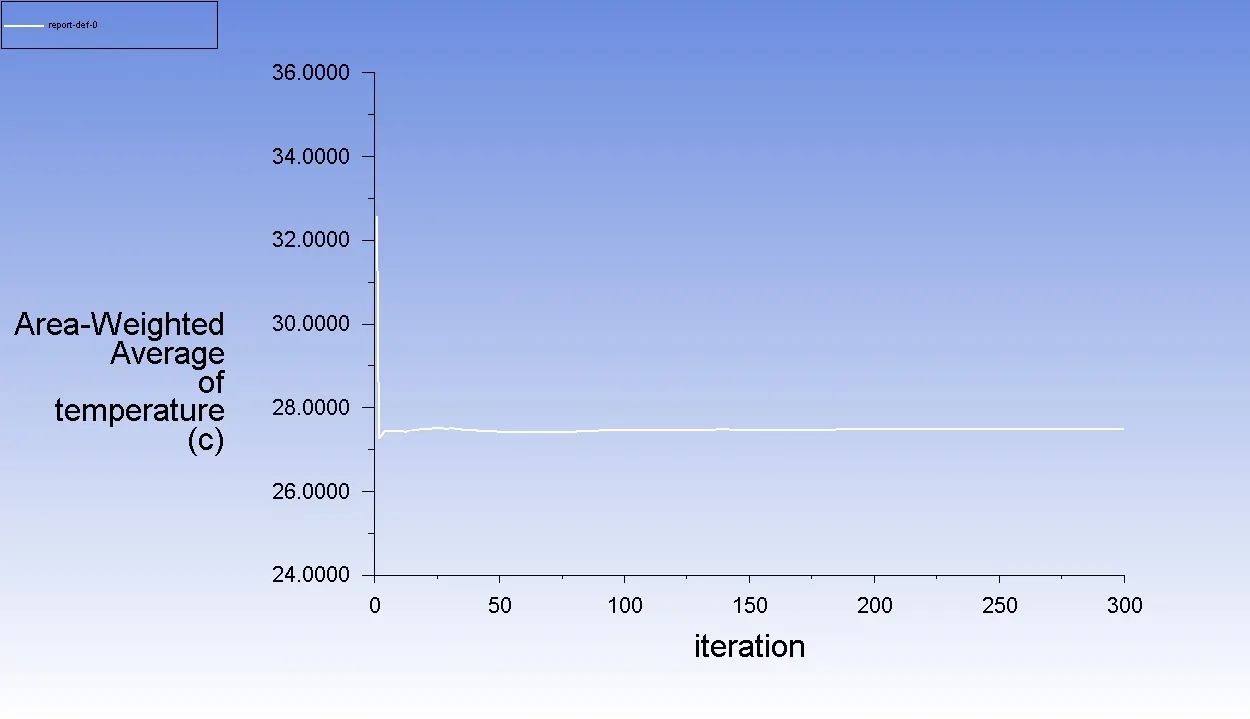
| 2 | k omega | 4 | 18141 | 27.50 | 0.747 | 220 |
EFFECT OF LENGTH
as can be seen from above table, length has no significant impact on thermal mixing effectiveness because once the mxied fluid stream achieves free stream velocity downstream of T junction, the flow and temeperature will become steady
EFFECT OF MOMENTUM RATIO
as can be seen from above table, as momentum ratio increases for a fixed length of pipe, thermal mixing effectivenss increases as noticeable from standard deivation of temperature, average temperature value at outlet and also from contour plots. more uniform temperature is attained as momentum ratio increases.