Week 1- Mixing Tee
ANSWER-Steadt state simulation of mixing tee to check effectiveness
CASE-1
Mixing tee of given dimesion(short length)has been taken for simulation
FILE>open>choose file
go prepare>extract>volume>select edges >click ok
in outline hide solid by unchecking solid and right click>suppress for physics
after this volume of model as shown in following image
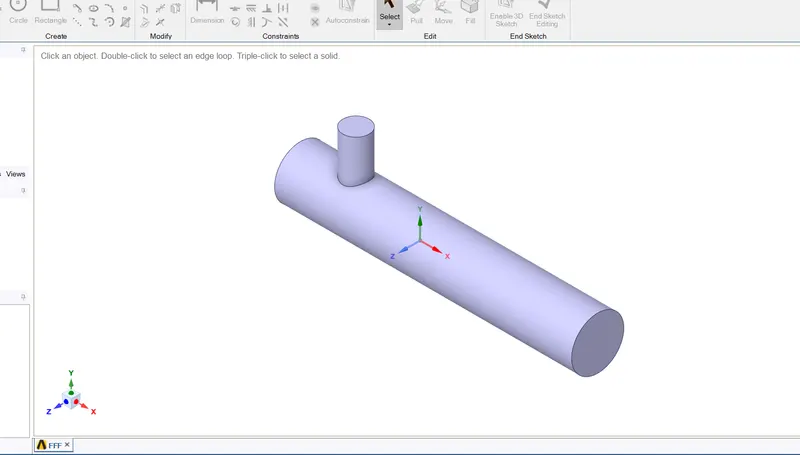
go for meshing
create named selection
input-y(cold fluid_
input-x(hot fluid)
wall
outlet
double click mesh
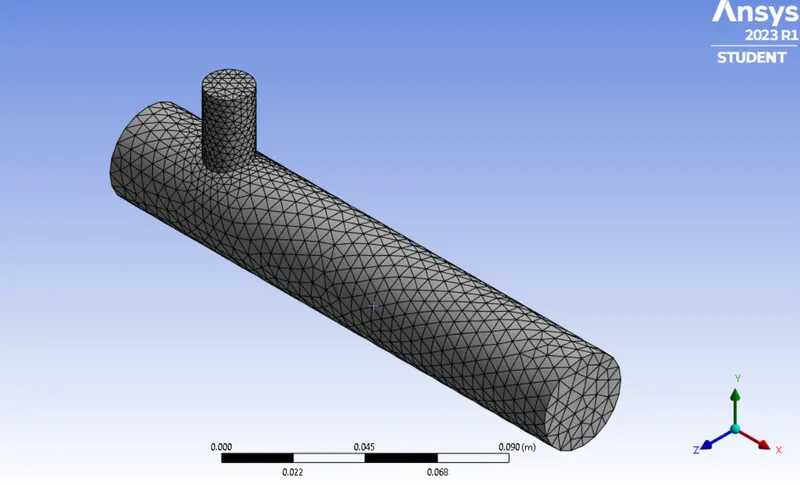
keep mesh element size as Default(10mm)
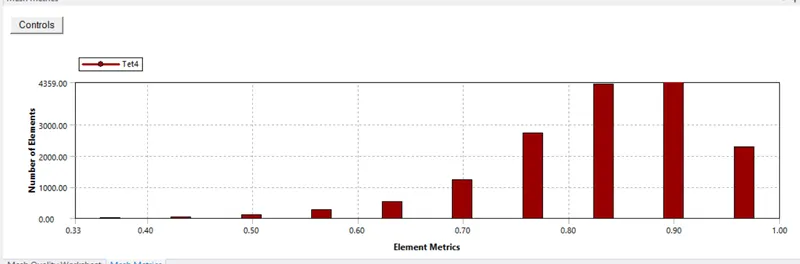
quality>mesh metric>element quality
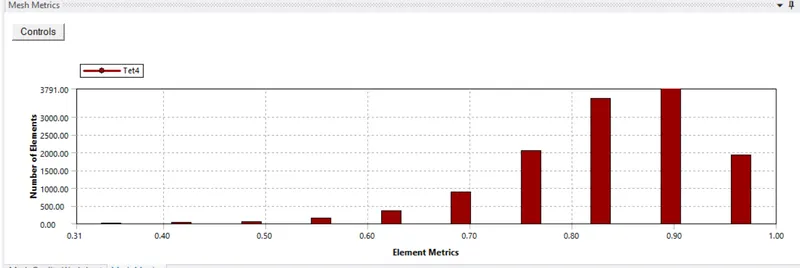
right clck>generate mesh
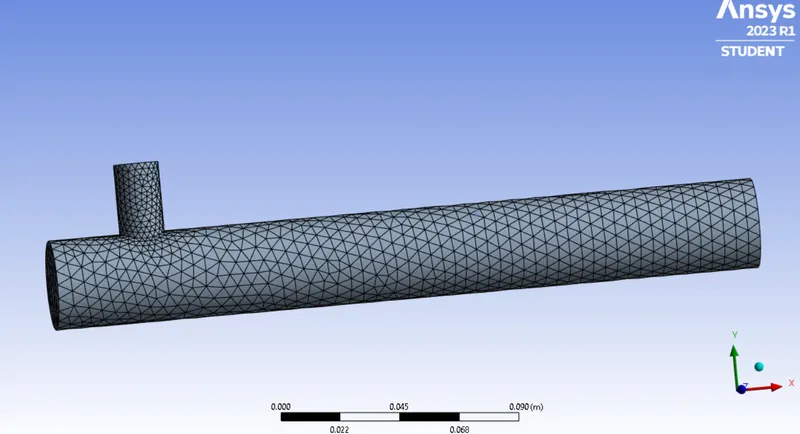
meshed model as shown below
set up for physics
case1-WHEN PIPE LENGTH IS SHORT
A-when momentum ratio is 2
i)
using viscous model as k-epsilon model
check for energy equation
material as air
boundary conditions as
inlet-x velocity 3m/s and temperature 36 deg
inlet-y vel. 6m/s (cosidering momentum ratio as 2) and temp. 19 deg
outlet at atmoshpheric pres
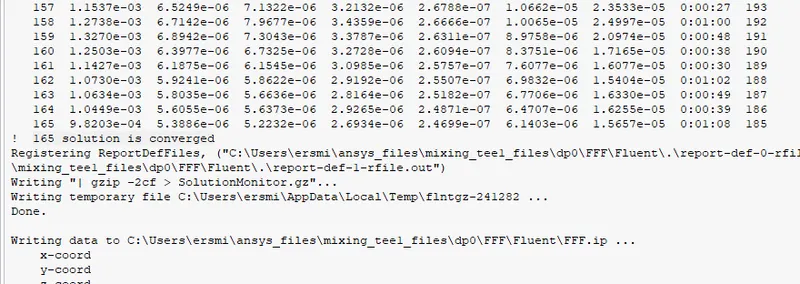
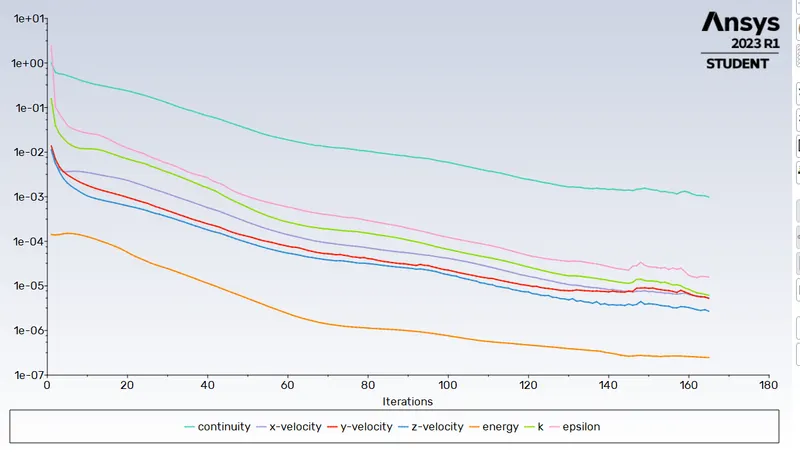
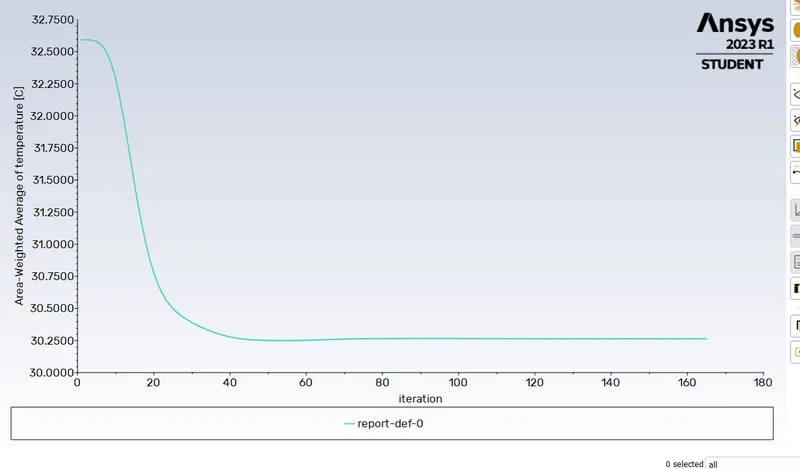
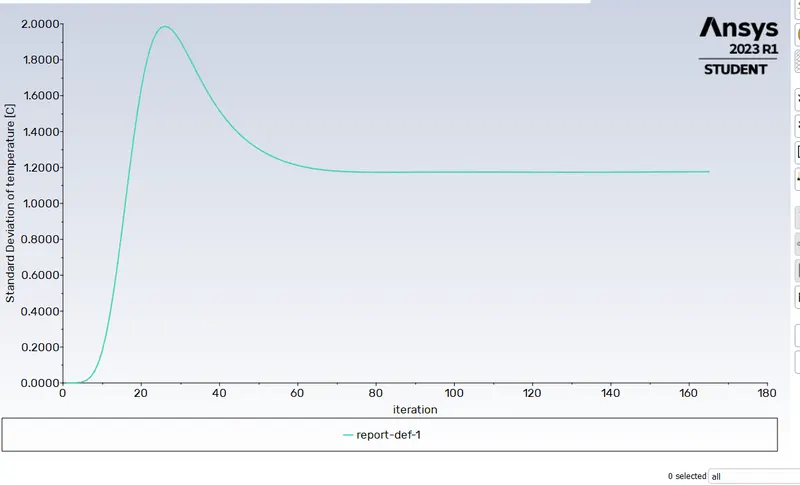
--solution converged in 165 iterations
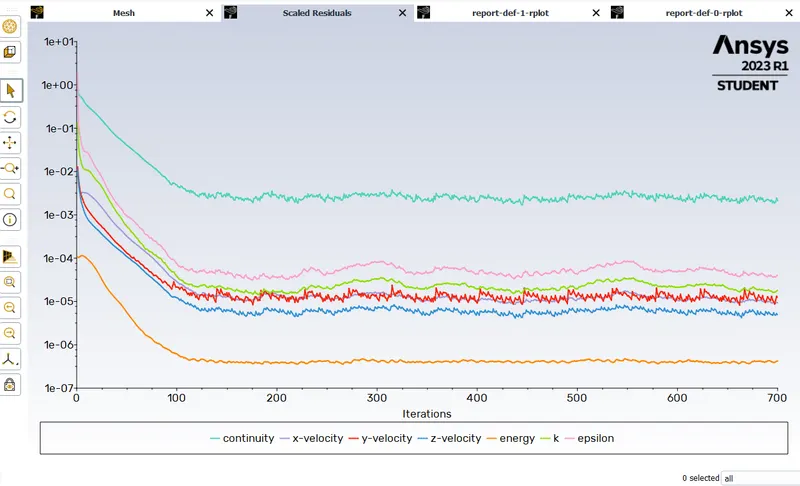
scale residuels shows solutions has been converged
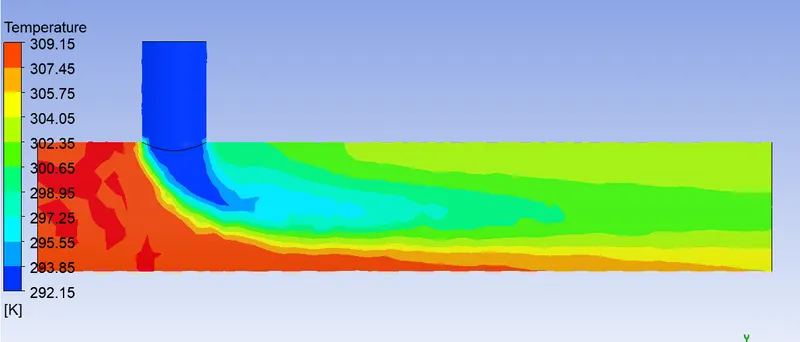
1-temperature contour on a plane at z=0 along length of mixing tee
it shows fluid coming fron both inlet at their initial temperature start mixing and gradually along the length, temperature is reduced and more uniform across the diameter
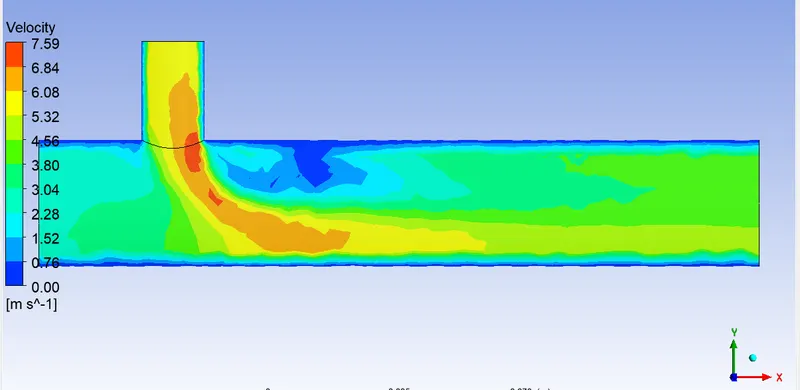
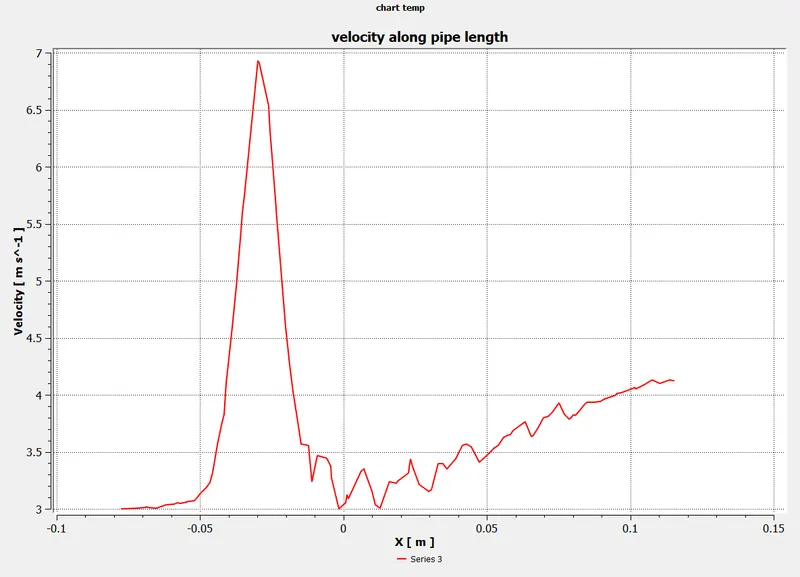
2-velocity contour along the length shows velocity of fluid in the vicinity of the wall is zero and gradually increases to their stream velocity.
At the point of just mixing velocity is random at each point along the diameter and gradually along the length becomes more uniform
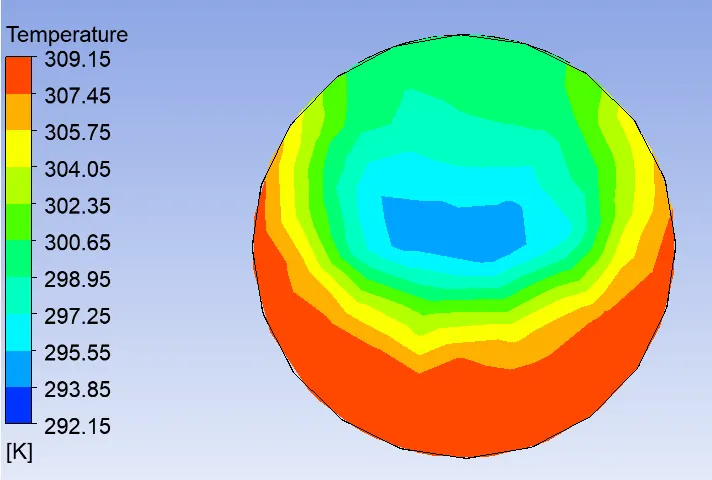
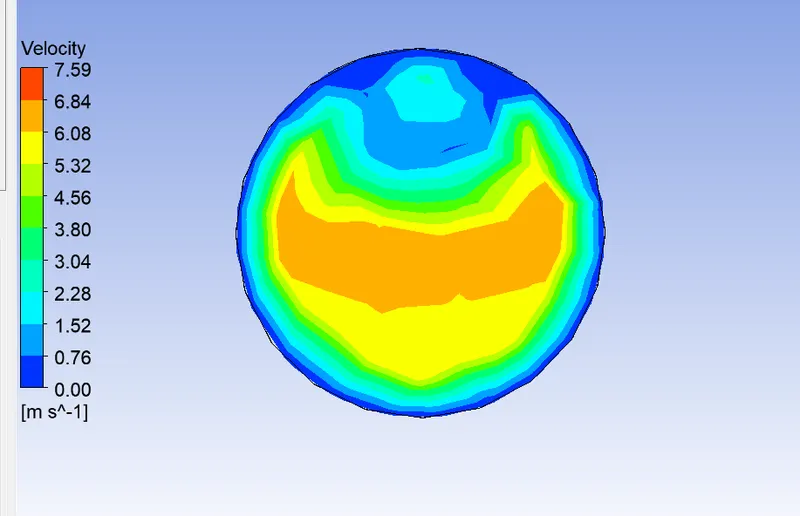
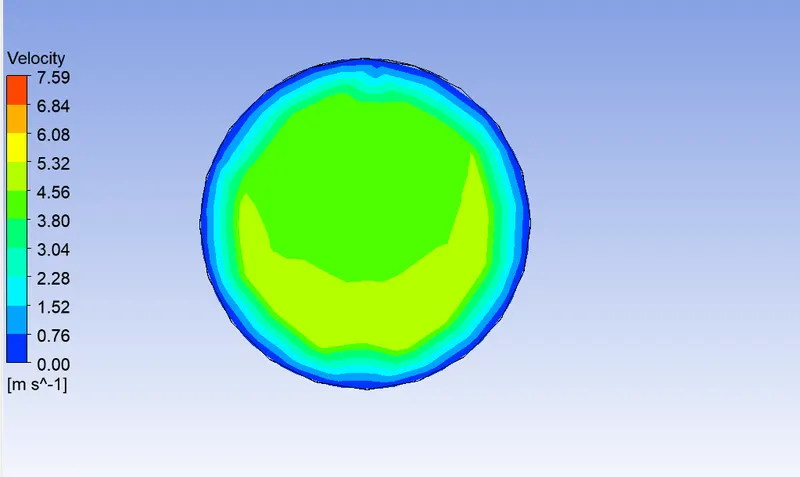
3-Temperature and velocity contour on crossectional plane at a distance of 25mm from origin.
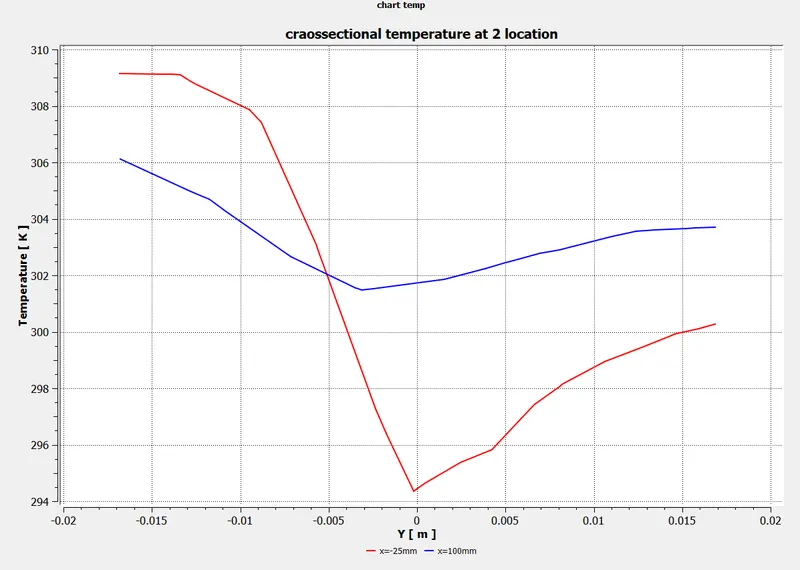
thrust of high velocity cold fluid pushes hot fluid down hence at the bottom of pipe near T-Section is higher tempertature
its reducing towards centre
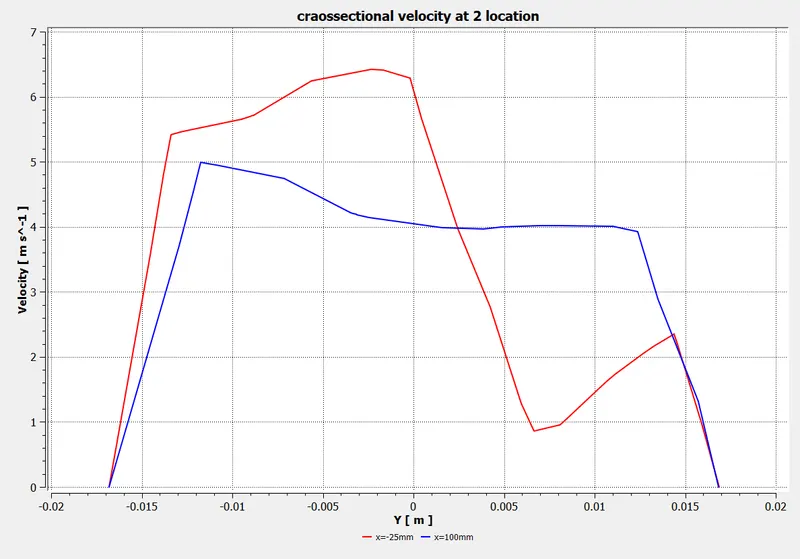
velocity around the peripheri is zero and haphzard across due to mixing
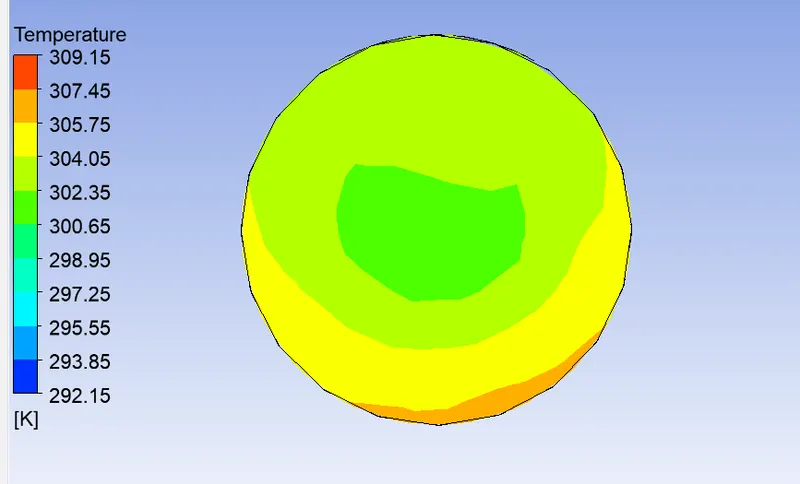
4-Temperature and velocity contour on crossectional plane at a distance of 100mm from origin.
temperature has become more uniform and lesser due to great amount of mixing down the pipe line
velocity is also become more uniform due to mixing
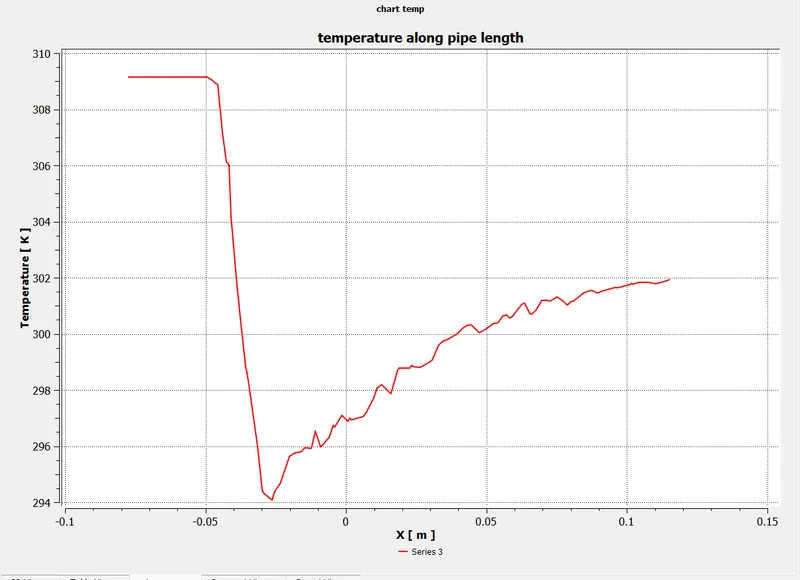
5-Temperature and velocity line plot at two different crossection along the length
6-Temperature and velocity line plot at the centre along the length
ii)
using viscous model as k-omega model
check for energy equation
material as air
boundary conditions as
inlet-x velocity 3m/s and temperature 36 deg
inlet-y vel. 6m/s and temp. 19 deg
outlet at atmoshpheric press
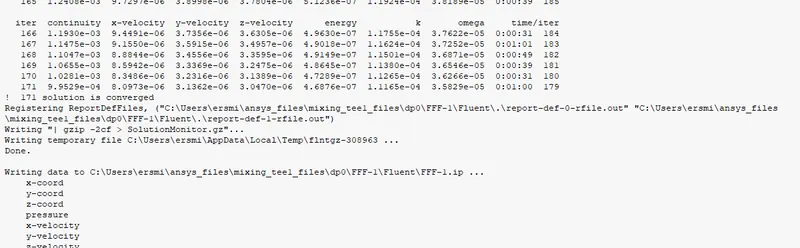
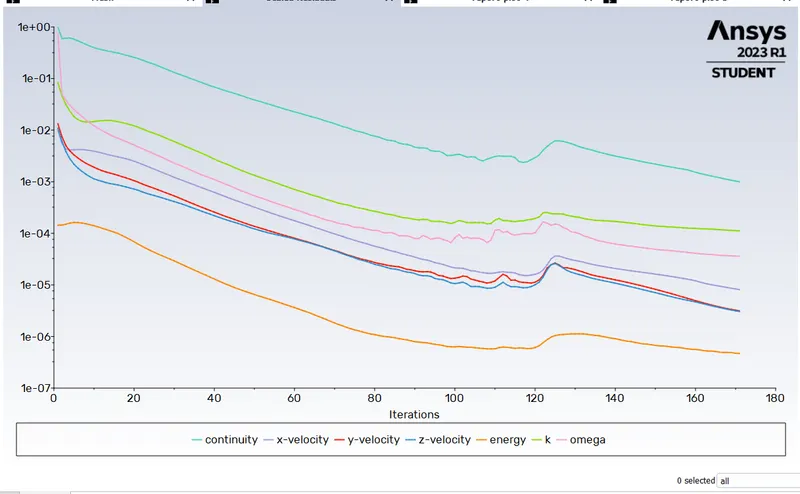
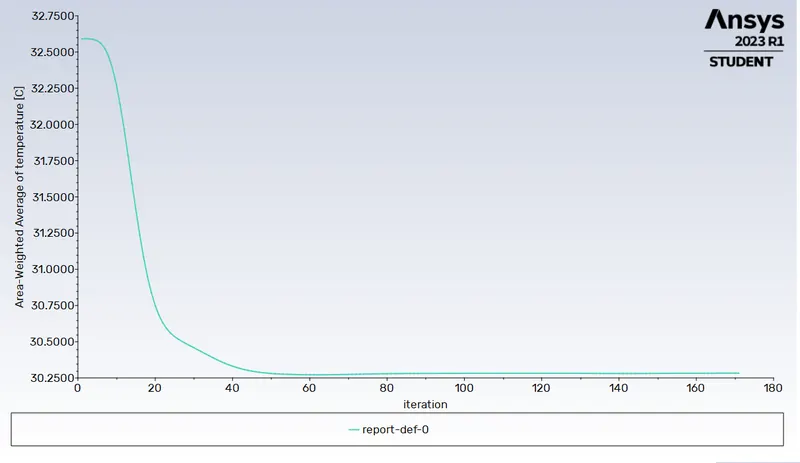
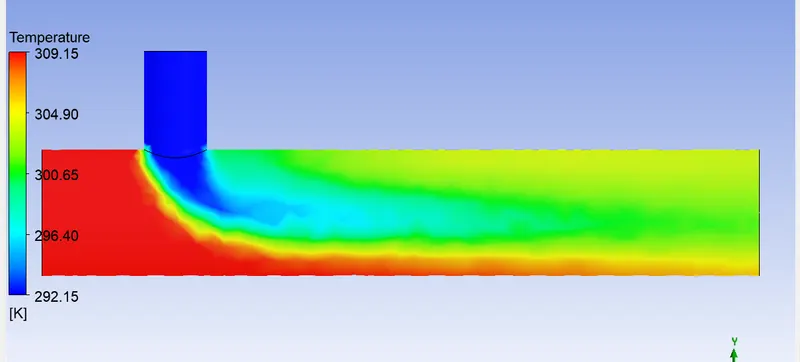
solution conveged in 171 iterations
conclusion-Since time taken in k-epsiln model is less compared to that in k-omega model hence for further study k-epsilon model has been used.
B-
when momentum Ratio is 4
using viscous model as k-epsilon model
check for energy equation
material as air
boundary conditions as
inlet-x velocity 3m/s and temperature 36 deg
inlet-y vel. 12m/s and temp. 19 deg
outlet at atmoshpheric pres
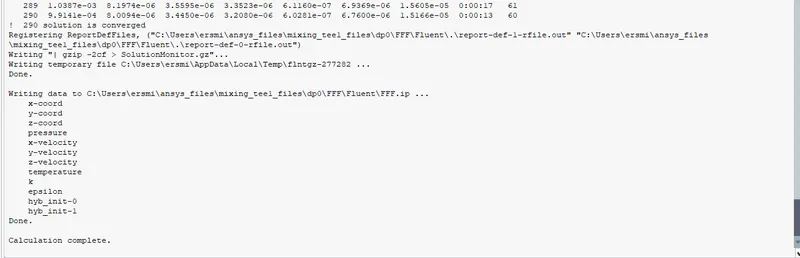
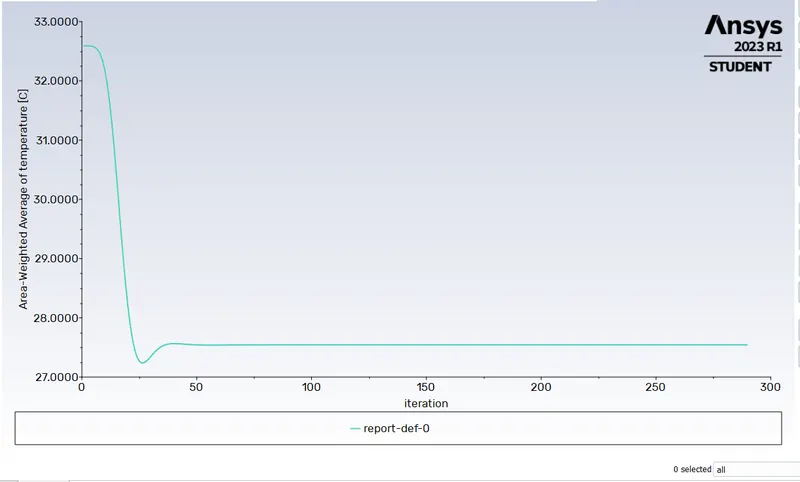
scale residuels shows solutions has been converged
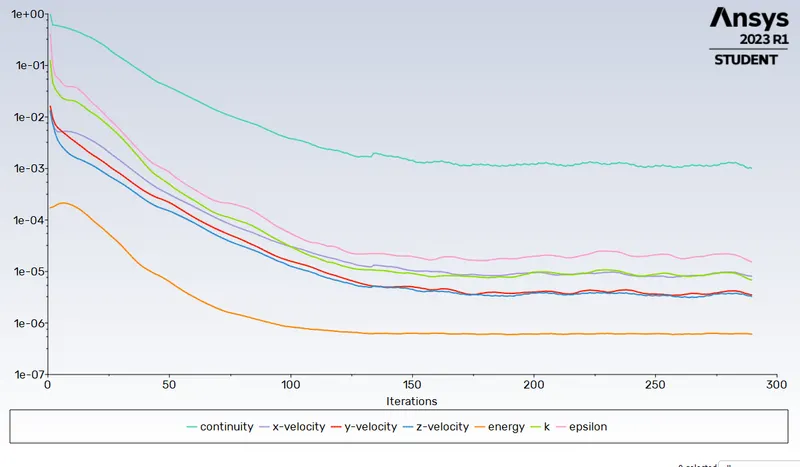
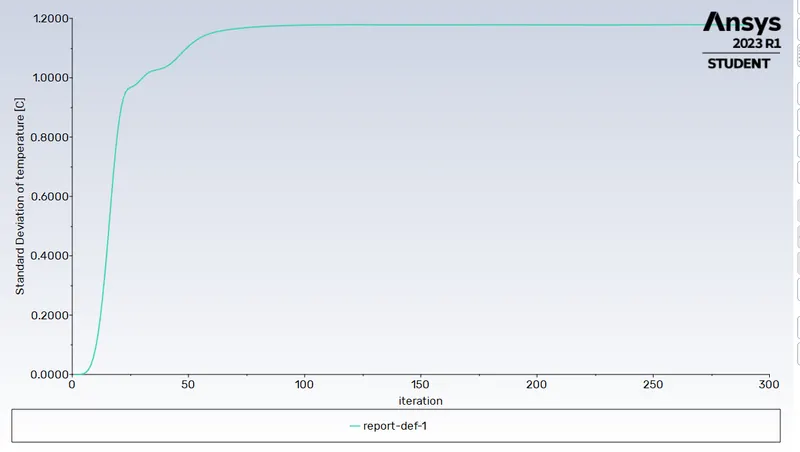
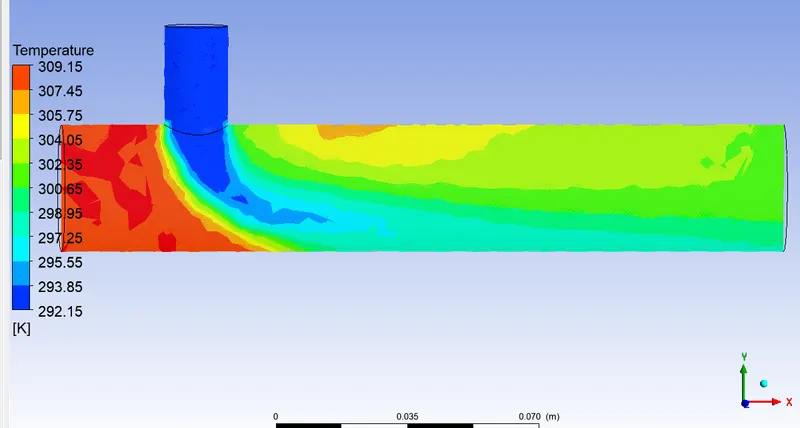
1-temperature contour on a plane at z=0 along length of mixing tee
it shows fluid coming fron both inlet at their initial temperature start mixing and gradually along the length, temperature is reduced and more uniform across the diameter
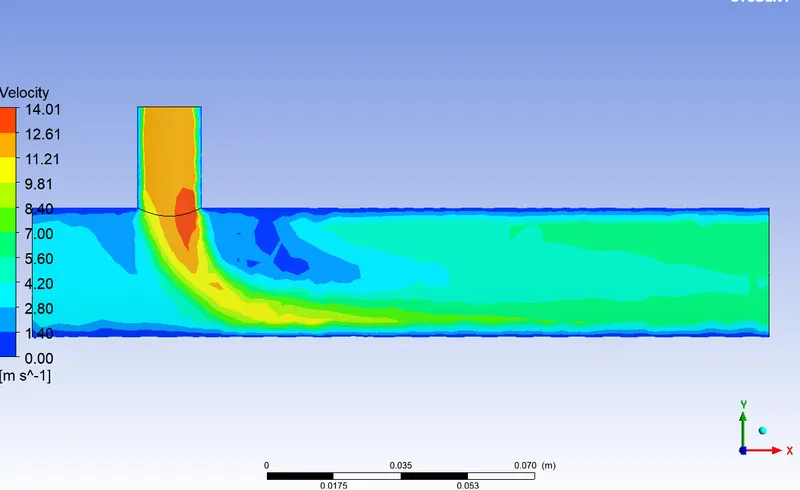
3-Temperature and velocity contour on crossectional plane at a distance of -25mm from origin.
thrust of high velocity cold fluid pushes hot fluid down hence at the bottom of pipe near T-Section is higher tempertature
its reducing towards centre
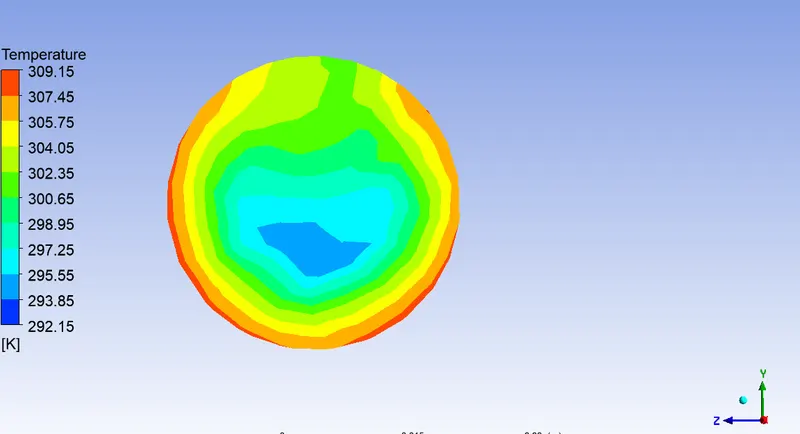
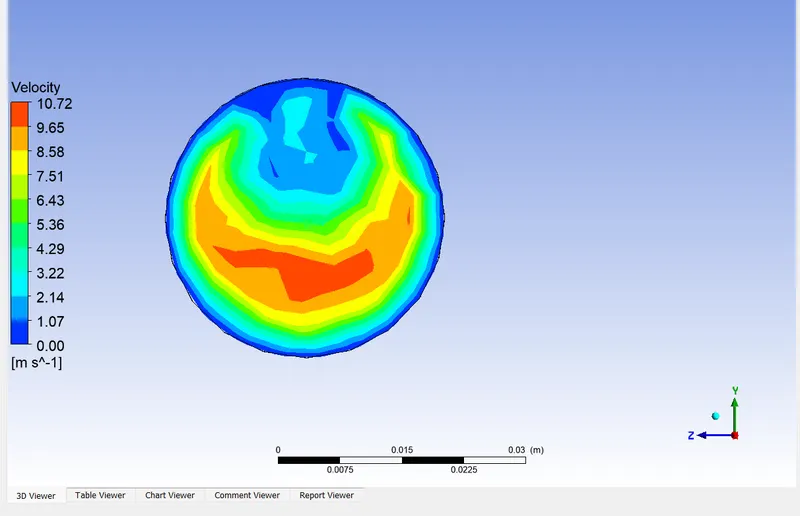
4-Temperature and velocity contour on crossectional plane at a distance of 100mm from origin.
temperature has become more uniform and lesser due to great amount of mixing down the pipe line
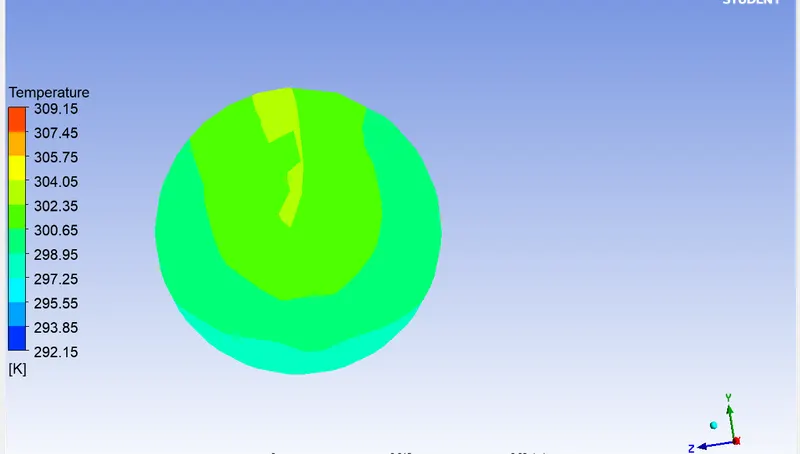
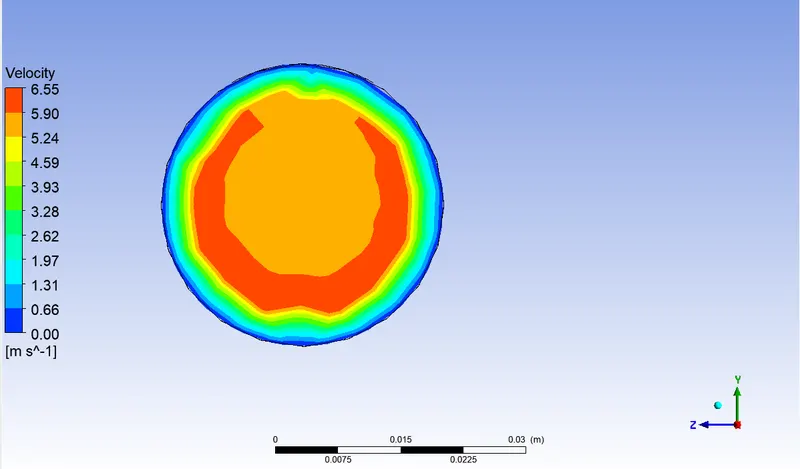
5-Temperature and velocity line plot at two different crossection along the length
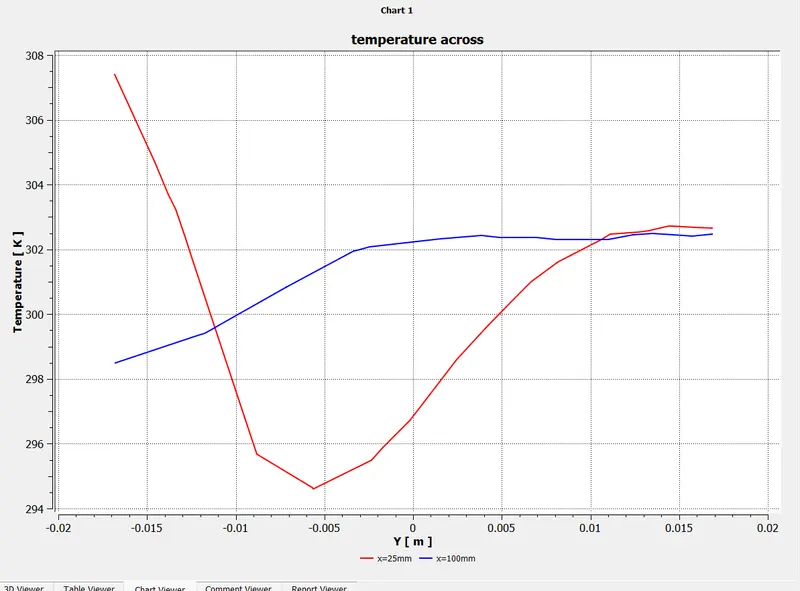
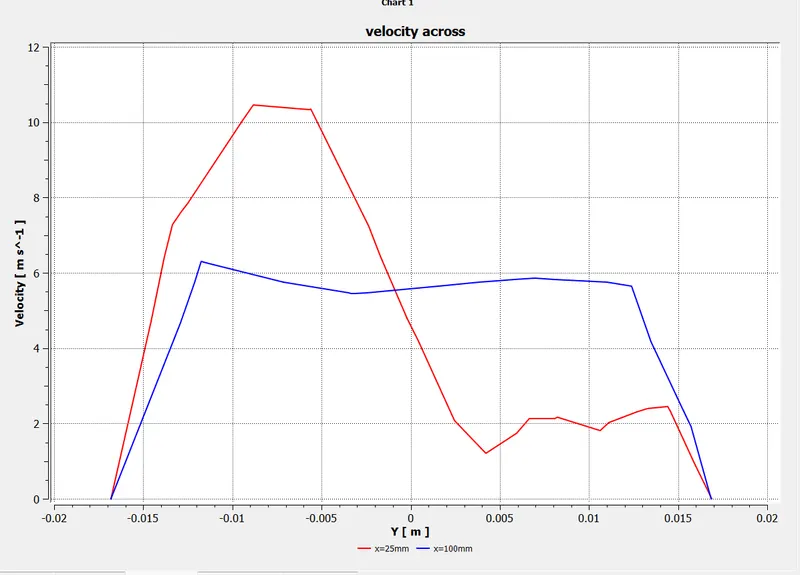
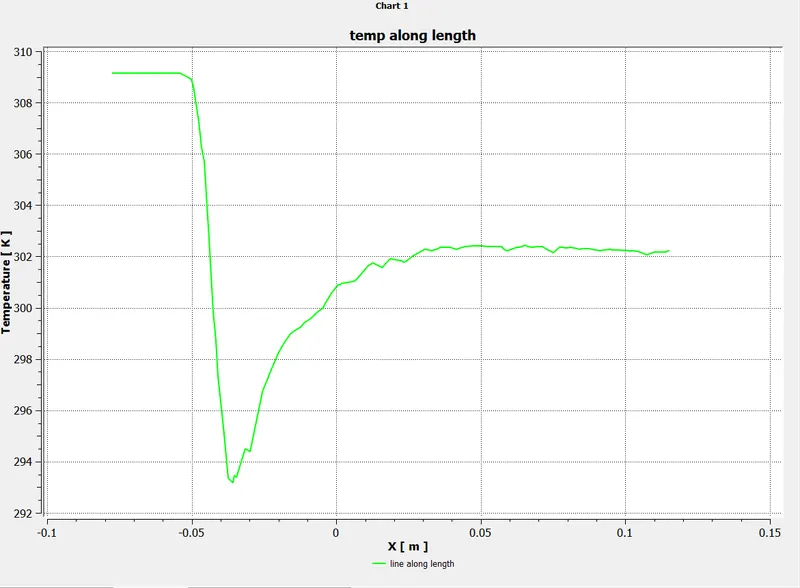
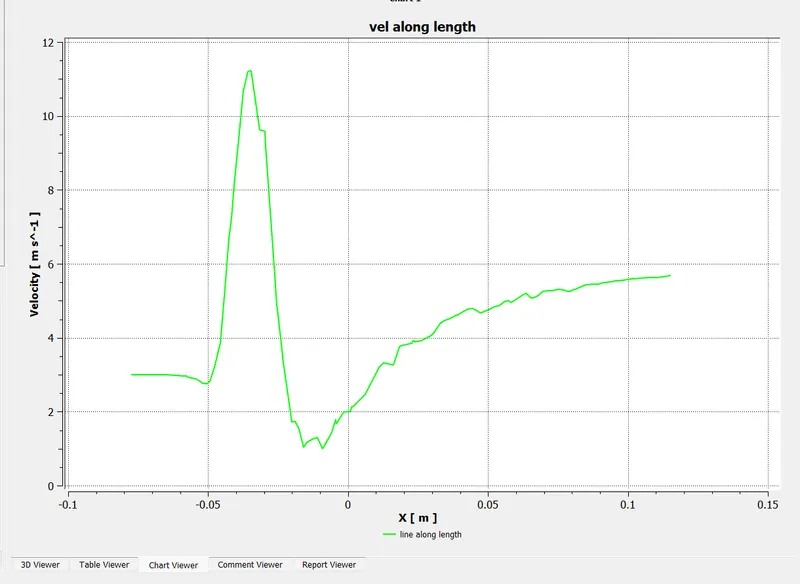
5-Temperature and velocity line plot along the length
CASE-2 WHEN PIPE LENGTH IS LONG
A)
MOMENTUM RATIO IS 2
1-temperature contour on a plane at z=0 along length of mixing tee
it shows fluid coming fron both inlet at their initial temperature start mixing and gradually along the length, temperature is reduced and more uniform across the diameter
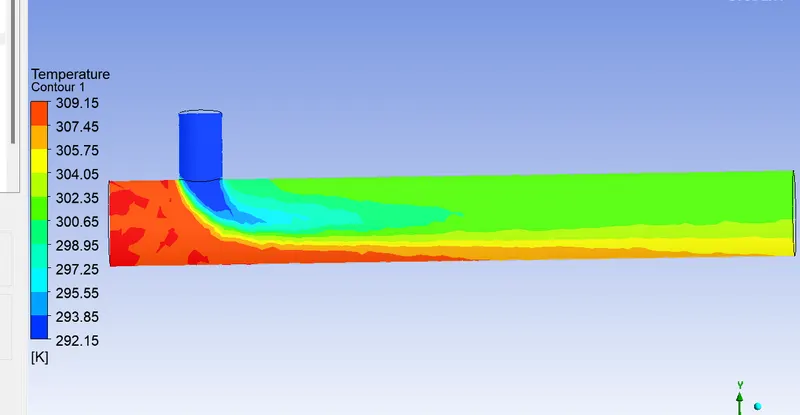
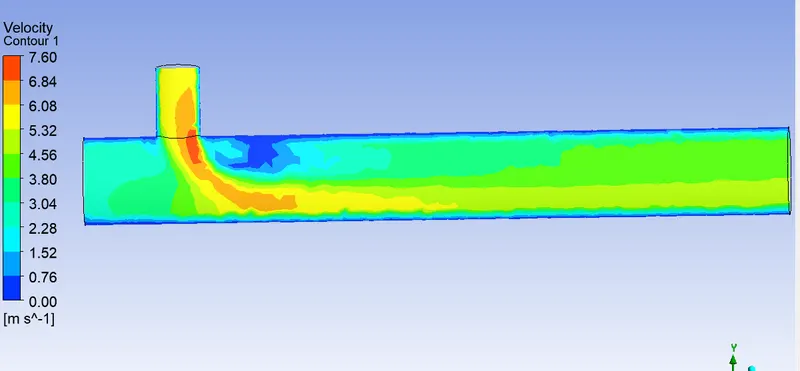
4-Temperature and velocity contour on crossectional plane at a distance of -30mm from origin.
temperature has become more uniform and lesser due to great amount of mixing down the pipe line
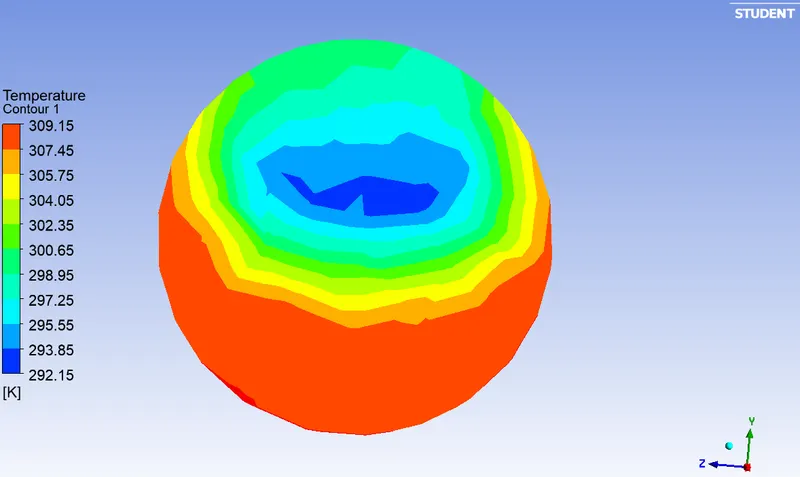
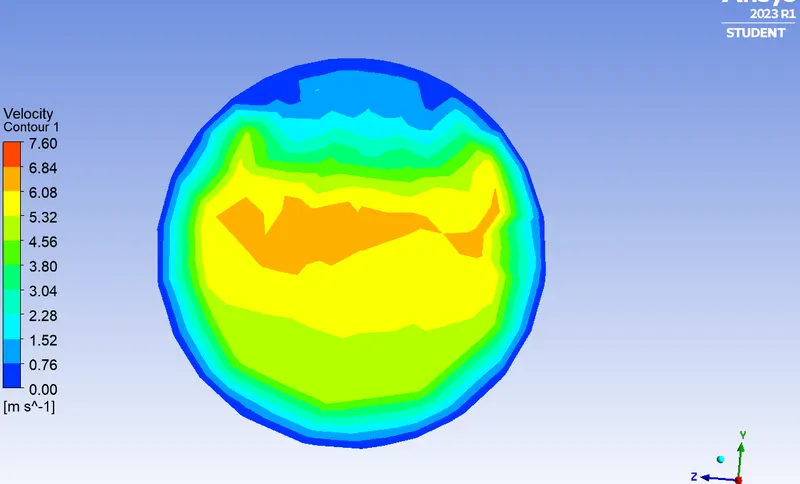
4-Temperature and velocity contour on crossectional plane at a distance of 170mm from origin.
temperature has become more uniform and lesser due to great amount of mixing down the pipe line
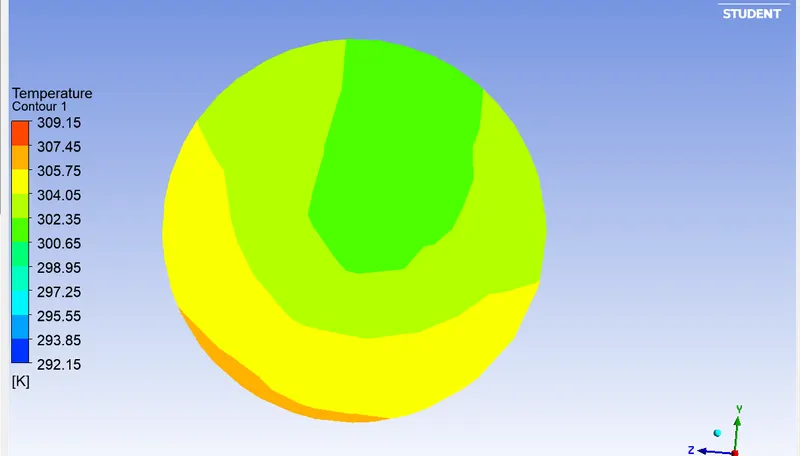
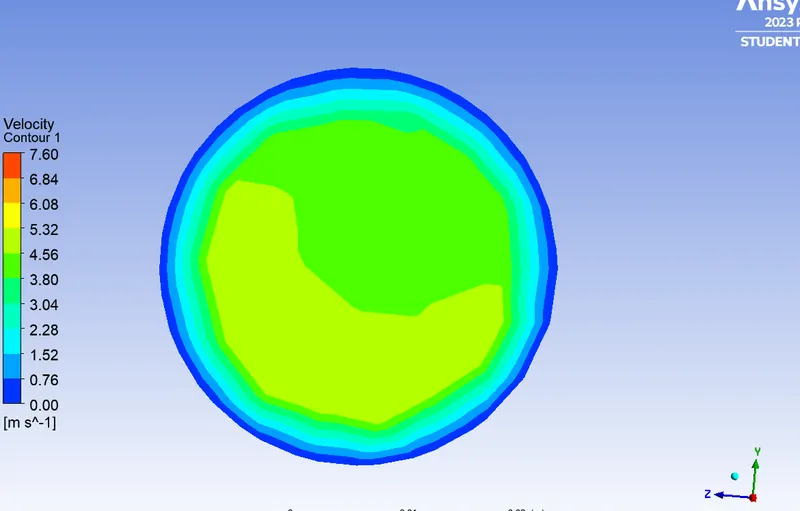
5-Temperature and velocity line plot at two different crossection along the length
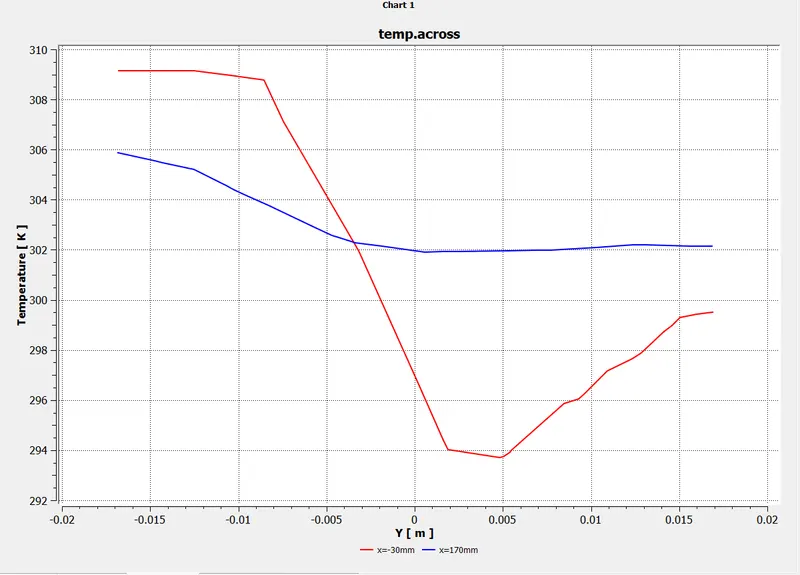
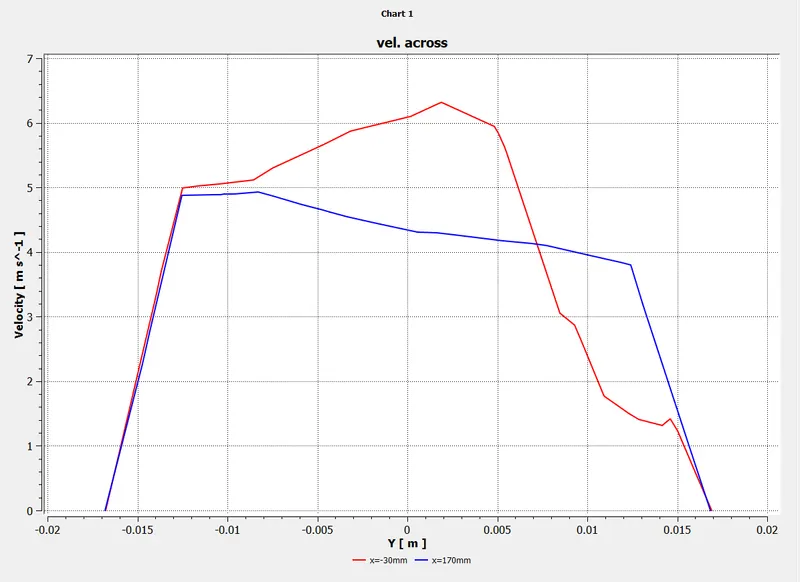
6-Temperature and velocity line along the length
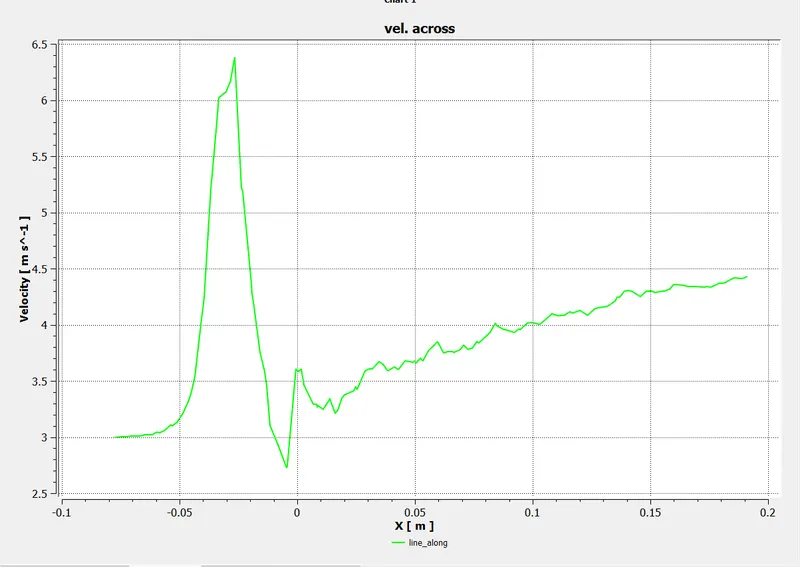
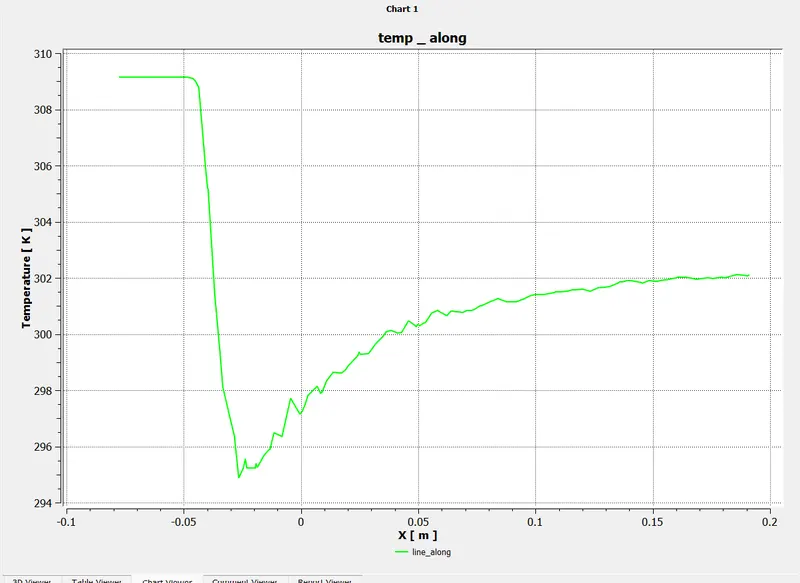
TABLE-
|
short pipe momentum ratio=2 |
short pipe momentum ratio=4 | long pipe momentum ratio=2 | long pipe momentum ratio=4 | |
| cell count | 12692 | 12692 | 15727 | 15727 |
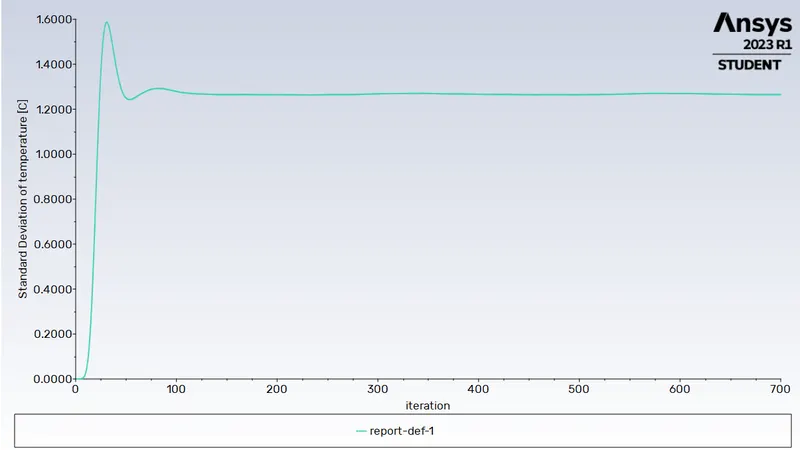
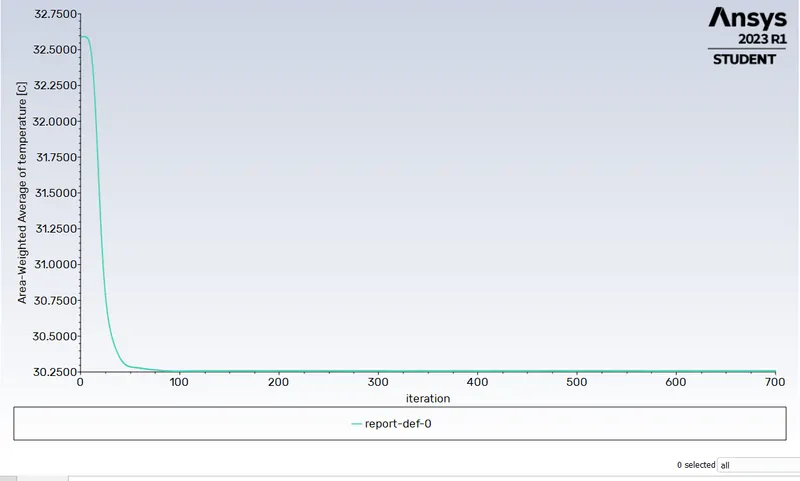
| avg outlet temp(deg) | 30.26 | 27.54 | 30.25 | 27.49 |
| no of iteration for convergence | 165 | 209 | 350 | 126 |
| element size(mm) | 10 | 10 | 13.8 | 13.8 |
CONCLUSIONS
1-with the increase in momentum ratio mixing effectivness is incresed hence for same length of pipe reduced temperature at the outlet is achieved.
2-with the increse in length of pipe there has not been significant chane in effectivness.
3-along the length temperature and velocity of mixed fluid become more uniform.
GRID INDEPENDENCE TEST-
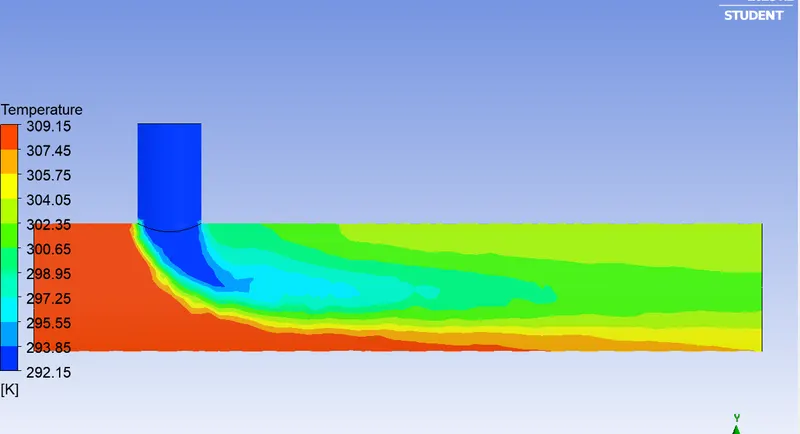
1-when mesh element size is 10mm-no of elements are 12629 average outlet temperature is 30.25 deg.
temperature contour is shown in figure
2-when mesh element size is 5mm-no of elements are 14249 average outlet temperature is 30.25 deg.
temperature contour is shown in figure
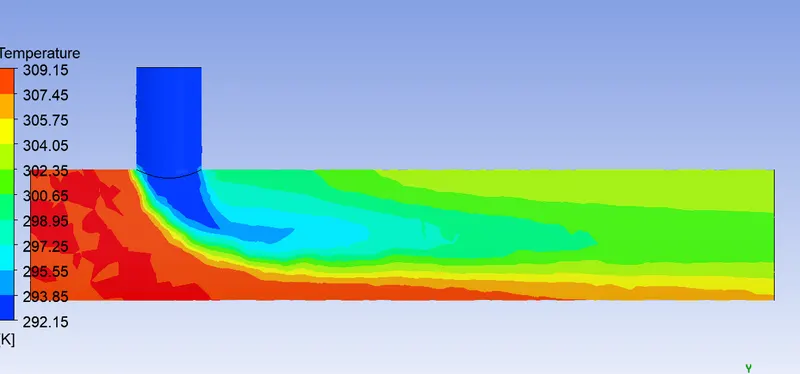
conclusion-grid dependency can not be seen in this geomety except little change in capture of feature