Week 1- Mixing Tee
AIM: To set up Steady State Simulation to compare the mixing effectiveness of hot and cold airflow by using the K-epsilon and K-omega model
In steady state simulation, generally, the value of the particle at a particular location is not changed with respect to the time, or we can say that it is independent of time constraints;
We generally perform such analysis to get the real idea behind such scenarios when perform in the almost actual environment;
In such model we generally mix the two streams of fluid at a different temperature and respective velocity and analyze the mixing consequence of the respective models.
Procedure & Set-up of Pre-Processor and Solver (Short T):
- Initially we import the model into space claim, such that, to extract the fluid surface from the solid geometry by using the volume extract under the prepare tab.
- Once it done, we suppress the solid body by using the option of suppress it from the physics (generally to suppress it from the mesh generation procedure)
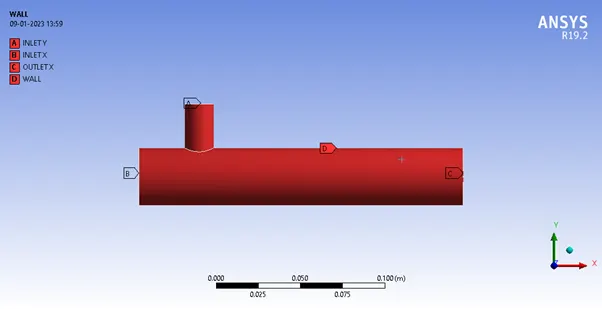
- Then, we switch to the mesh option, to geneate the mesh, initially we done the name selection procedure are as follow:
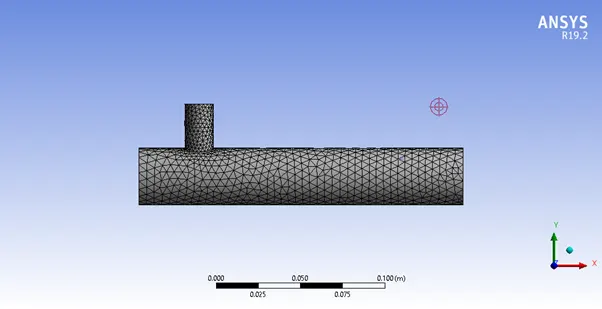
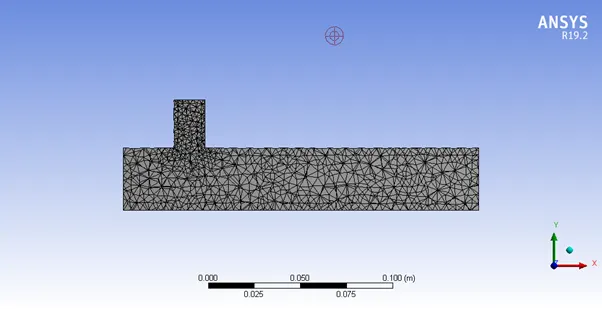
- Then we generate the mesh, using element size of 5mm, the generated mesh are as follow:
-
Fig: Section plane mesh view
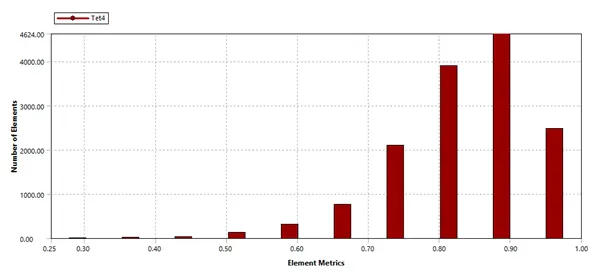
- Then, we check the mesh quality by using quality tab and further to mesh metric and element quality, the graph are as follow:
-
As the lowest element metrics is 25% which is above the 5%, therefore the quality of mesh is fine.
- After that, we moved to the setup tab, to setup the model for simulation and using the double precision option for better analysis
- In such tab, initially we check the mesh by using check mesh tab, once it done, we move further
-
CASE 1A: Momentum Ratio=2, K-epsilon Model
- Now we moved to the setting up physics tab, where we select
- Steady time based
- Pressure based type
- Under model tab: viscous: k-epsilon/k-omega (as required)
- Then, we select the material to be fluid as air (check it further from cell zone too)
- Finally set the boundary conditions :
- Hot fluid: inlet velocity=3m/s, inlet temp.=36C
- Cold Fluid: inlet velocity=6m/s, inlet temp: 19C
- Once, the condition has been set, we set up for the report tab:
- Under definition tab, we select the surface report as area weighted average and std. deviation report for the temperature field for the outlet condition.
- Finally, we run the solver, once the hybrid initialization is done, we run the study, by using 200 as number of iteration.
Post Processing & Conclusion (Short T)
- Mesh Information:
- of nodes: 3152
- of elements (tetra): 14322
- Element Size: 5mm
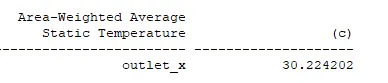
- Average Outlet Temp: 30C
- Of iteration for Convergence: 200
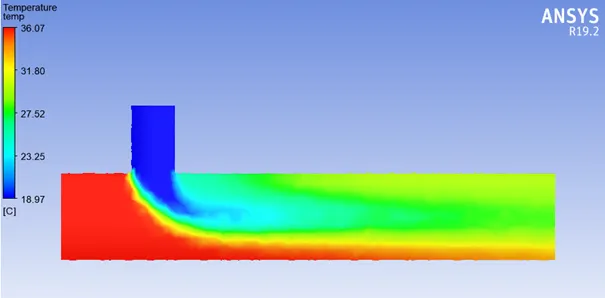
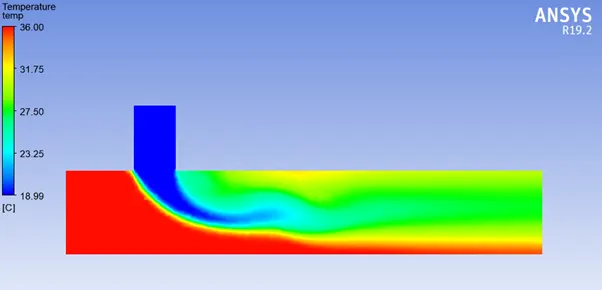
- Following is the temperature contour plot along the T section:
-
As the inlet temperature of the hot and cold fluid is around 36C and 19C and the average outlet temperature is coming out to be 28C
- Temperature Plot Across the T:
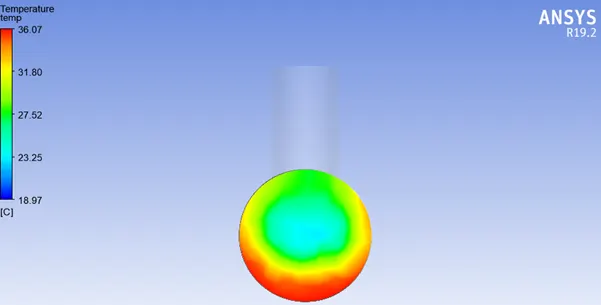
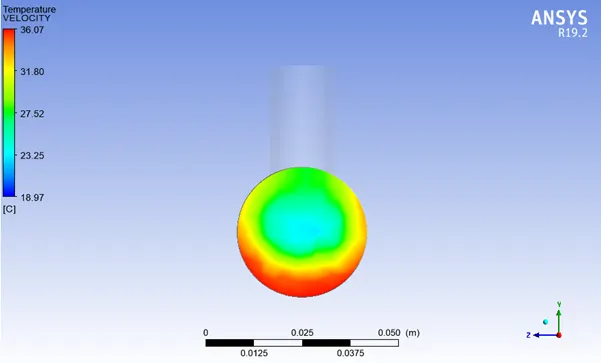
As it is evident that the temperature is more over the wall surface as compared to the center (as proper mixing takes place)
Following is the probe analysis that has been done to know the temperature over the region:
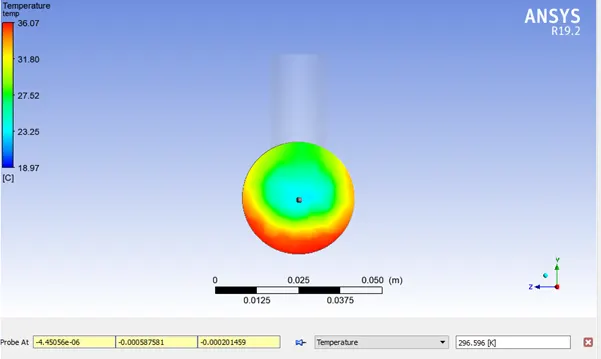
Which comes out to be around 296.596K which is almost equal to the calculated theoretical value of temperature as per the given mixing formula, which comes out to be 297.66K
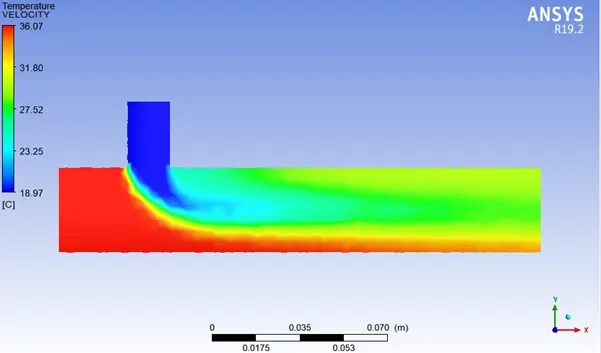
- Following is the velocity contour along the T section:
- Following is the velocity contour across the T section:
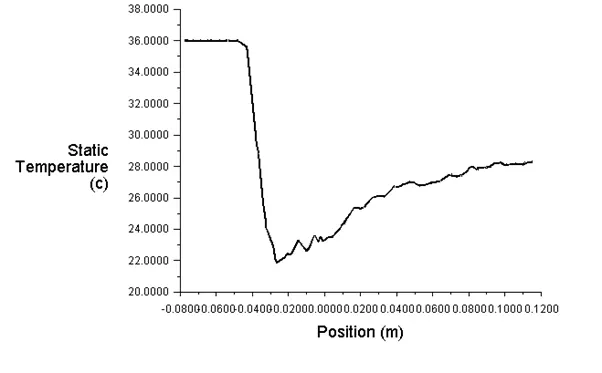
- Following is the Temperature Line Plot along the T section:
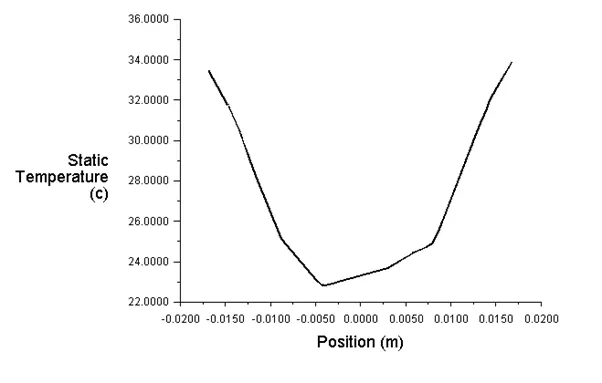
- Following is the temperature plot across the T:
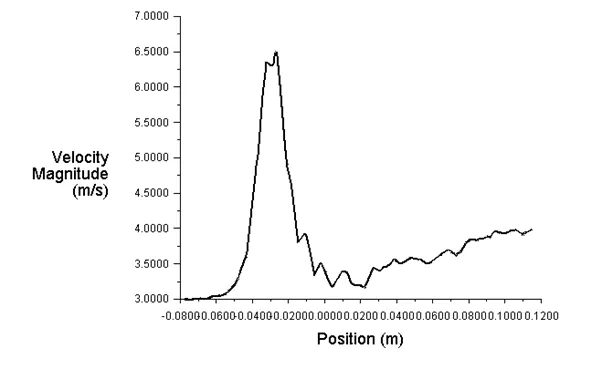
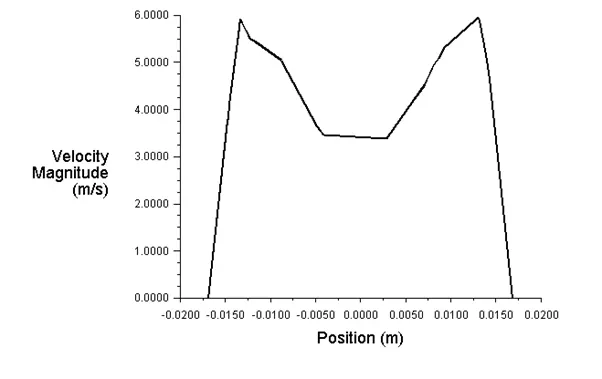
- Following is the velocity plot along the T:
- Following is the velocity plot across the T:
- Average Outlet Temperature:
-
And, the calculated value of the outlet temperature using the given formula is coming out to be 30.33C, therefore we can conclude that, the given analysis is correct.
CASE 1B: Momentum Ratio=4, K-epsilon Model
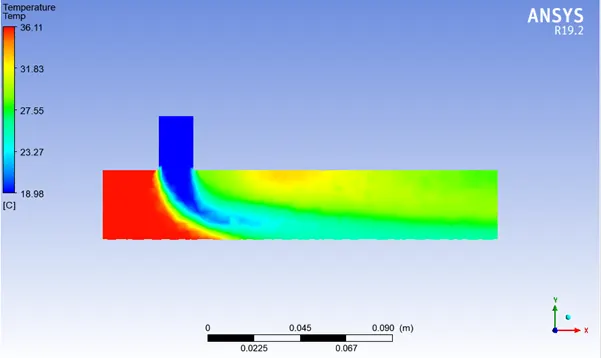
- Following is the Temperature Contour Plot along the T section:
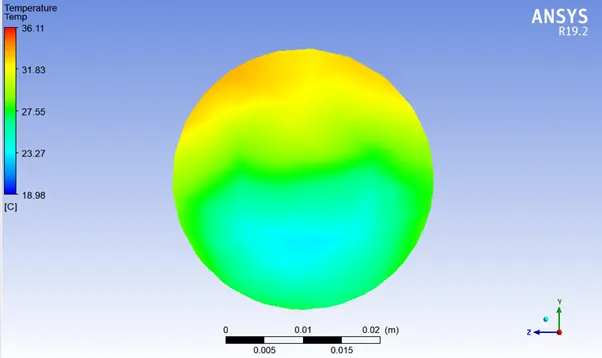
- Following is the Temperature Contour Plot across the T section:
- Following is the velocity Contour Plot along the T section:
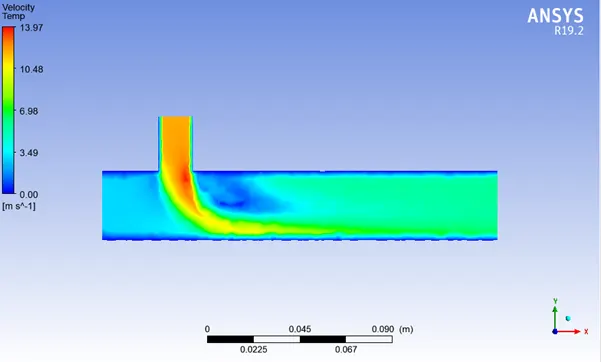
- Following is the velocity Contour Plot across the T section:
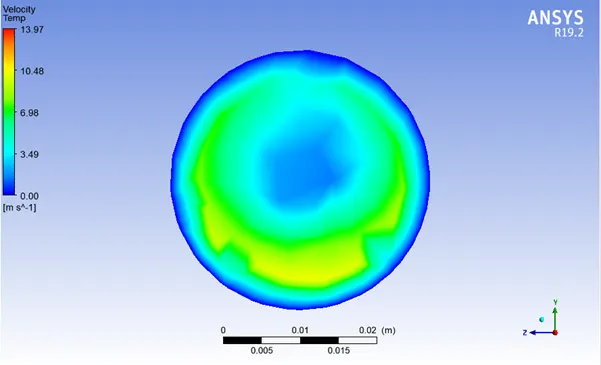
- Following is the Temperature Line Plot along the T section:
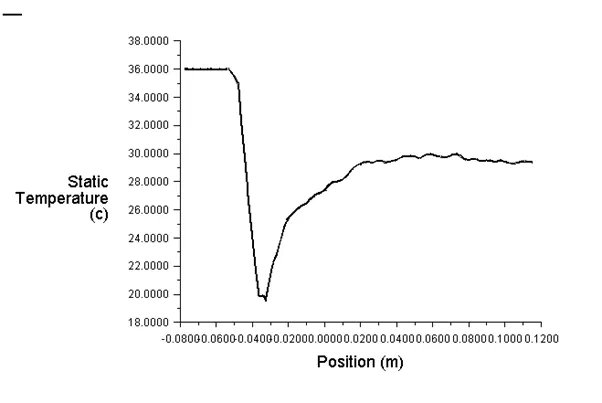
- Following is the temperature plot across the T:
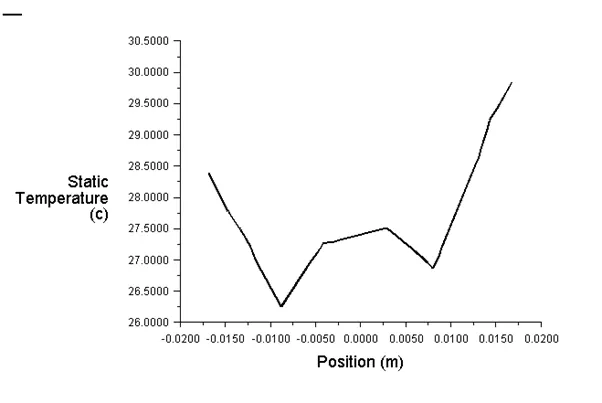
- Following is the velocity plot along the T:
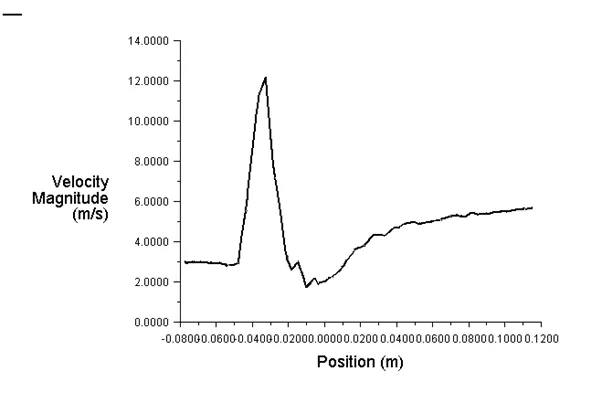
- Following is the velocity plot across the T:
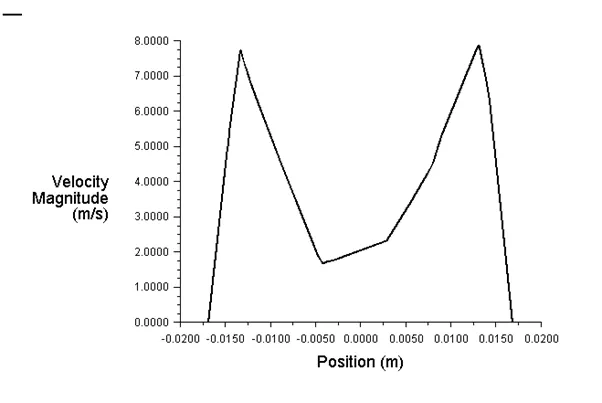
- Average Outlet Temperature:
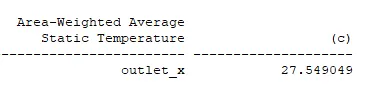
CASE 1C: Momentum Ratio=2, K-omega Model
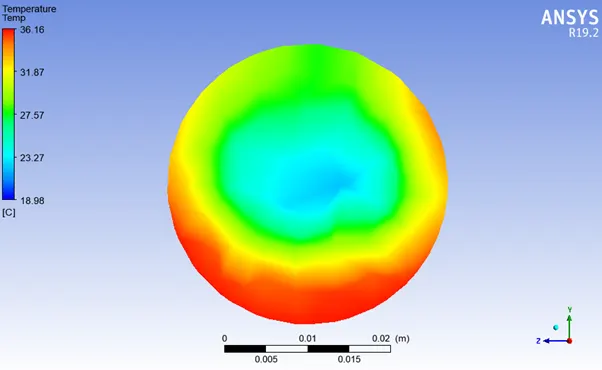
Following is the Temperature Contour Plot along the T section:
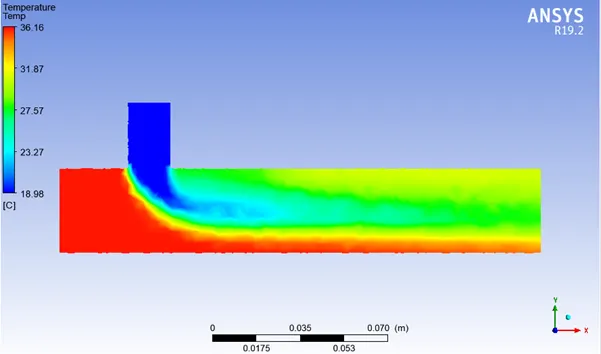
- Following is the Temperature Contour Plot across the T section:
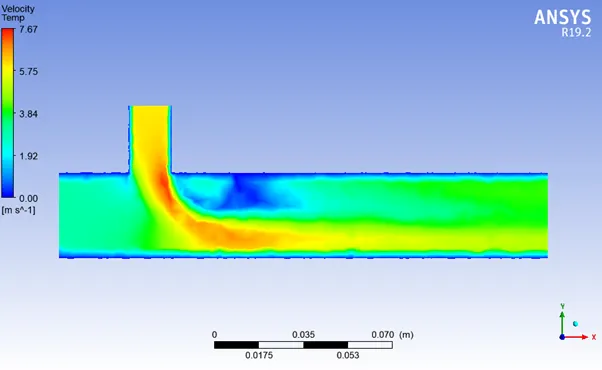
- Following is the velocity Contour Plot along the T section:
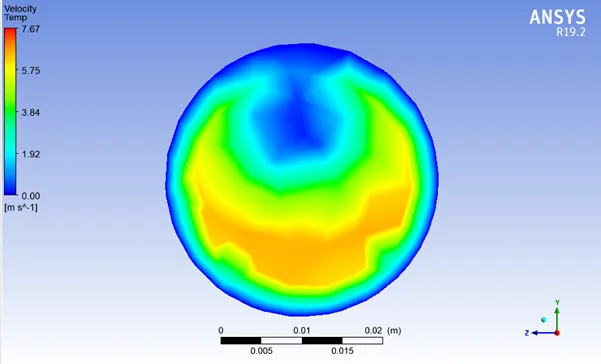
- Following is the velocity Contour Plot across the T section:
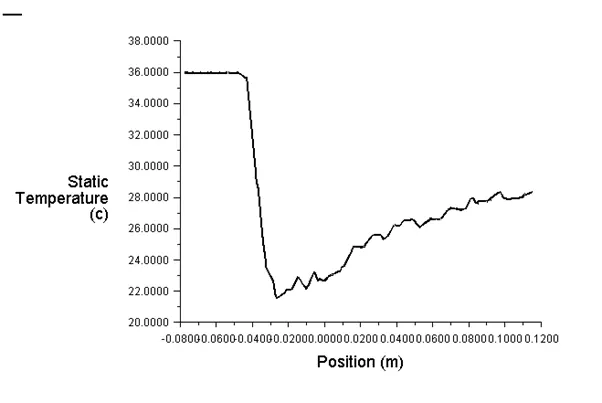
Following is the Temperature Line Plot along the T section:
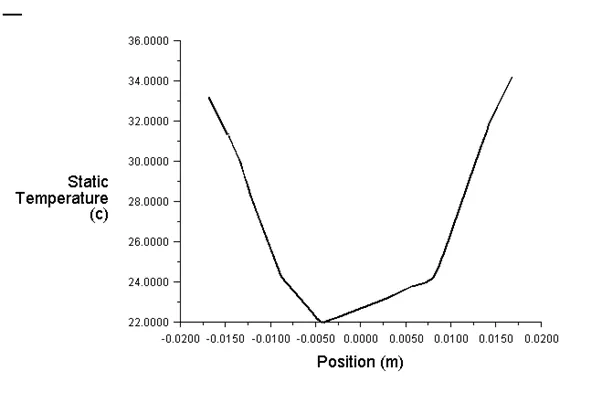
Following is the temperature plot across the T:
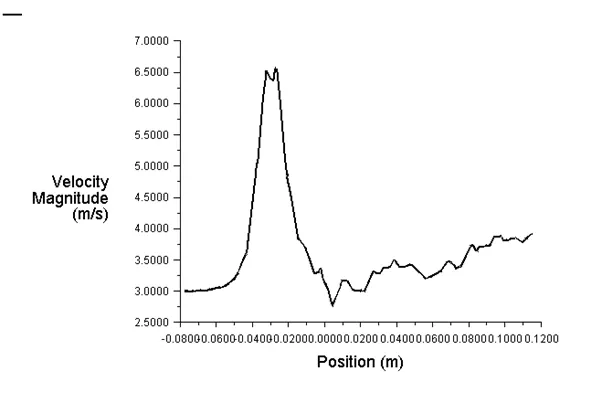
Following is the velocity plot along the T:
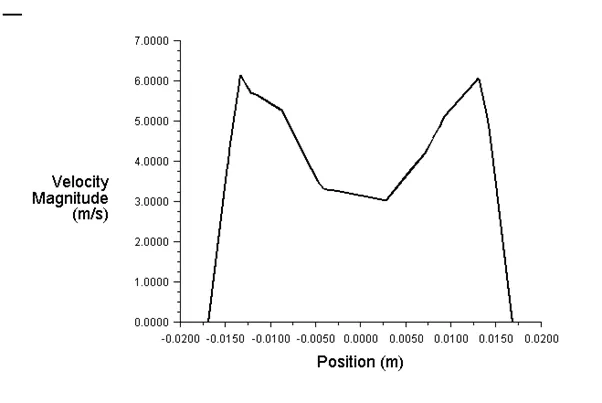
Following is the velocity plot across the T:
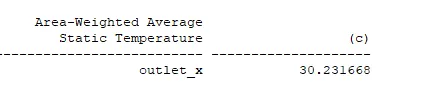
- Average Outlet Temperature:
-
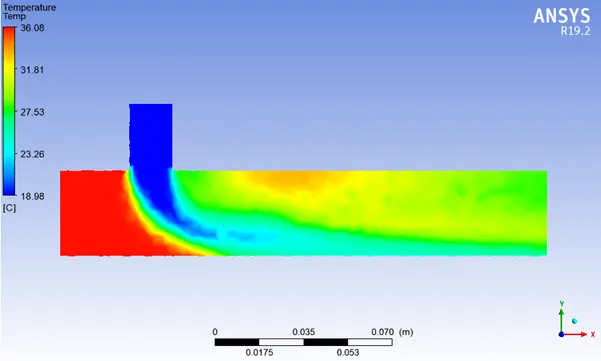
CASE 1D: Momentum Ratio=4, K-omega Model
- Following is the Temperature Contour Plot along the T section:
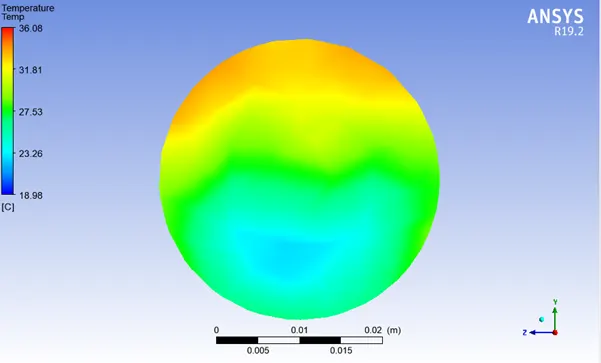
- Following is the Temperature Contour Plot across the T section:
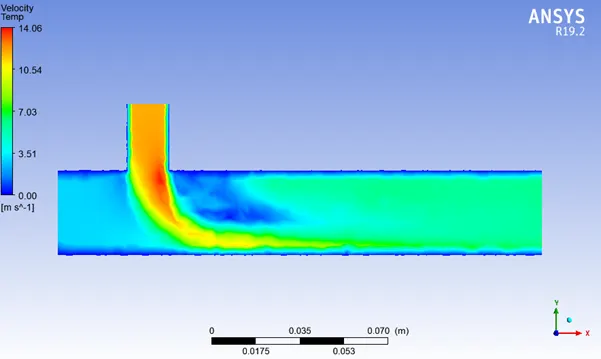
- Following is the velocity Contour Plot along the T section:
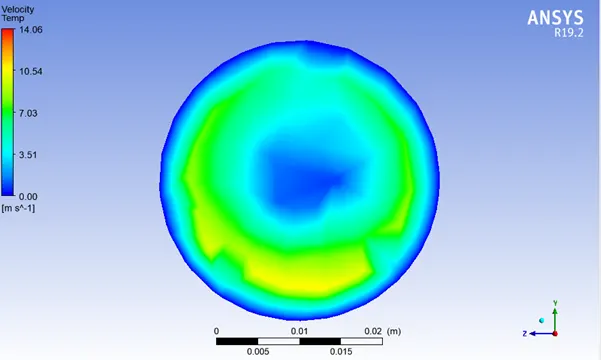
- Following is the velocity Contour Plot across the T section:
- Following is the Temperature Line Plot along the T section:
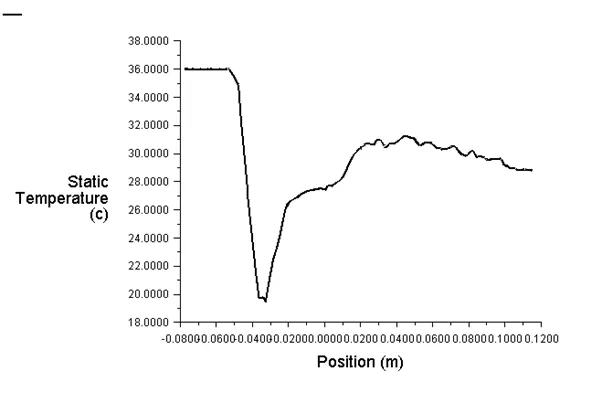
- Following is the temperature plot across the T:
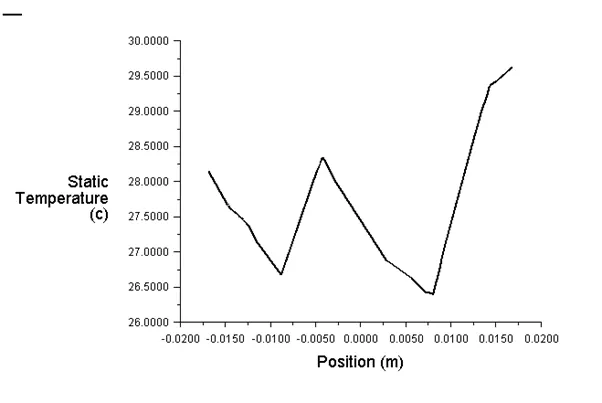
- Following is the velocity plot along the T:
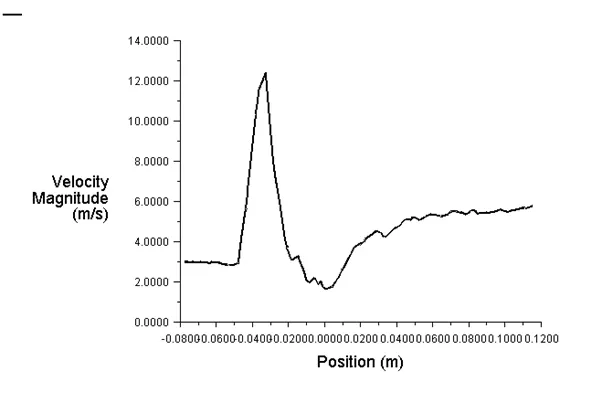
- Following is the velocity plot across the T:
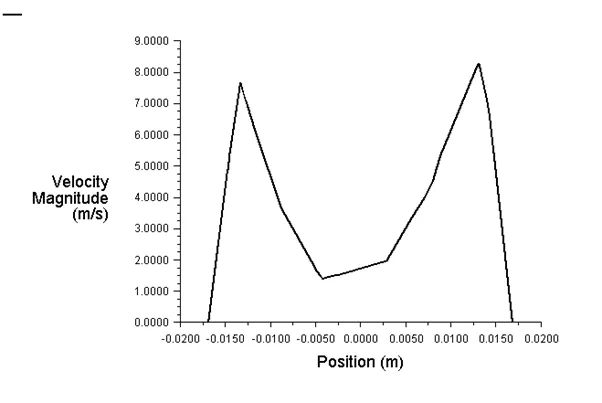
- Average Outlet Temperature:
Post Processing & Conclusion (Long T)
Case 2A: Momentum Ratio=2, K-epsilon Model:
- Following is the Temperature Contour Plot along the T section:
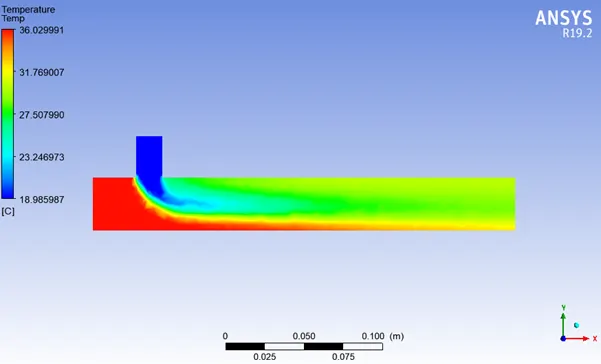
Following is the Temperature Contour Plot across the T section:
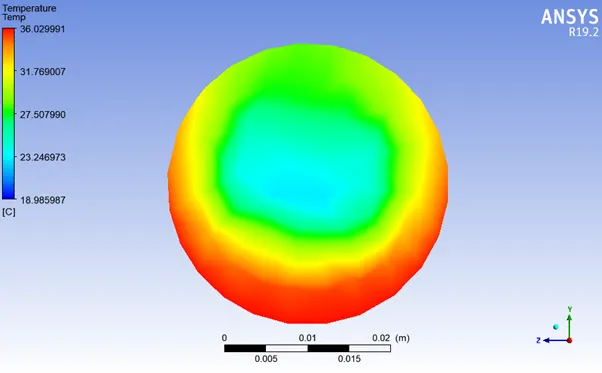
- Following is the velocity Contour Plot along the T section:
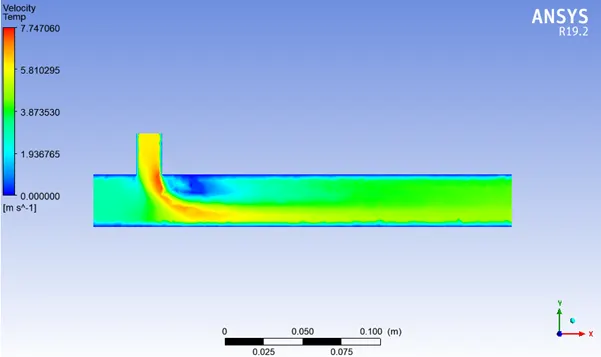
- Following is the velocity Contour Plot across the T section:
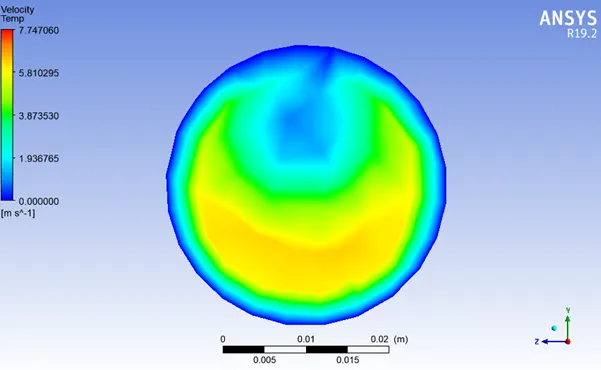
- Following is the Temperature Line Plot along the T section:
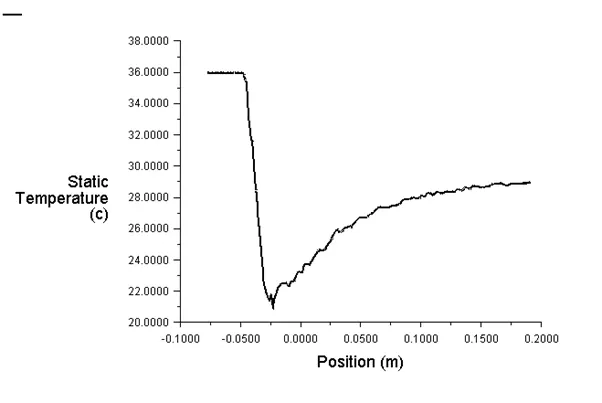
- Following is the temperature plot across the T:
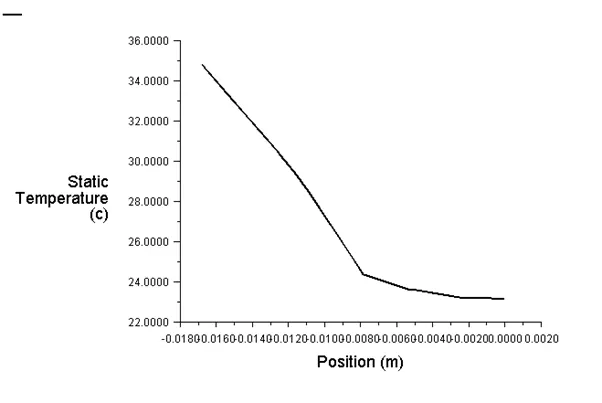
- Following is the velocity plot along the T:
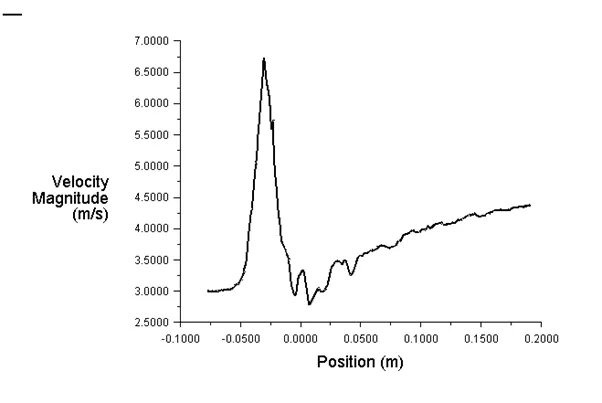
- Following is the velocity plot across the T:
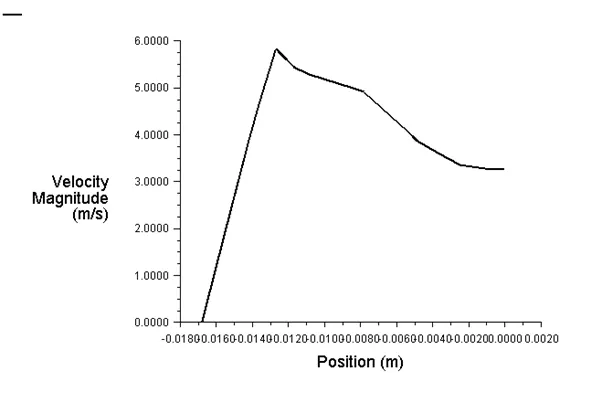
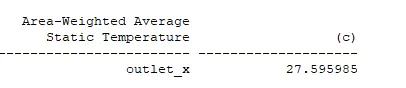
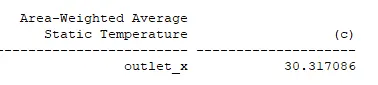
- Average Outlet Temperature:
Case 2B: Momentum Ratio=4, K-epsilon Model:
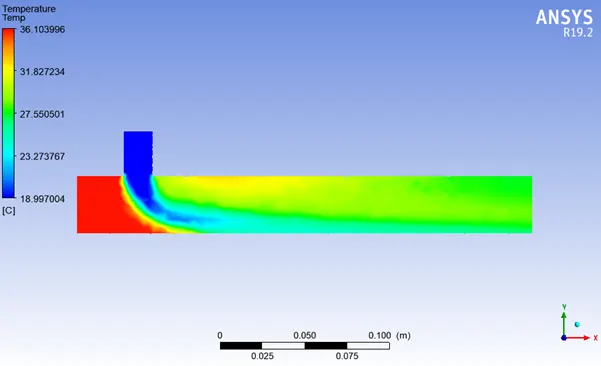
Following is the Temperature Contour Plot along the T section:
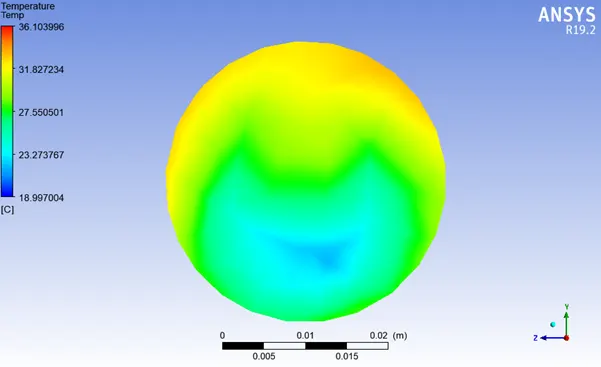
Following is the Temperature Contour Plot across the T section:
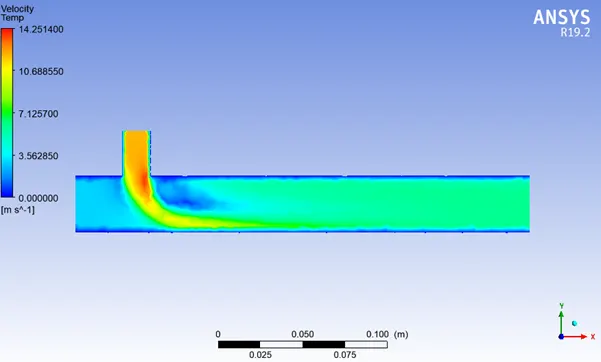
- Following is the velocity Contour Plot along the T section:
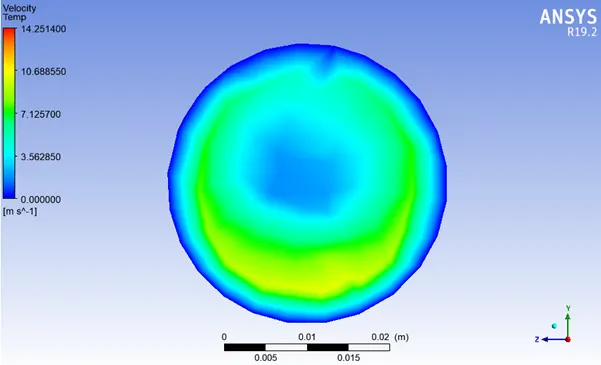
- Following is the velocity Contour Plot across the T section:
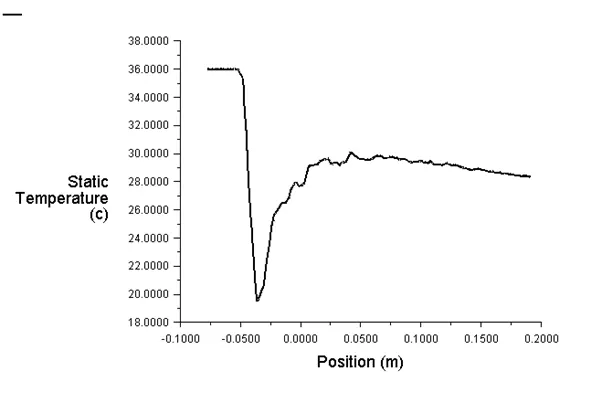
Following is the Temperature Line Plot along the T section:
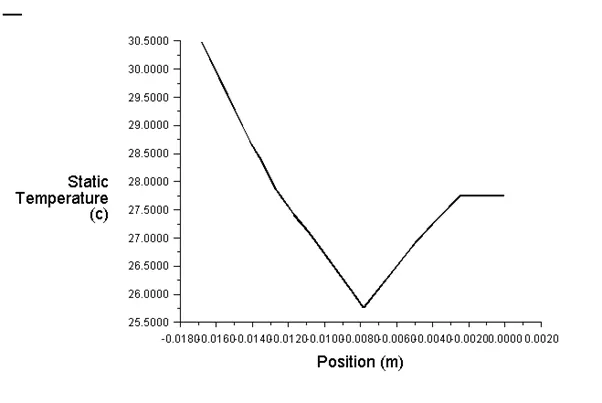
Following is the temperature plot across the T:
Following is the velocity plot along the T:
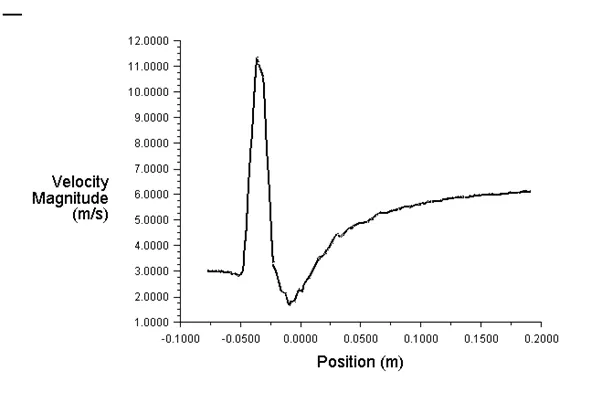
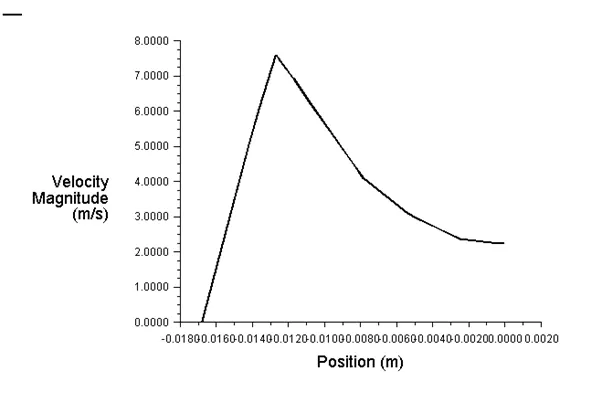
Following is the velocity plot across the T:
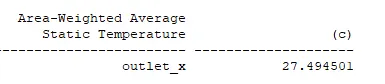
- Average Outlet Temperature:
The Comparative Analysis Between Short & Long T are tabulated as follows:
| TEMPERATURE AT THE OUTLET SECTION | |||||||
| MODEL TYPE | MOMENTUM FACTOR = 2 | MOMENTUM FACTOR = 4 | NO. OF ITERATION FOR CONVERGENCE | TOTAL NODES | TOTAL ELEMENT (TETRAHEDRON) | ||
| SHORT T | K-EPSILON | 30.22 | 27.54 | 100 | 3152 | 14322 | |
| K-OMEGA | 30.23 | 27.59 | 120 | ||||
| LONG T | K-EPSILON | 30.31 | 27.49 | 130 | 3947 | 17876 | |
| THEORETICAL OUTLET TEMPERATURE C | 30.33 | 27.45 | |||||
- As the length increases the no. of iteration required to convergence the solution increases, and total no. of nodes also increased as evident from above analysis too
- On the account of momentum factor, i would like to say that, as the momentum factor increases, the velocity of cold fluid increase by that factor by keeping hot fluid to be constant, therefore as a result, due to high inlet fluid speed (because of more cold fluid momentum (m=4)), proper fluid mixing takes place, the effectivess of heat transfer and mixing between the fluid enhaced as a result the outlet mixing temperaure is getting low as compared to earlier momentum facor which is less (m=2)
Following are the convergence plot of weighted average temperature to the iteration:
Case 1A:
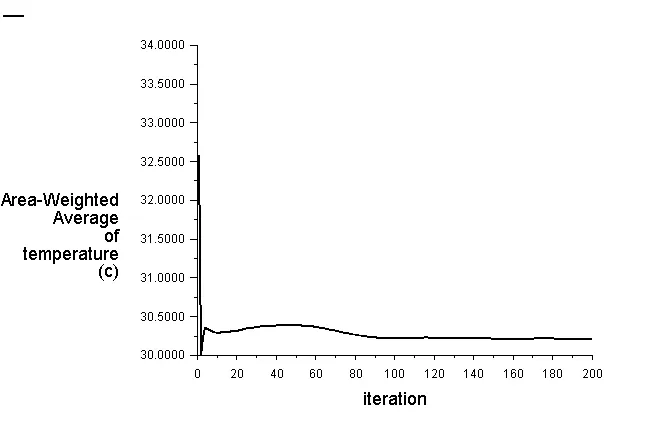
Case 1B:
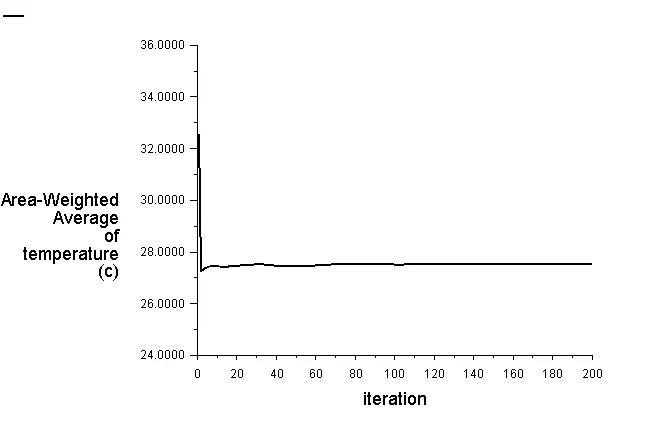
CASE 1C:
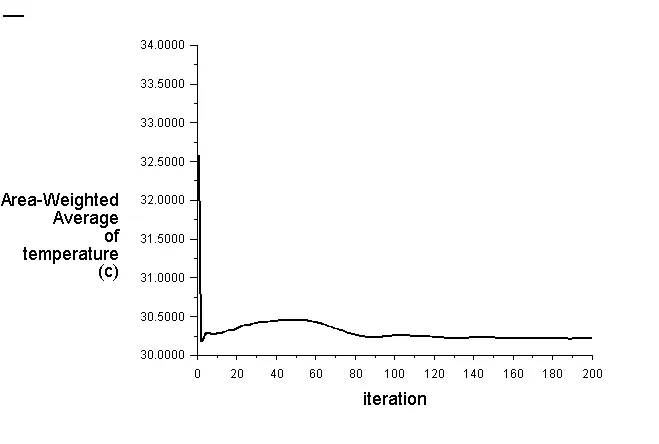
CASE 1D:
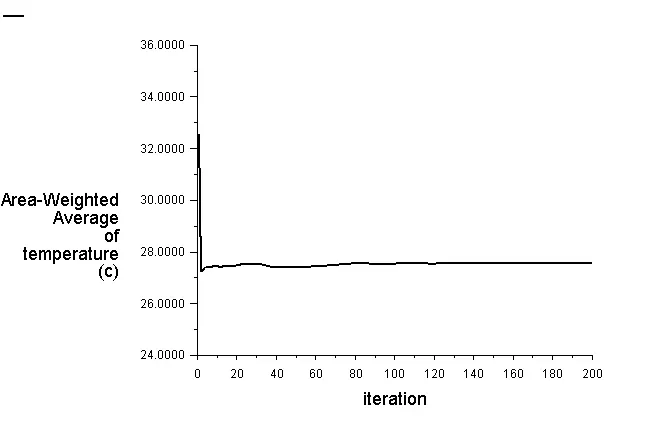
CASE 2A:
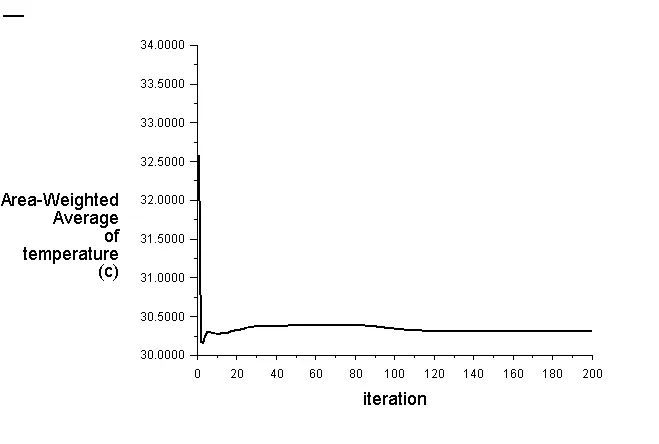
CASE 2B:
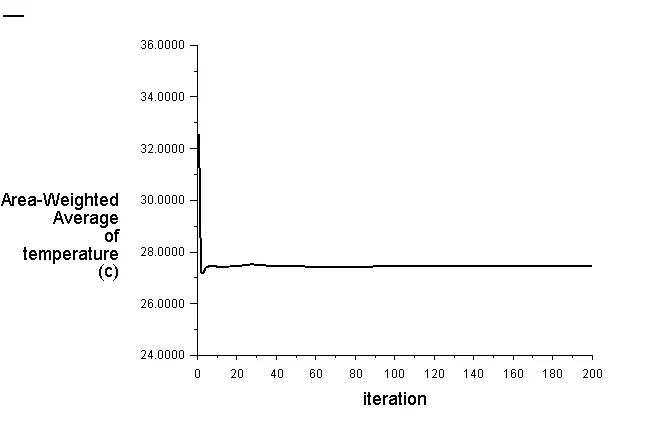
The following are the mesh independent study of Short T model using 5mm, 3mm, and 1mm as mesh element size:
Mesh Independent Study (FOR SHORT T)
(CASE 1A):
- Mesh Information:
- of nodes: 3152
- of elements (tetra): 14322
- Element Size: 5mm
- Average Outlet Temp: 30C
- Of iteration for Convergence: 200
- Following is the temperature distribution diagram:
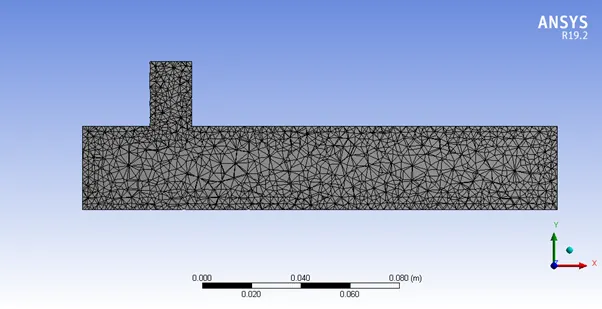
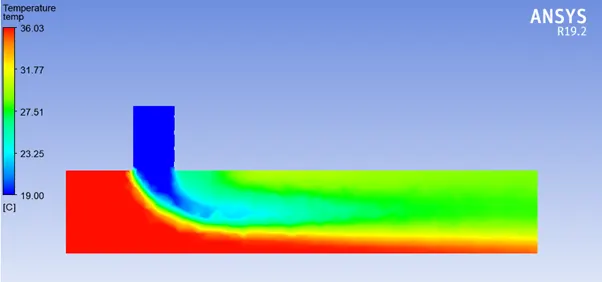
CASE 1B):
- Mesh Information:
- of nodes: 8390
- of elements (tetra): 40065
- Element Size: 3mm
- Average Outlet Temp: 30C
- Of iteration for Convergence: 200
- Following is the mesh & temperature distribution diagram:
(CASE 1C):
- Mesh Information:
- of nodes: 111008
- of elements (tetra): 579227
- Element Size: 1mm
- Average Outlet Temp: 30C
- Of iteration for Convergence: 200
- Following is the mesh & temperature distribution diagram:
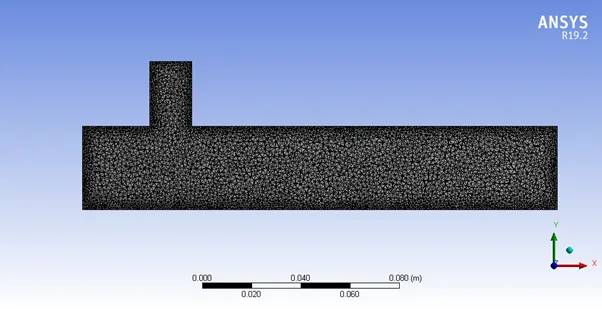
For each above three cases for 5mm, 3mm and 1mm, the average temperature is coming out to be almost same as 28C.
Attached Files Nomenclature:
SHORT T1A=K-EPSILON/M=2
SHORT T1B=K-EPSILON/M=4
SHORT T1C=K-OMEGA/M=2
SHORT T1D=K-OMEGA/M=4
LONG T2A=K-EPSILON/M=2
LONG T2B=K-OMEGA/M=4