Week 1- Mixing Tee
AIM - we have created two versions of the mixing tee. One of them is longer than the other.our job is to set up steady-state simulations to compare the mixing effectiveness when hot inlet temperature is 360C & the Cold inlet is at 190C Use the k-epsilon and k-omega-SST model for the first case and based on your judgment use the more suitable model for further cases. Giving the reason for choosing a suitable model is compulsory.
(Momentum ratio = velocity at cold inlet / velocity at hot inlet)
- Case 1
- Short mixing tee with a hot inlet velocity of 3m/s.
- Momentum ratio of 2, 4.
- Case 2
- Long mixing tee with a hot inlet velocity of 3m/s.
- Momentum ratio of 2, 4.
Objective-
- Velocity and temperature contour plots on the cut planes along and across the pipe.
- Velocity and temperature line plots along and across the length of the pipe.
- Perform Mesh independent study for any one case.
- Discuss the effect of length and momentum ratio on results.
For each simulation, you need to show the convergence plot
Procedure-
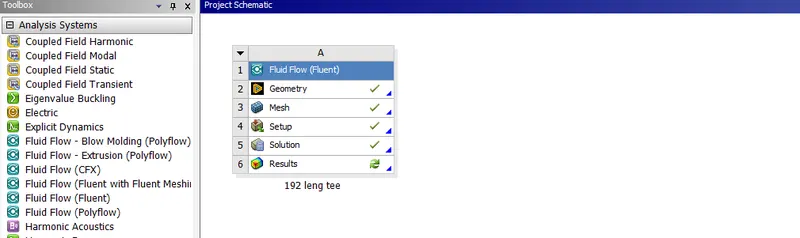
1)open work bench from the left deck click on ansys fluent a bok will appear on main window
2) open space claim and load short tee model
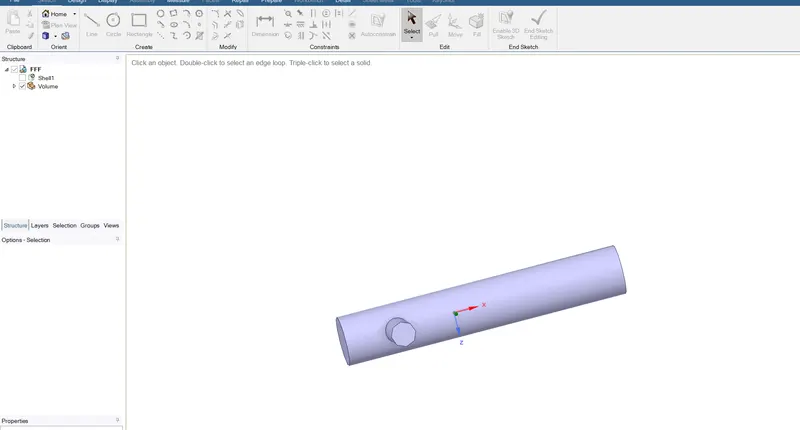
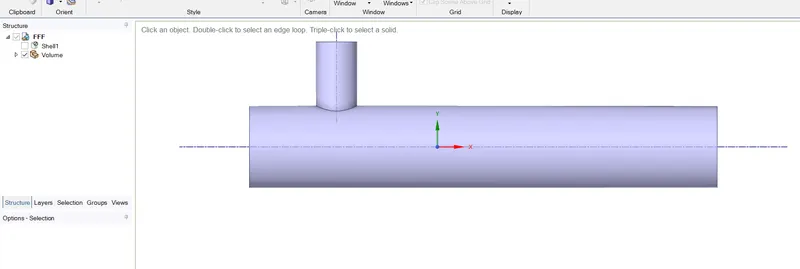
3) after loading model we will extract fluid volume as we don't want to calculate anyting for outer surf
4) select volume extract from top bar select faces using face selection than click on volume extract it will extract volume and now supress outer shell for physics
5) save and close and open the mesh module
6)now on left hand menu select meshing quality crireria change eleme nt size acq to need i am using 2mm than click on generate mesh the volume will be meshed
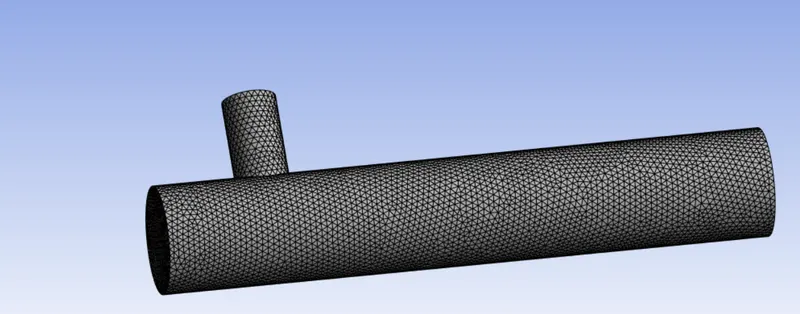
7)use short cut N key to name the faces and name them inlet x , y nad outlet
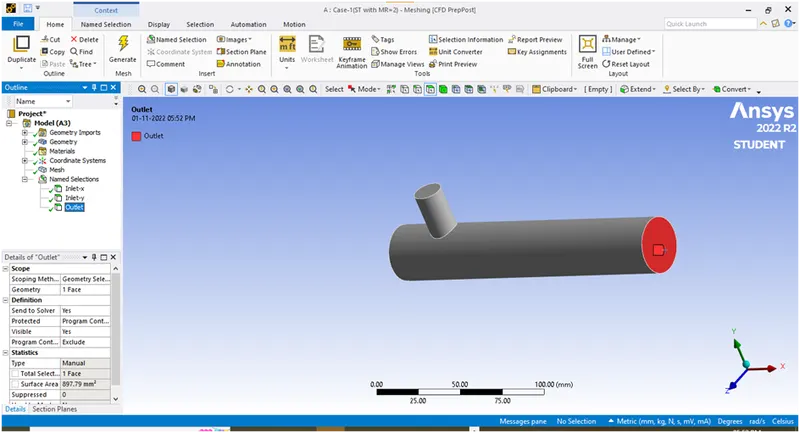
8) close the mesh deck and move to setup deck a pop up will appear use default settiing or double float will give more accurate results
9)go to top menu in physics option tick on energy equation as we want to find the temp at outlet
10) on the same deck click on viscious model and select k epsiolan model change the srtting as req i am using default
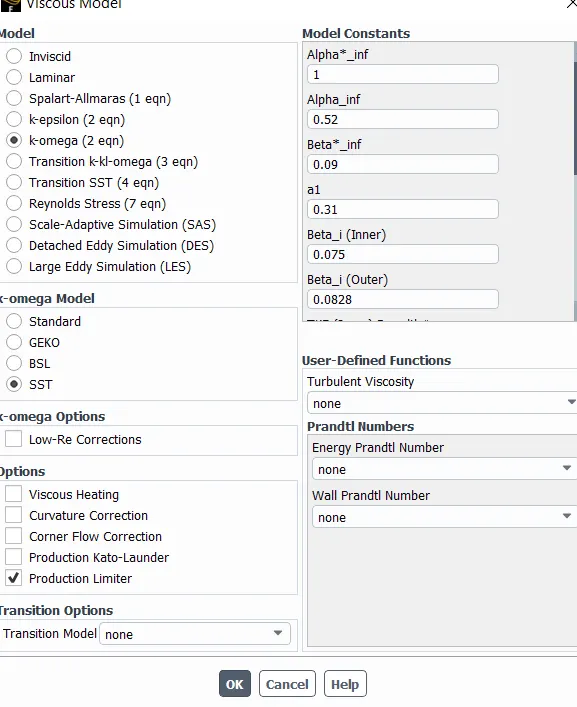
8) now click on material and use the default fluid as air u can also use other fluid from fluid database
9)now go to boundary select inlet give vel and temp vallue do the same for inlet y
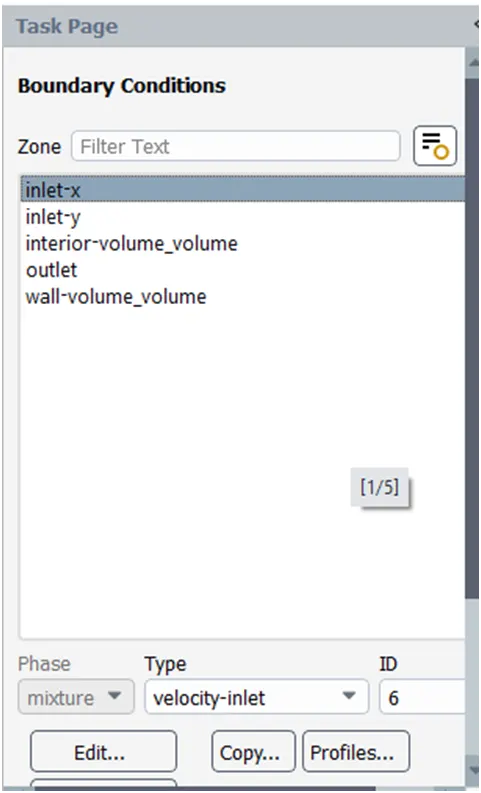
10) now go to solutions tab click on report option and click on new select the value u want to obtain a plot for similarly create diff reports as required
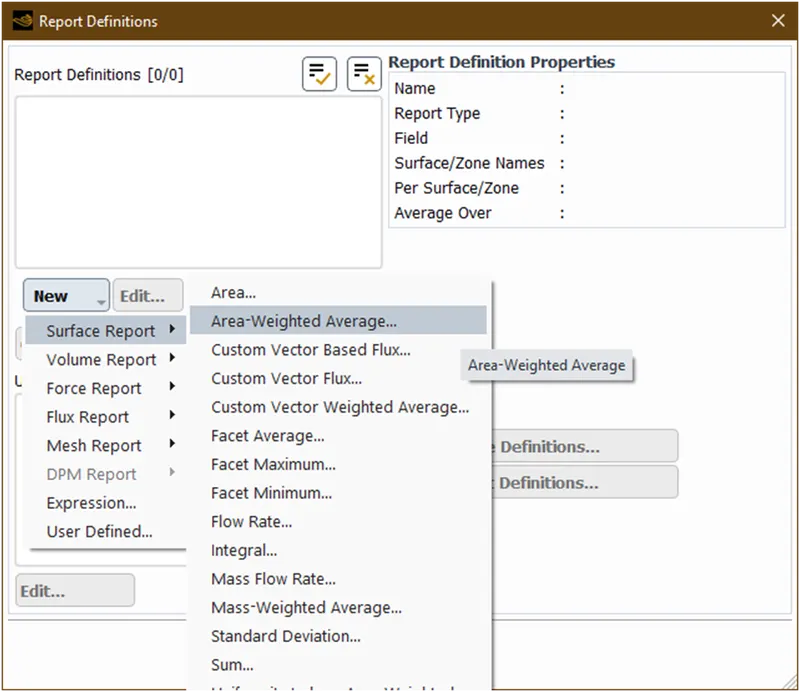
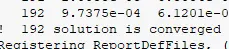
11) now we go to hybrid initialixation as it will automatically take some value assumption for 10 iterations now change no. of iterations and click on calculate we will have all the plots as defines till the sol converges aftwer 192 iteration sol converges
 ]
]
12) to create a plot go to result tab click on contour new and create a contour plane along required axis this can also be done in result module
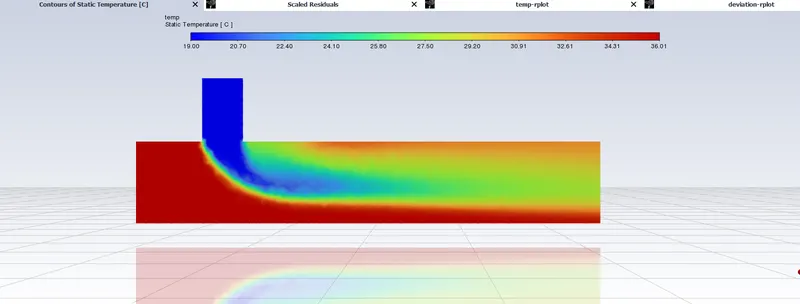
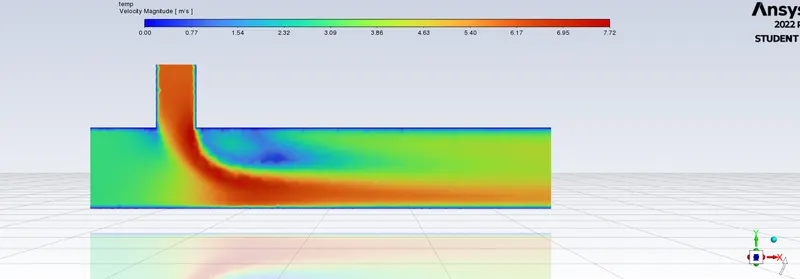
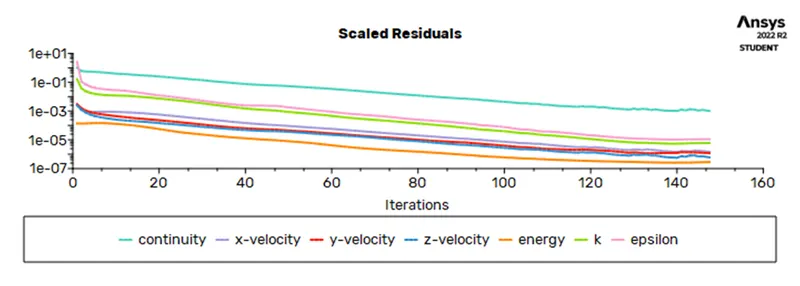
for short tee (momentum ratio 2) we get -
temp contour
vel contour
residual plot-
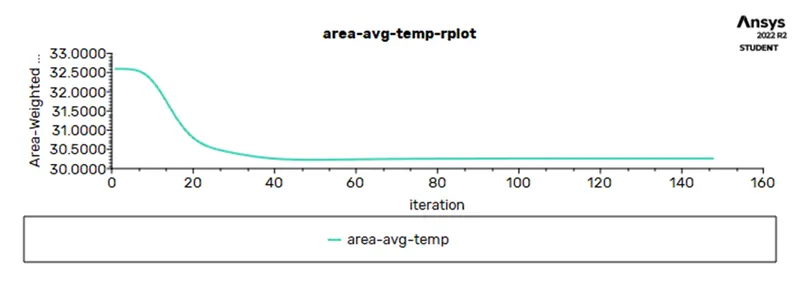
- Area-avg-temp plot
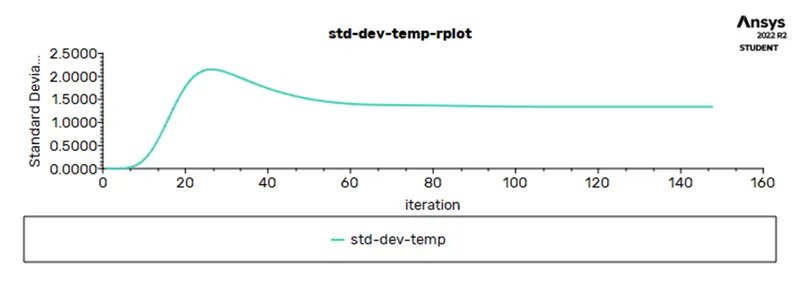
- Standard deviation plot
repeat the process for diff momentum ratio and long tee
results-
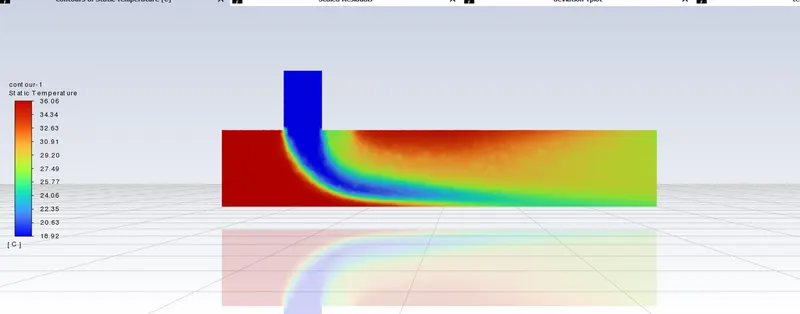
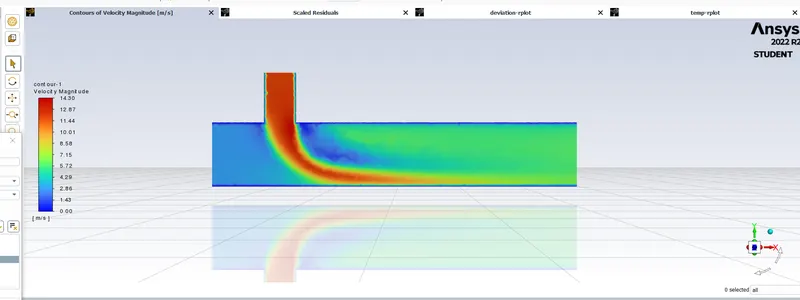
short tee momentum ratio 4-
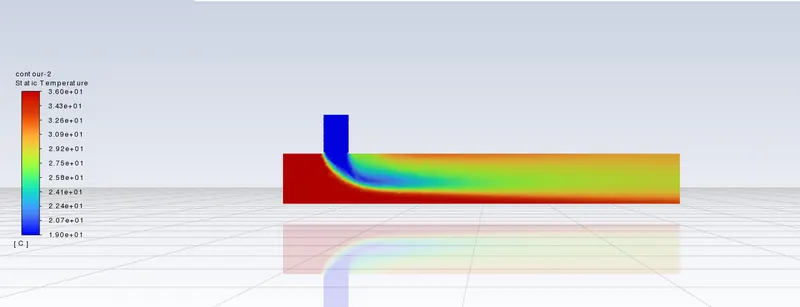
temp contour
vel contour-
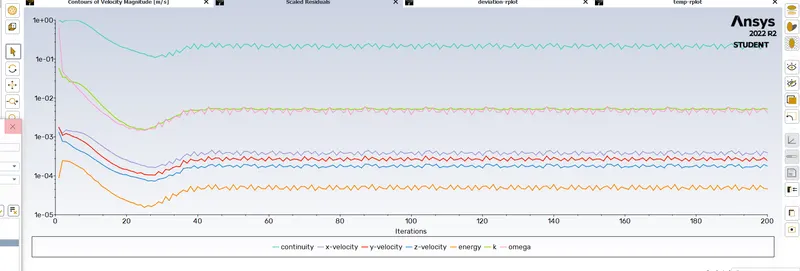
residual plot-
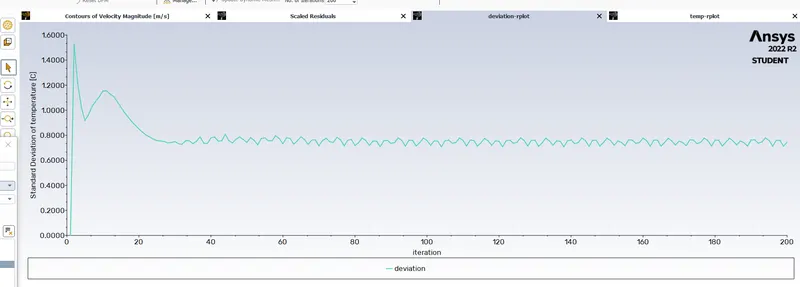
standard deviation plot-
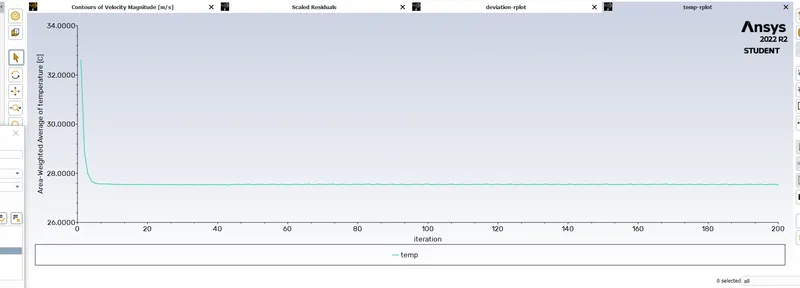
temp plot-
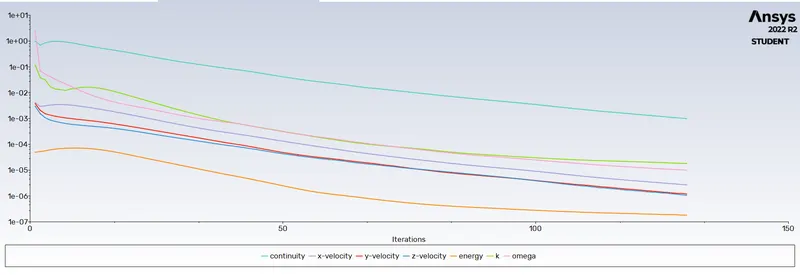
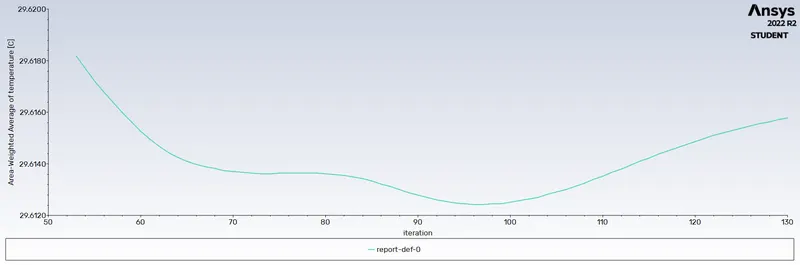
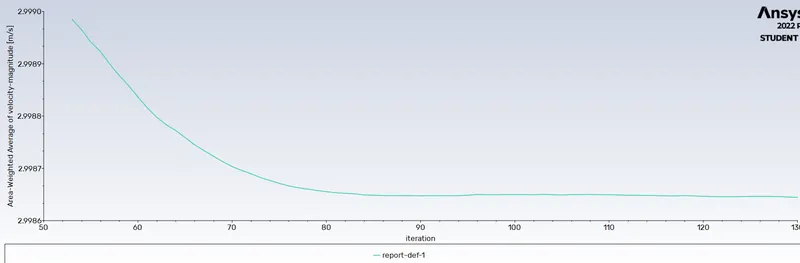
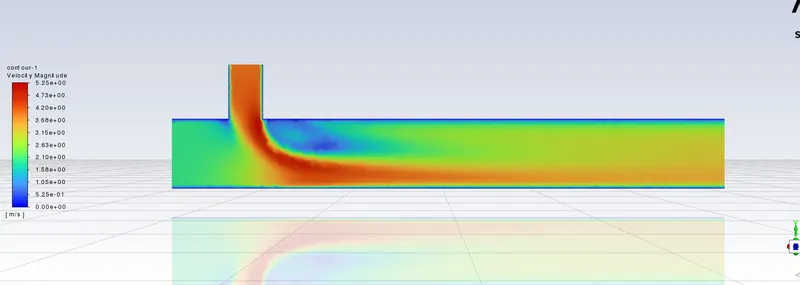
long tee momentum ratio 2 results -
temp contour
resudal plot-
temp plot-
vel plot-
Vel contour-
Long tee momentum ratio 4 results-
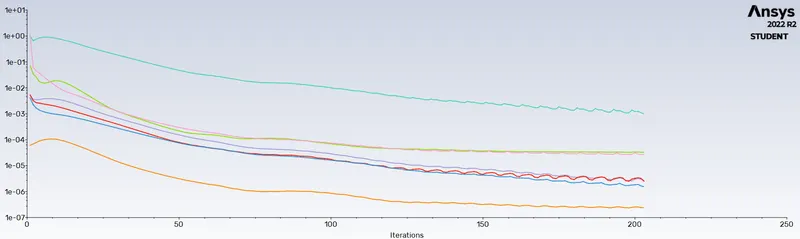
residual plot-
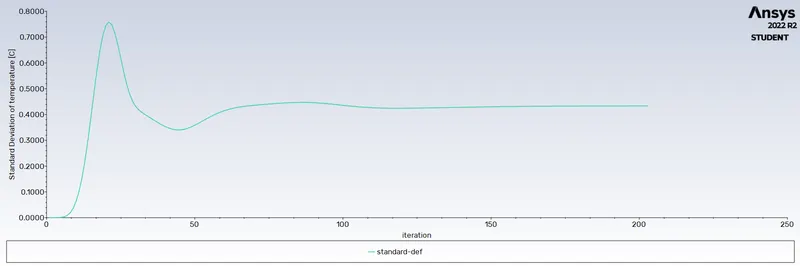
temp deviation-
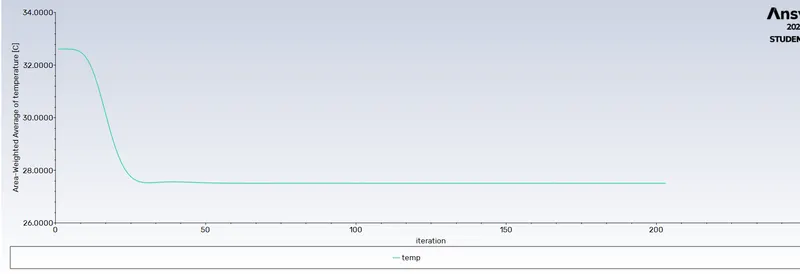
temp-
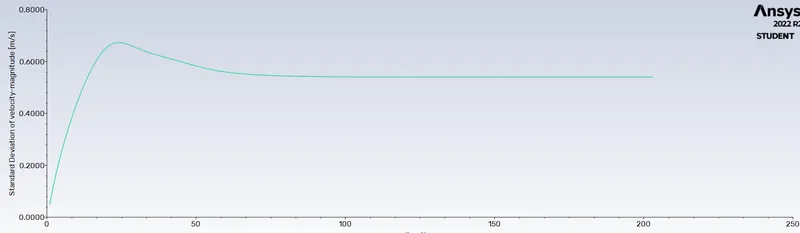
vel plot-
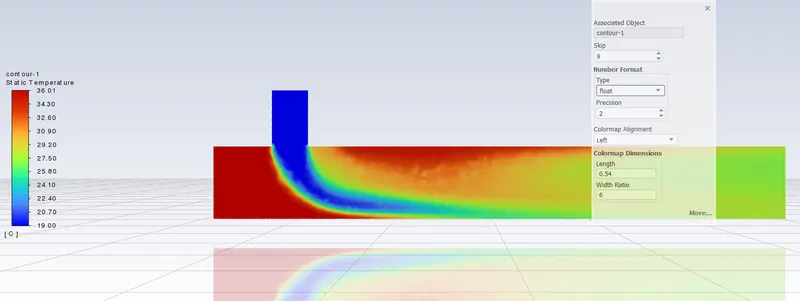
temp contour-
vel contour-
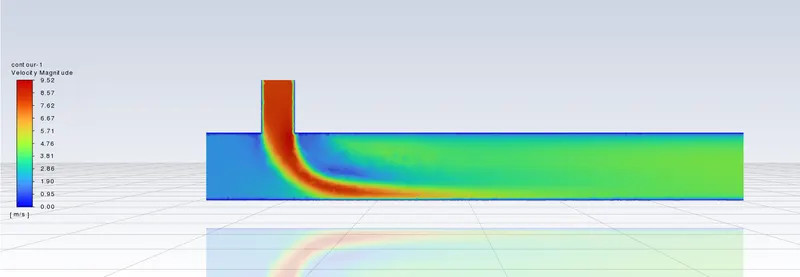
Table-
| name | iteration req | no. of element | no. of element |
| short tee mr 2 | 145 | 110267 | 30 |
| short tee mr 4 | 200 | 110267 | 28 |
| long tee mr 2 | 130 | 151362 | 29.7 |
| long tee mr 4 | 203 | 151362 | 28 |
Result-
All the required plots are plotted