Week 1- Mixing Tee
Aim:
To simulate the air flow through the mixing tee and to set up steady-state simulations to compare the mixing effectiveness when hot inlet temperature is 360C & the Cold inlet is at 190C.
Objective:
In this challenge we have to find four cases.
Case 1 (K-epsilon(Realizable) & K-Omega)
- Short mixing tee with a hot inlet velocity of 3m/s. Temperature of the hot tee =36c and temperature of the cold tee = 19c
- Momentum ratio of 2. (Velocity hot tee = 3m/s, velocity cold tee =6m/s)
Case 2 (K-epsilon(Realizable) & K-Omega)
- Short mixing tee with a hot inlet velocity of 3m/s. Temperature of the hot tee =36c and temperature of the cold tee = 19c
- Momentum ratio of 4. (Velocity hot tee = 3m/s, velocity cold tee =12m/s)
Case 3 (K-epsilon(Realizable) & K-Omega)
- Long mixing tee with a hot inlet velocity of 3m/s. Temperature of the hot tee =36c and temperature of the cold tee = 19c
- Momentum ratio of 2. (Velocity hot tee = 3m/s, velocity cold tee =6m/s)
Case 4 (K-epsilon(Realizable) & K-Omega)
- Long mixing tee with a hot inlet velocity of 3m/s. Temperature of the hot tee =36c and temperature of the cold tee = 19c
- Momentum ratio of 4. (Velocity hot tee = 3m/s, velocity cold tee =12m/s)
Formula:
Momentum ratio = velocity at cold inlet / velocity at hot inlet
Step by step procedure of ANSYS FLUENT:
- Geometry
- Meshing
- Set up
- Solution
- Result
Above the five steps are major procedure in ansys fluent. We have to follow these steps in ANSYS FLUENT. Each and every case we have follow these steps.
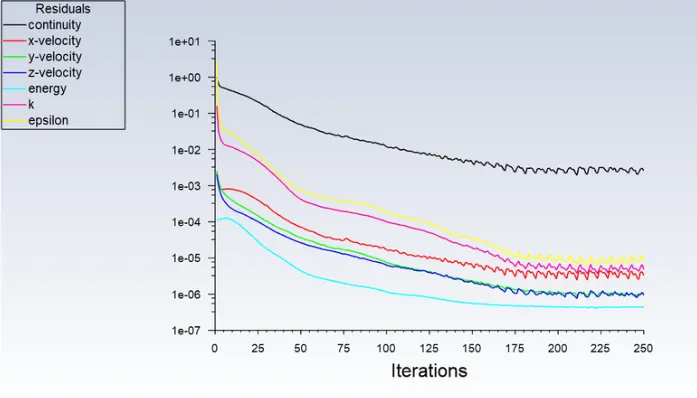
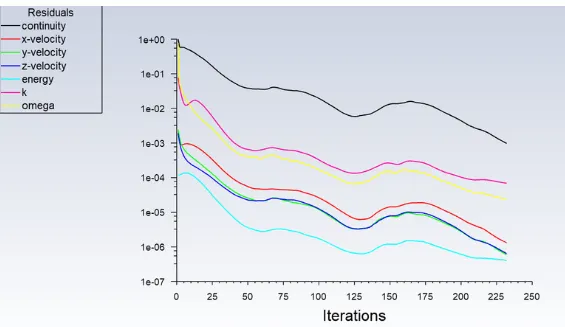
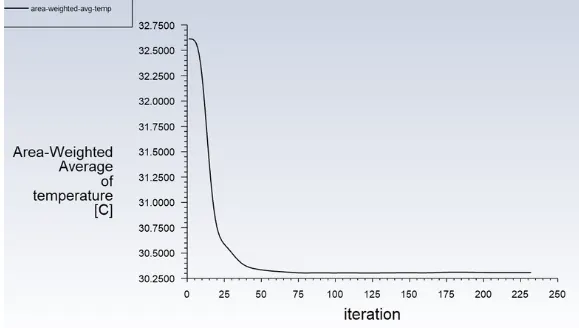
Any type of simulation involves the following three main steps: pre-processor includes meshing mode. Applying boundary conditions, initializing, and convergent are all parts of solving. Post-processing is the final phase, which includes creating graphs, contours, and vectors to analyze the results. To determine the efficacy of mixing tee, we'll use all three phases in this study.
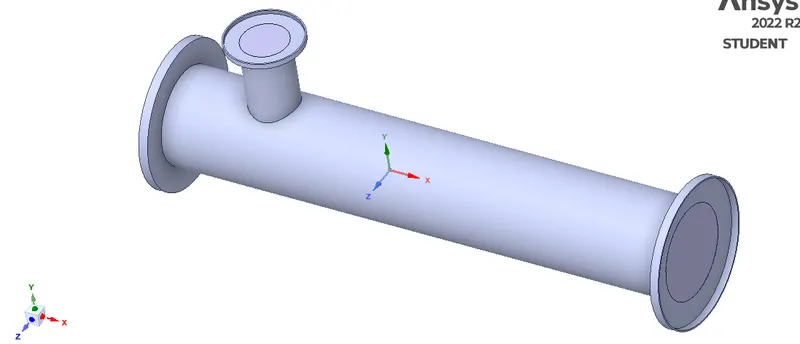
Th 3d model used for this study
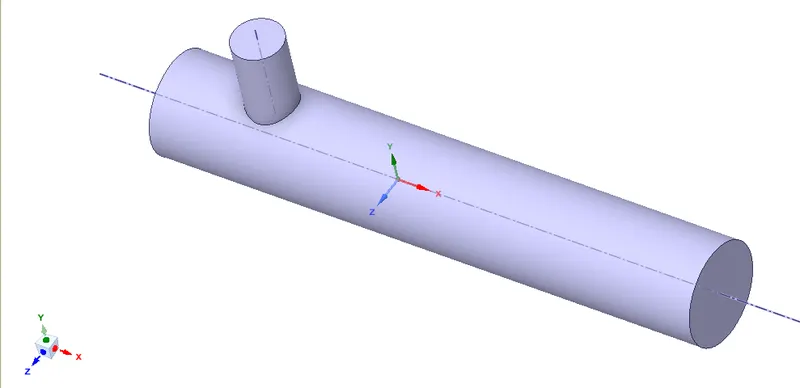
The extracted volume
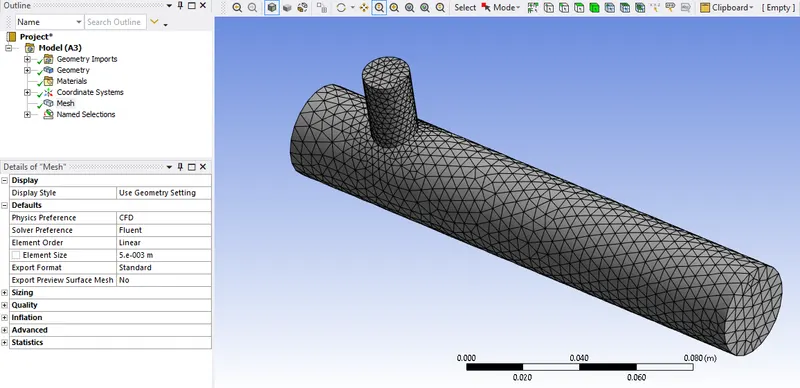
The meshed volume
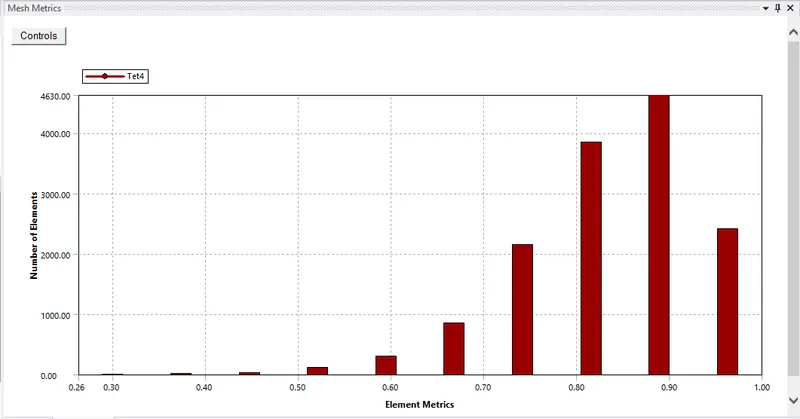
The mesh metrics
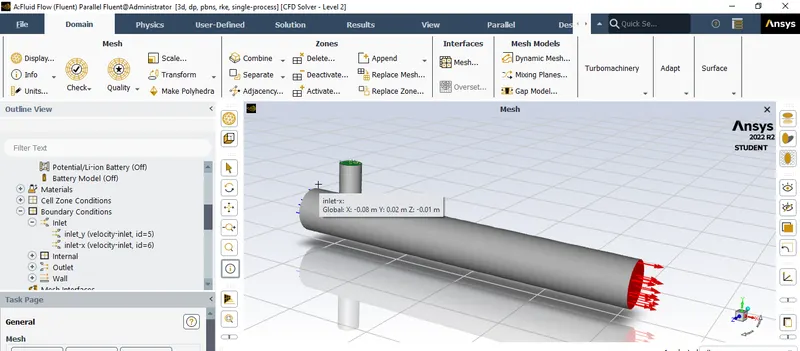
After preparing the model, it is now imported to fluent interface
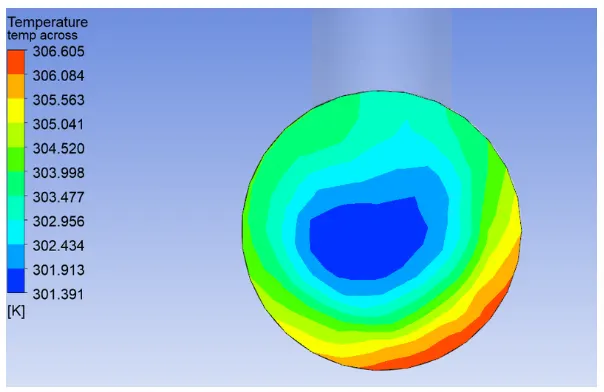
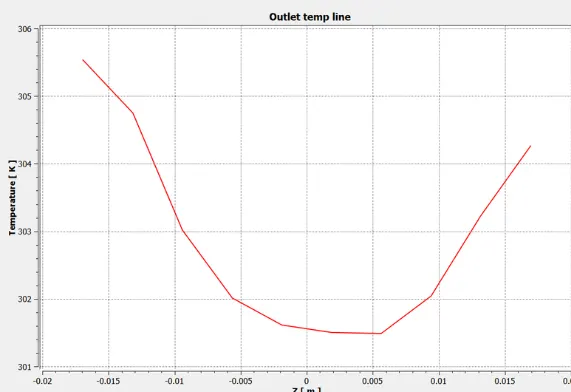
Results
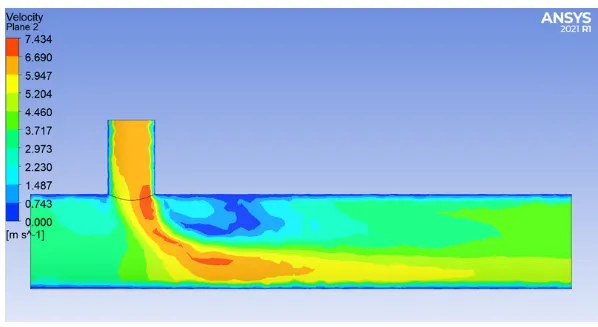
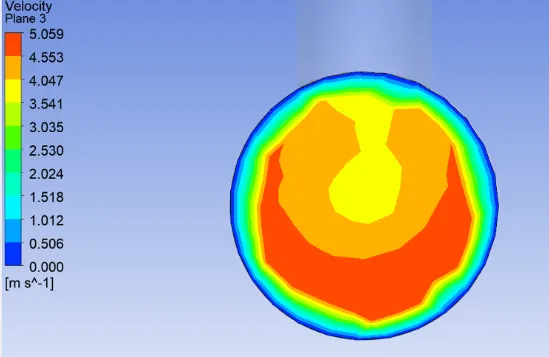
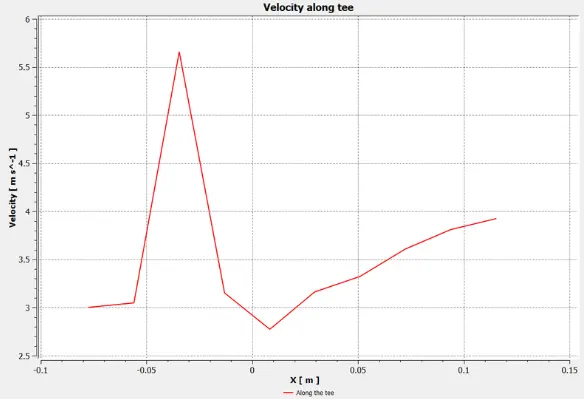
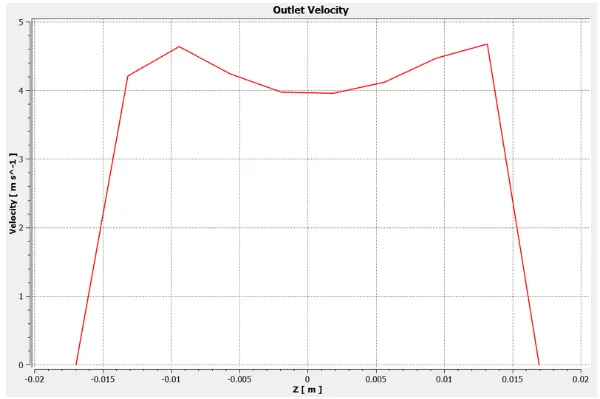
Case1
Case 3
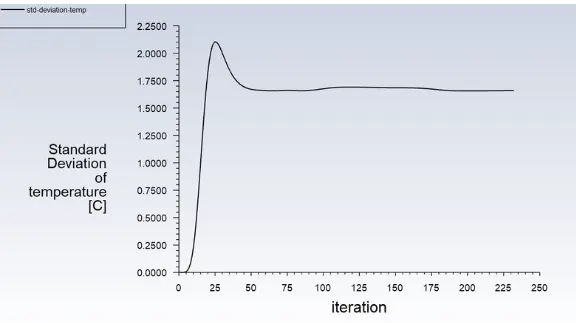
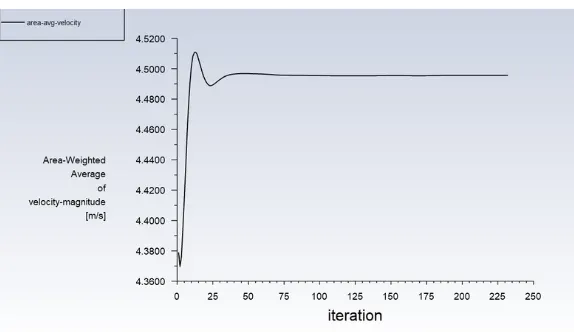
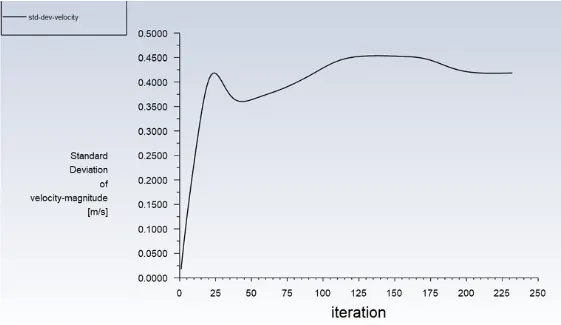
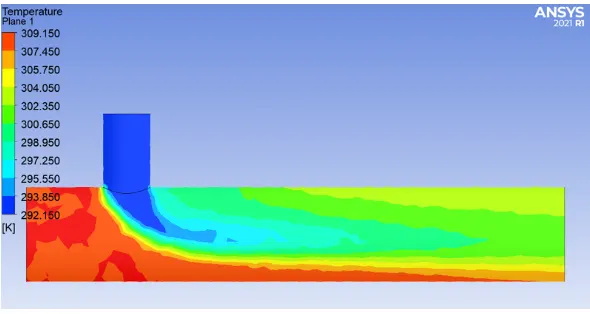
Case 4
Conclusion:
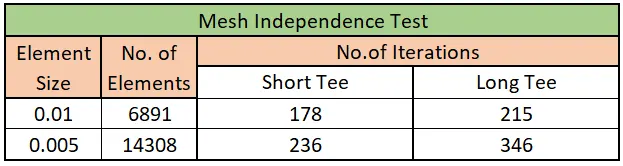
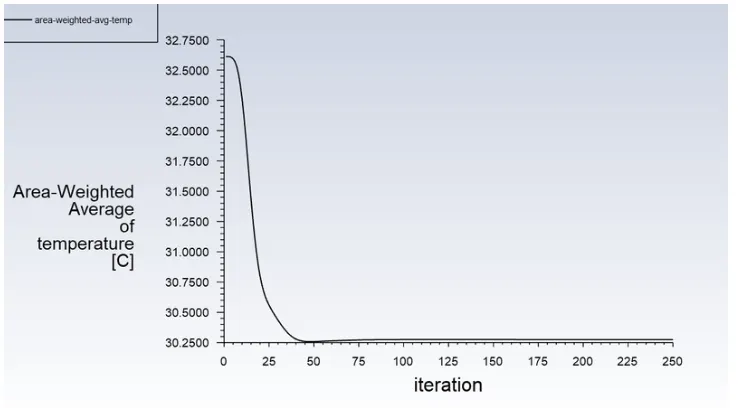
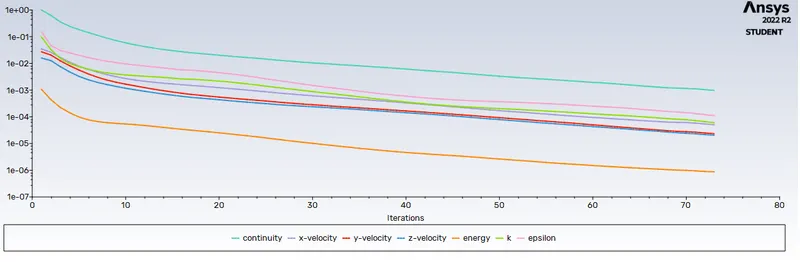
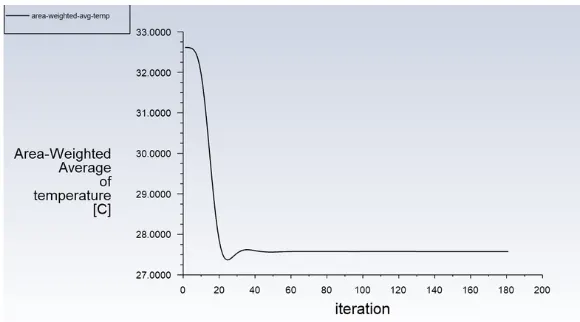
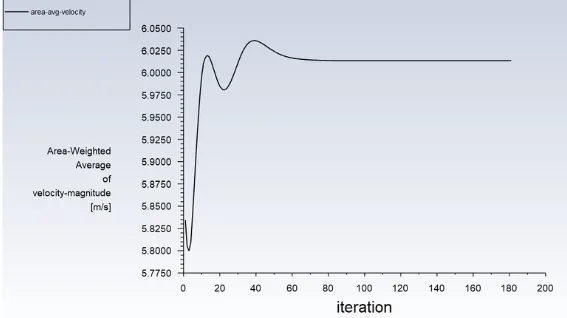
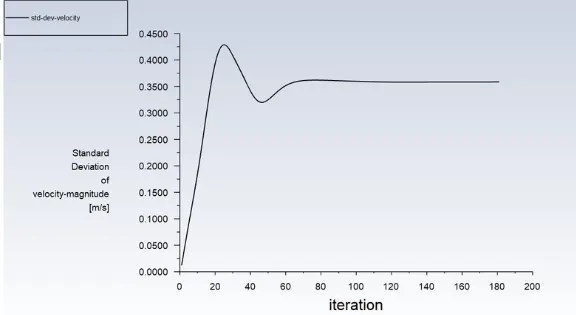
Mesh refining is possible with mesh independent tests without compromising findings. We have evidence from tests that mesh refinement won't have an impact on the outcome. The outcomes of mesh refinement on a short mixing tee are shown in the following graphs; the element size was previously 0.0195 and is now 0.005.
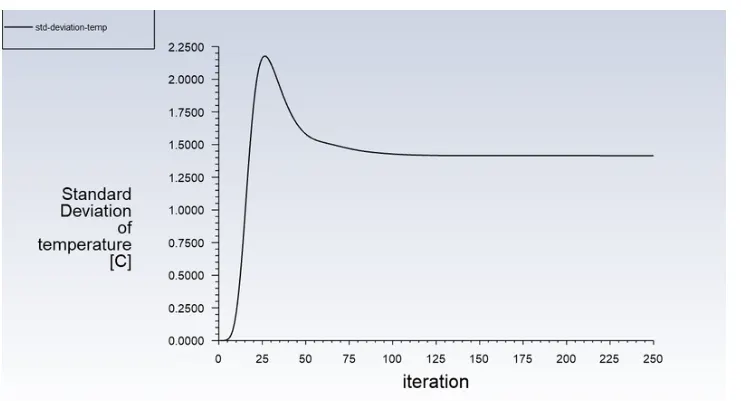
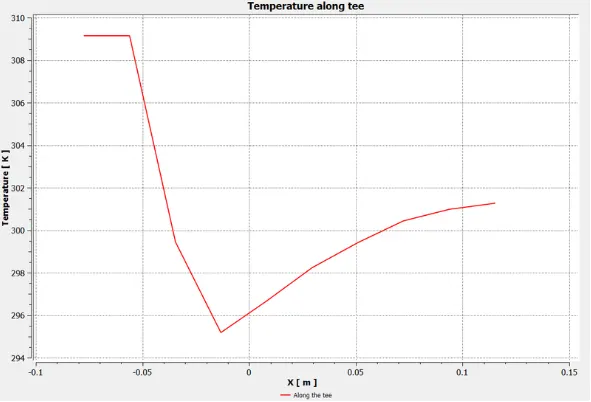
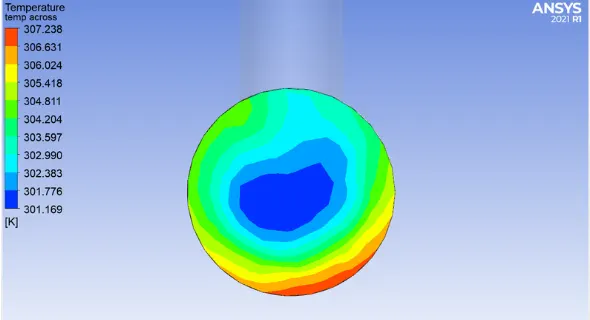
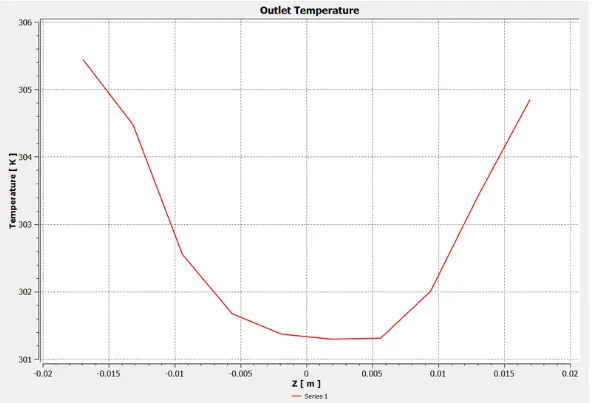
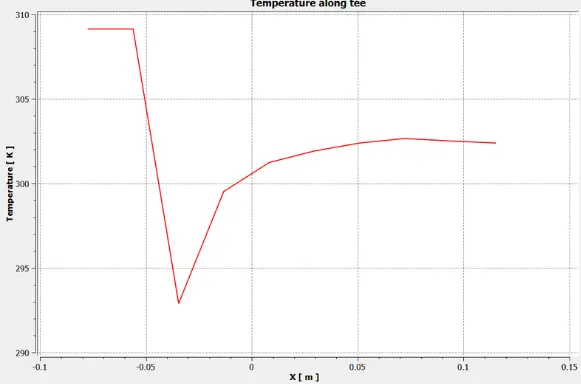
When the mesh length is altered, the standard deviation of output temperature for the K-Epsilon model changes unevenly.
When the mesh size is increased, the standard deviation of the K-Omega model's output temperature drops.
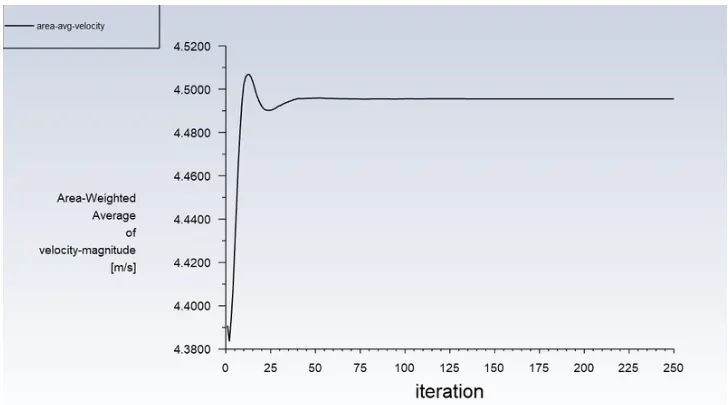
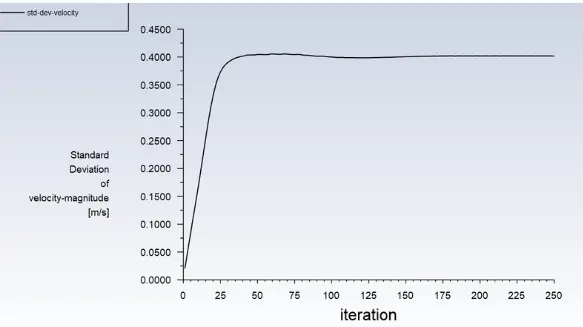
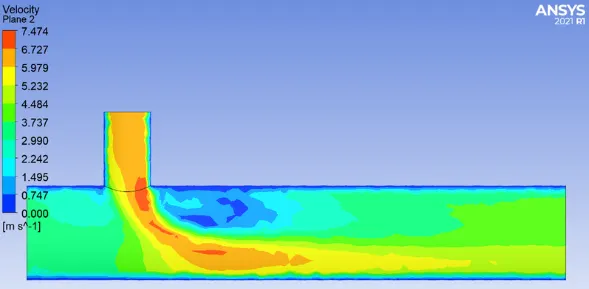
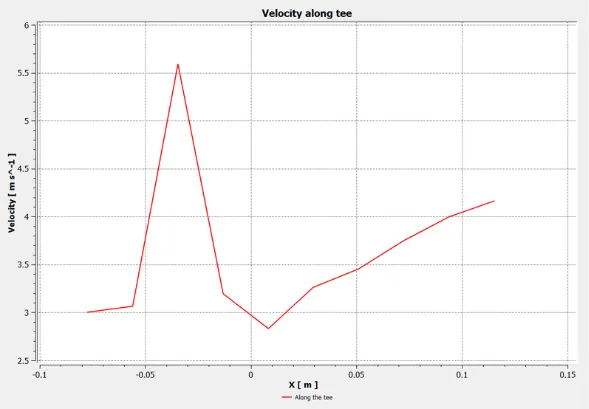
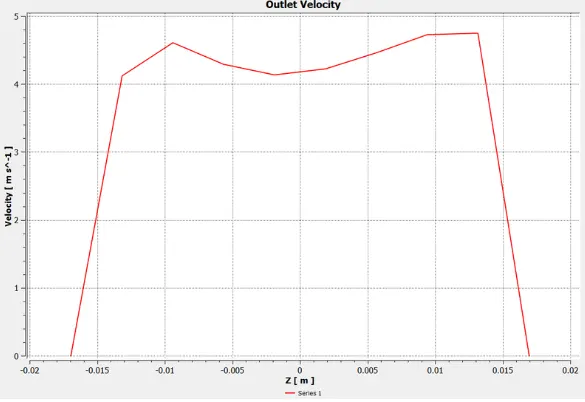
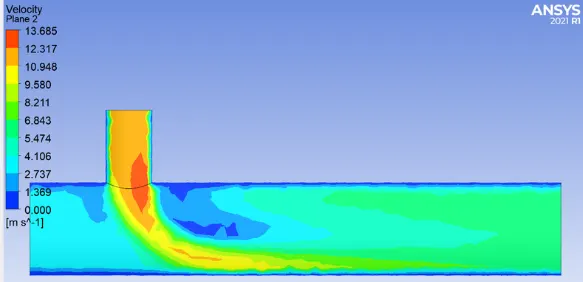
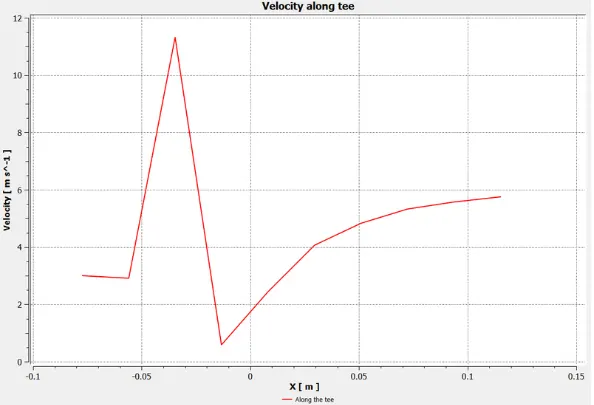
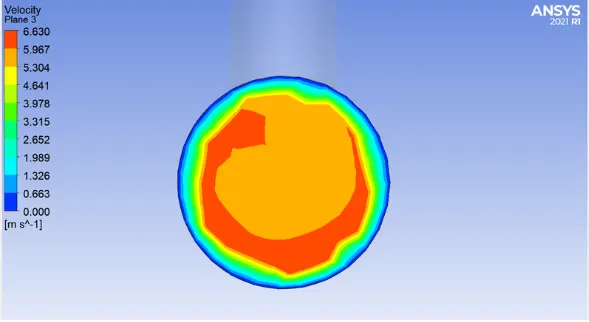
When the mesh size is increased, the standard deviation of the outflow velocity for the K-Epsilon and K-Omega models drops.
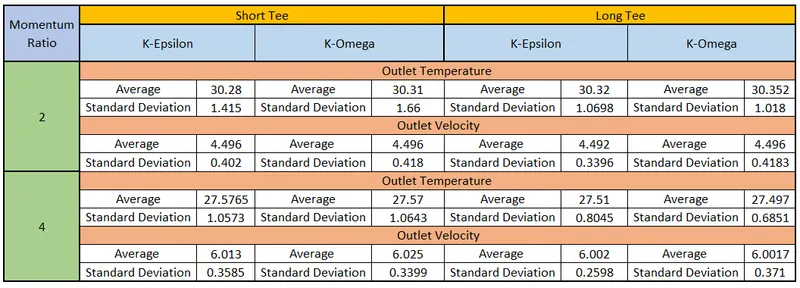
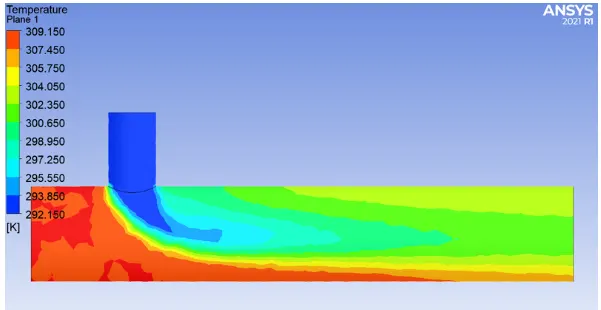
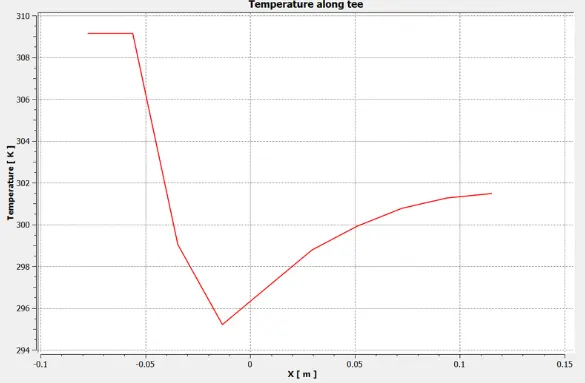
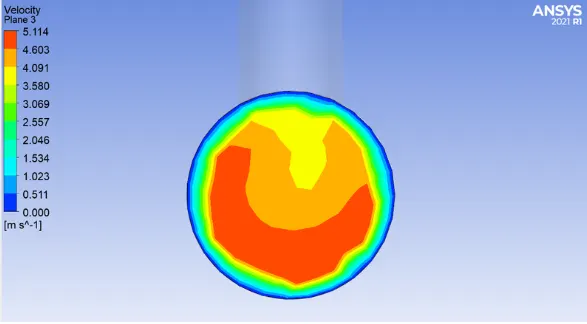
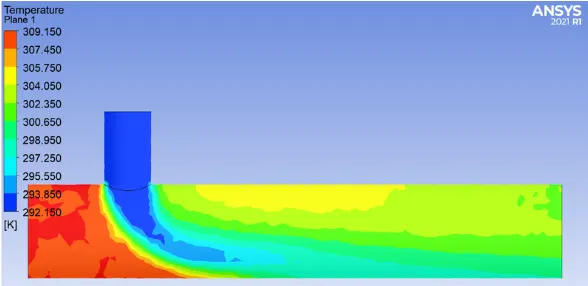
The standard deviation of temperature and velocity at outlet decreases with increasing length and momentum ratio of the tee. As the length and momentum ratio of the tee increase, cold and hot air are mixed uniformly. The outlet of the tee is connected to the room. The longer the tee and the greater its momentum ratio, the more uniform cooling and comfort in the room will be achieved.
While K-omega also forecasts flow in the fluid stream and close to the boundaries, K-epsilon does so for the fluid stream itself.The simulation time grew as the number of elements increased.
Higher inlet velocity is highly effective for better mixing of the flow, and as length increases, we don't notice a huge influence, but with high velocity and extended length, we see improved mixing because of diffusion.