Project 1 - Parsing NASA thermodynamic data
Objectives
1. Write a function that extracts the 14 co-efficients and calculates the enthalpy, entropy and specific heats for all the species in the data file.
2. Calculate the molecular weight of each species
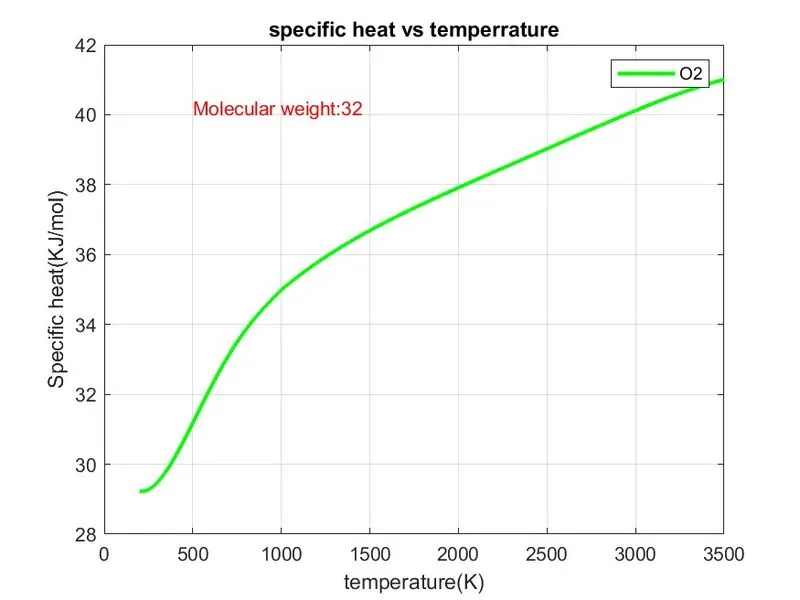
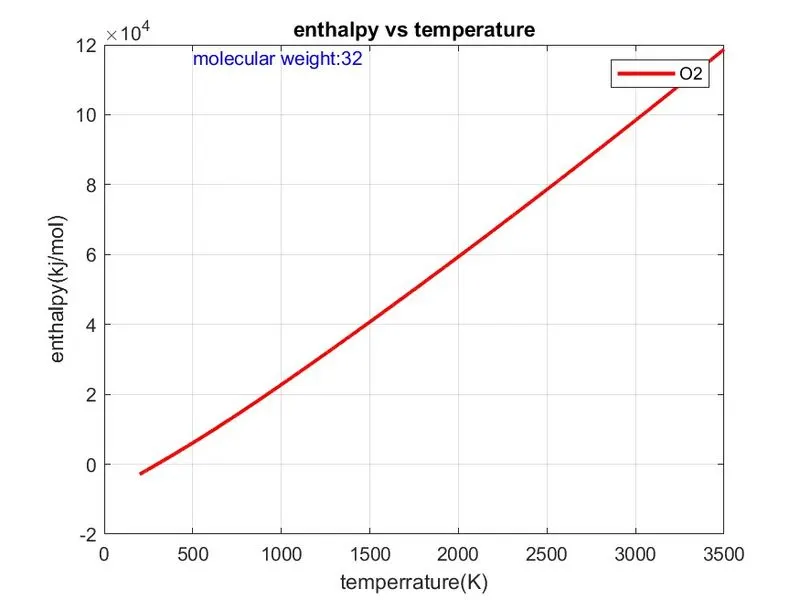
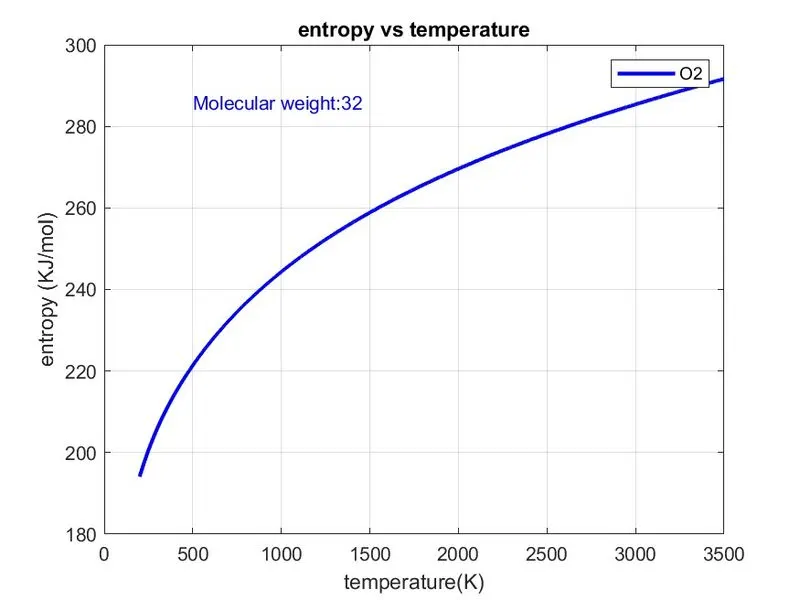
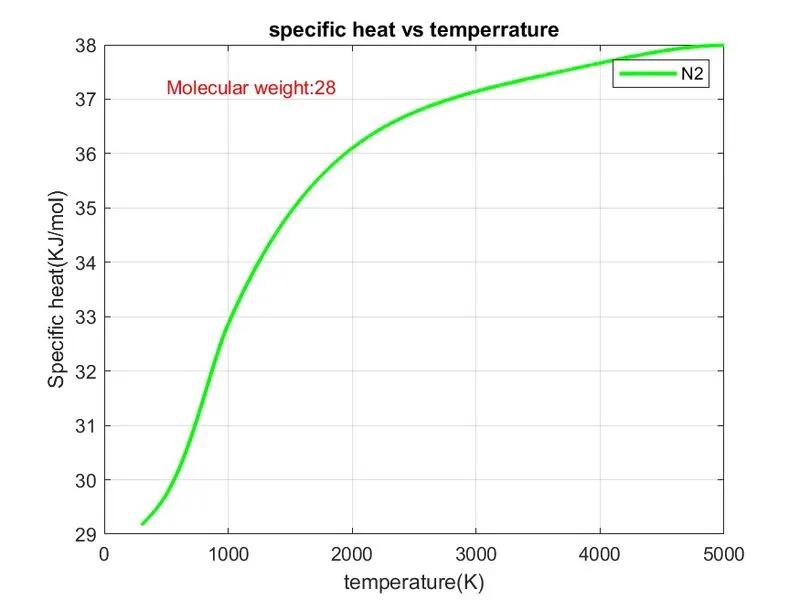
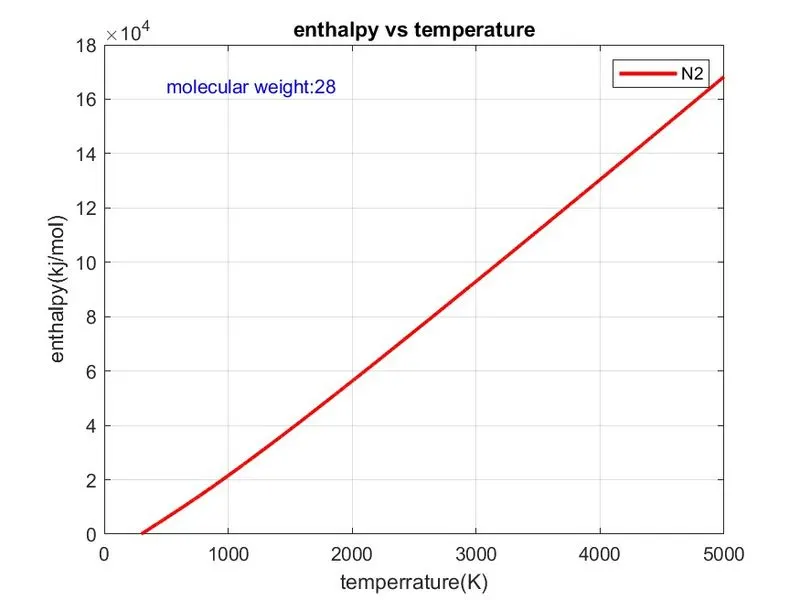
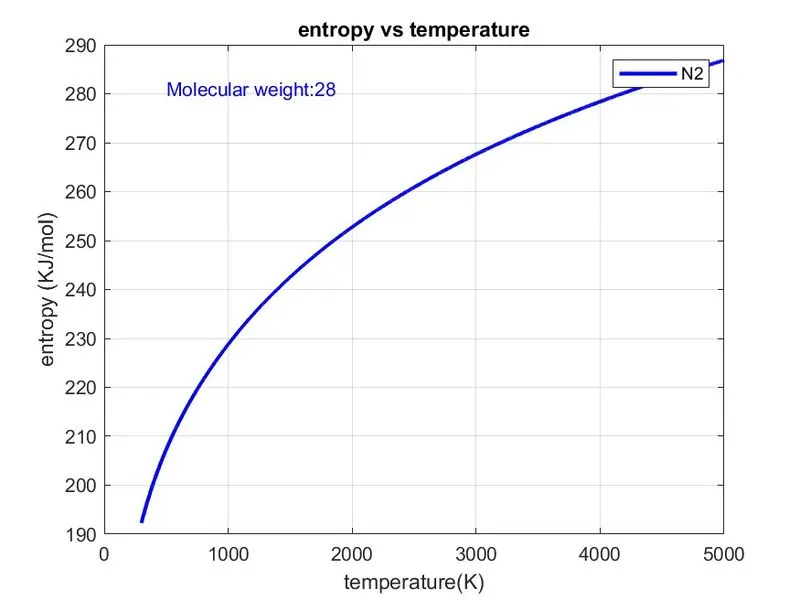
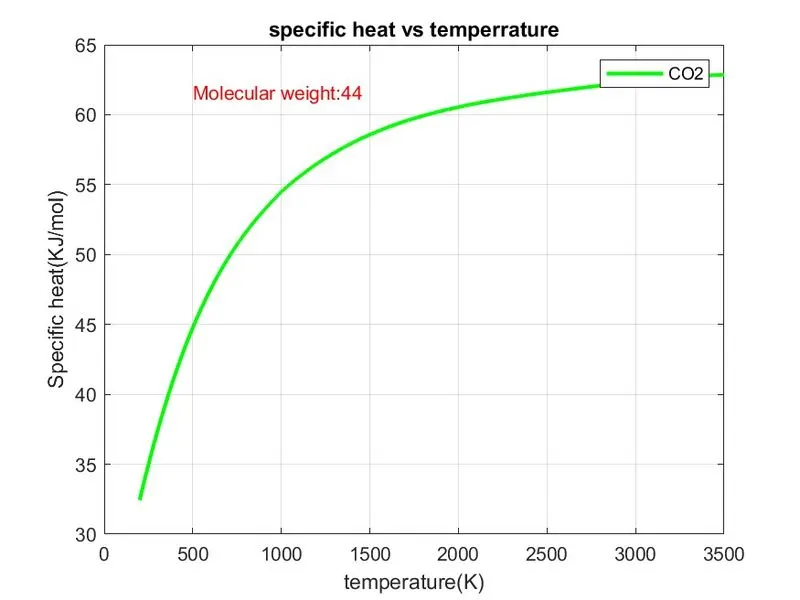
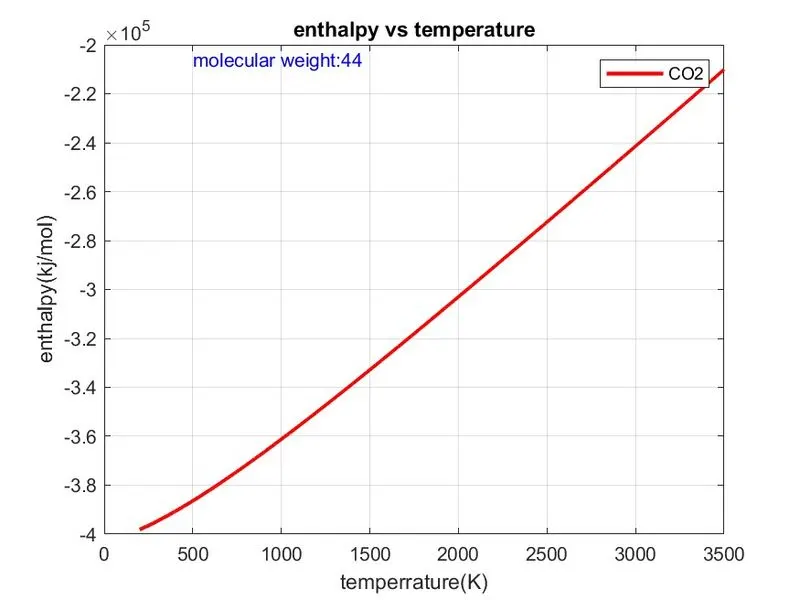
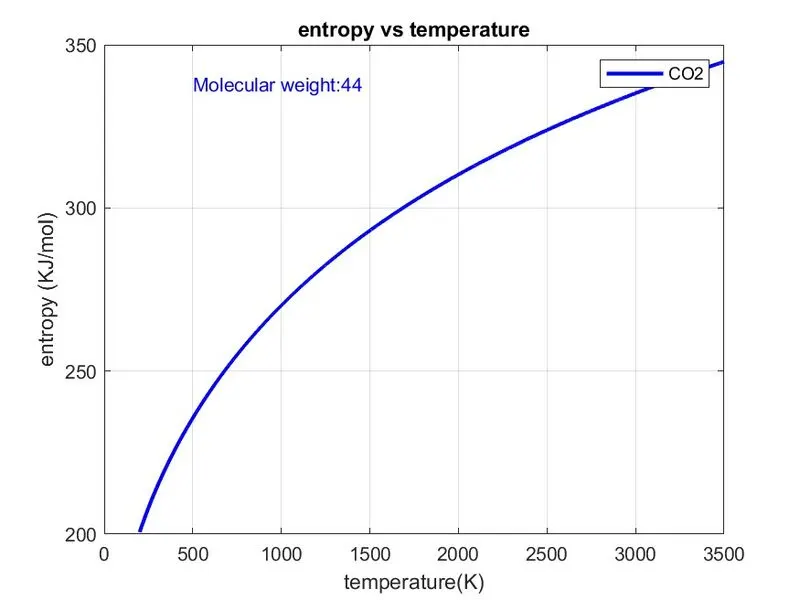
3. Plot the Cp, Enthalpy and Entropy for the local temperature range (low temperature : high temperature) specific for each species.
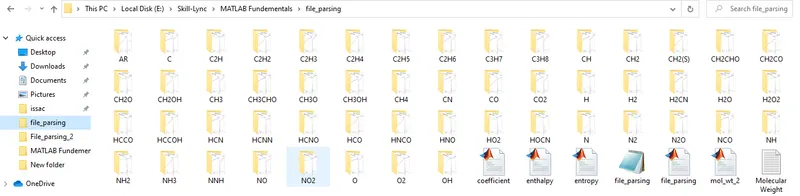
4. Save the plots as images with appropriate names and dump them in separate folders for each species with suitable name.
5. The main program that you will submit will just take the "THERMO.dat" file as an input and generate Cp, H and S plots.
Equations to calculate Specific heat Cp, Enthalpy H and Entropy S.
Fopen is used to open a file and parse the file.
To traverse through the file, use the (fgetl) command to get the file's line number and read it line by line until you reach the required result.
Reading the header file's text and reading the file line by line
After using the string split command, a cell array is created. A cell array is a form of data structure that stores data of various types and complete the work at hand
The Cp, H, and S functions were written to compute them using values from the file data.
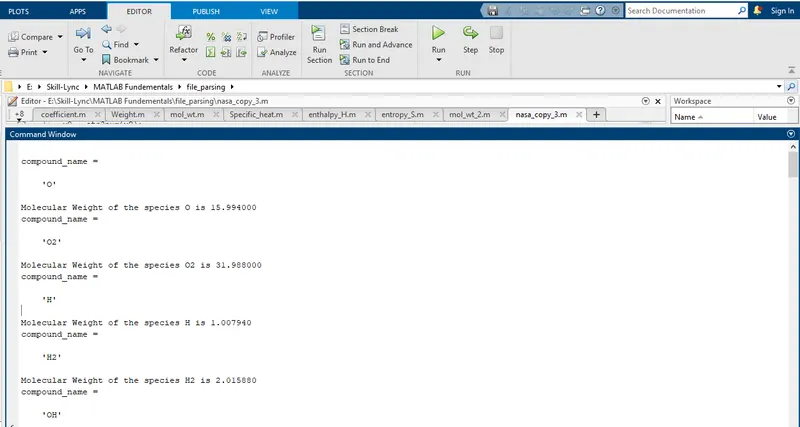
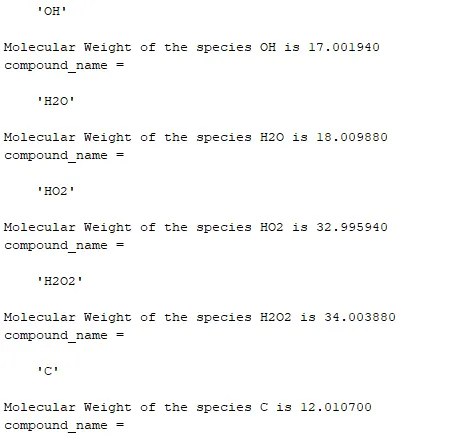
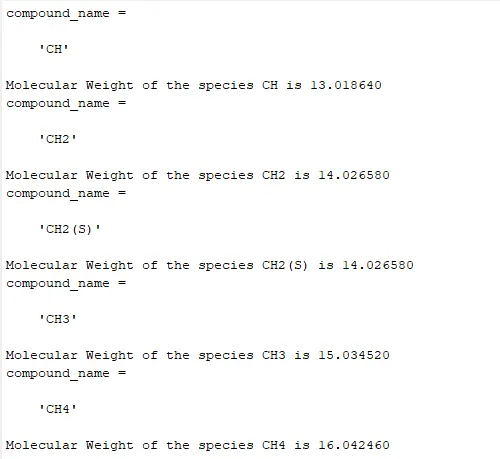
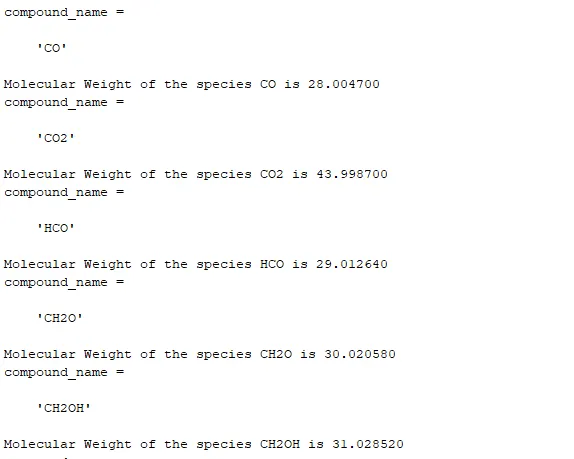
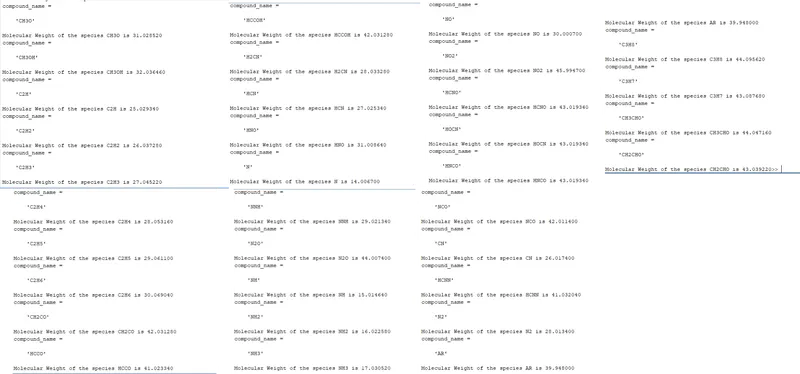
The molecular weight function is used to calculate the molecular weight, which is shown in the command window.
The plots for Cp, H, S are created for each species and saved in a folder in jpg format to access the species with different
images
Creating folders for different molecules and save the plots for specific heat, enthalpy, and entropy in that folder and display
the molecular weight of different species in the command window
Main Code
function [Cp,H,S]=coefficient(local_low_temp,local_average_temp,local_high_temp,La,Ha)
for i=1:local_high_temp-local_low_temp+1
R=8.34;
T=i+local_low_temp-1;
%for lower temperature values
if T<= local_average_temp
Cp(i)=R*(La(1)+La(2)*T+La(3)*T^2+La(4)*T^3+La(5)*T^4);
%for higher temperature values
else
Cp(i)=R*(Ha(1)+Ha(2)*T+Ha(3)*T^2+Ha(4)*T^3+Ha(5)*T^4);
end
end
end
function [Cp,H,S]=coefficient(local_low_temp,local_average_temp,local_high_temp,La,Ha)
for i=1:local_high_temp-local_low_temp+1
R=8.34;
T=i+local_low_temp-1;
%for lower temperature values
if T<= local_average_temp
H(i)=R*T*(La(1)+(La(2)*T)/2+(La(3)*T^2)/3+(La(4)*T^3)/4+(La(5)*T^4)/5+La(6)/T);
%for higher temperature values
else
H(i)=R*T*(Ha(1)+((Ha(2)*T)/2)+(Ha(3)*T^2)/3+(Ha(4)*T^3)/4+(Ha(5)*T^4)/5+(Ha(6)/T));
end
end
end
function [Cp,H,S]=coefficient(local_low_temp,local_average_temp,local_high_temp,La,Ha)
for i=1:local_high_temp-local_low_temp+1
R=8.34;
T=i+local_low_temp-1;
%for lower temperature values
if T<= local_average_temp
S(i)=R*(La(1)*log(T)+(La(2)*T)+((La(3)*T^2)/2)+((La(4)*T^3)/3)+((La(5)*T^4)/4)+(La(7)));
%for higher temperature values
else
S(i)=R*(Ha(1)*log(T)+(Ha(2)*T)+(Ha(3)*T^2)/2+(Ha(4)*T^3)/3+(Ha(5)*T^4)/4+(Ha(7)));
end
end
end
Then, we will read first THERMO using 'fgetl 'command
Next we assign the temperature range using linspace command.
In next step we run the loop to find 53 element in the data file by assigning fgetl command and then spliting into the cell array to find the species line and then find the species name and then find the number of the temperatures in the species line.
Then we read the new line. In order to read the coefficient in the data file we will first find the 'E' string using 'strfind' command to find before and after numbers of the coefficients then we will find remaining 14 coefficients and convert them to numbers from strings using 'str2num' command.
Out of which we will find the first 7 Coefficients which are for Higher temperature or temperatures above median temperature and then Second 7 Coefficients which are for Lower temperature or below median temperature.
Now we will specify Specific heat Cp, Entropy S, Enthalpy H functions to find these parameters using these 14 coefficients for Lower and higher Temperature. then we will specify molecular weight W function to find the Molecular weight of the different species.
In the next step0 we write the Molecular weight.txt file and 'fprintf' all the molecular weights of the species. and then close the txt file using 'fclose' command.
Now we change the directory using 'cd' command and then creating directory folder where we have to save our files
using 'mkdir' command and then we will change the directory to this created folder.
Now, we will plot Specific heat, Entropy and Enthalpy with the Temperature for different species. We we will use 'scanf' command to in the title command to create different species title.
Then we will use saveas command to save the plots of different species in the directory folder. Now we will change the directory to which our main code file runs in the MATLAB.fgetl - To proceed to reading new line