Week 1- Mixing Tee
AIM:-
- To set up the steady state simulations to compare the mixing effectivness, when the hot inlet temperature is 360C and the cold inlet temperature is at 190C.
- To use the k-epsilon and k-omega SST model for the first case and based on your judgment use the more suitable model for further cases.
Case - 1
- Short mixing tee with a hot inlet velocity of 3m/s.
- Momentum ratio of 2, 4.
Case - 2
- Long mixing tee with a hot inlet velocity of 3m/s.
- Momentum ratio of 2, 4.
Momentum ratio = Velocity at cold inlet / Velocity at hot inlet.
In a table, compare the following values from the 2 cases.
- Cell count
- Average outlet temperature
- Number of iterations for convergence
Expected results:
- Velocity and temperature contour plots on the cut planes along and across the pipe.
- Velocity and temperature line plots along and across the length of the pipe.
- Perform Mesh independent study for any one case.
- Discuss the effect of length and momentum ratio on results.
Mostly fluid flows are takes place through circular crosscections are known as pipes, Mostly liquids are transported in circular pipes, Because the pipes with circular cross sections can withstand large pressure differences between the inside and outside without significant distortion. A typical piping system should involves pipes of different diameters connected via various fittings(T-junction, Y-junction or elbows).
Tee pipes are commonly used in piping systems and also in muli channel network in various industries like electronic, petrochemical, nulclear plant etc. The mixing of hot fluid and cold fluid give rise to temperature fluctuation in the vicinity of mixing zone. The flow pattern of fluid give necessary information such as area, where thermal zones are high. Using different momentum ratio, the efficiency of the model and also its effectivness can be checked.
Data:-
- Hot inlet air temperature(x-inlet) = 360C
- Cold inlet air temperature(y-inlet) = 190C
- Hot air inlet velocity= 3m/s
- Momentum ratio = 2 and 4
For momentum ratio=2
Velocity at cold inlet = Momentum ratio x Velocity at hot inlet.
cold inlet velocity = 2x3 = 6m/s.
For momentum ratio=4
Velocity at cold inlet = Momentum ratio x Velocity at hot inlet.
cold inlet velocity = 4x3 = 12m/s.
Geometry- Setup
- Ansys Workbench software was launched and for the analysis system"Fluid flow (Fluent) was choosened.Based on the case which is to be anlaysed the project is renmaed.
- Step file of the suitable case has to be selected and right click on the "geometry" and "import geometry" option is selected and loaded the geometry.
- After the geometry has to be loaded and then modify the geometry as per requirments.
- As the gemetry is loaded in ansys space claim and now we need to create the wet region for setting up the fluid flow simulation.
- The fluid volume for analysis is extracted from the geometry by using the following commands that are available in the "ansys space claim". ie; Prepare--> Volume extract-->Select the Select Edges option-->Select the open edges --> Select the green tick option, to form the fluid volume flow region for analysis. As the wet region is formed, then suppress the solid region.
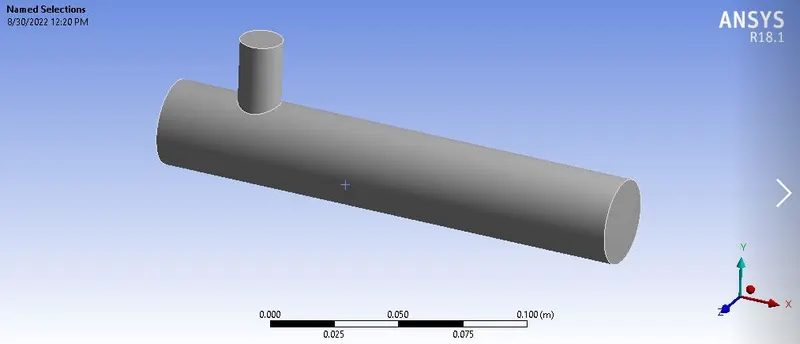
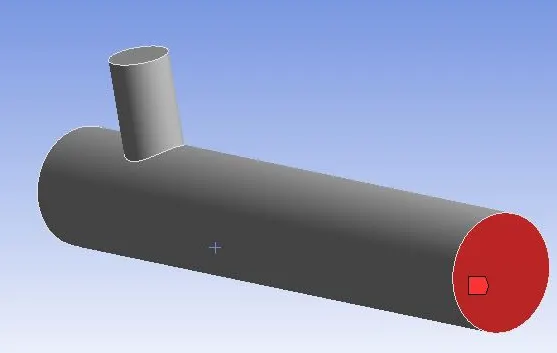
- Now we have to creae the named selection. For creating a named selection, fix the selection mode to "Face selection".
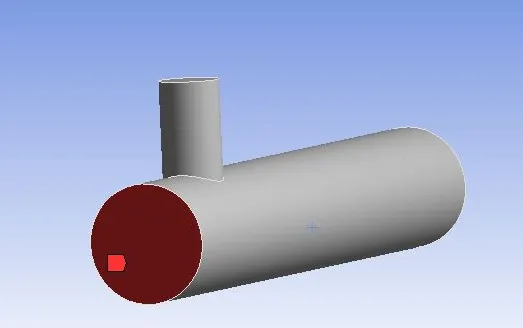
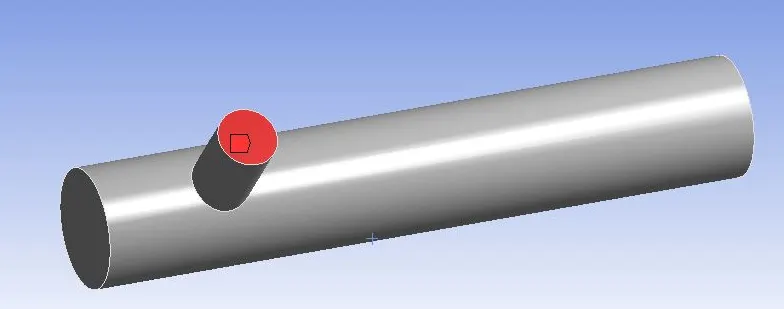
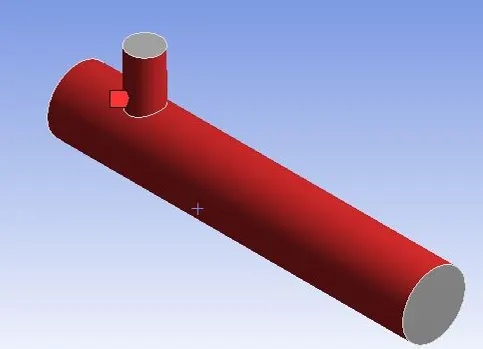
- Select the faces and create the named selections and shown below
X-inlet
Y-inlet
Walls
Oulet
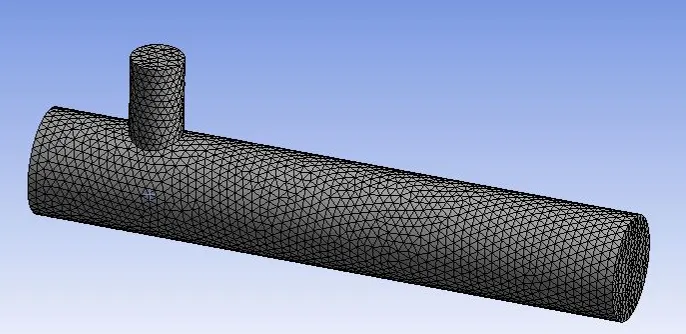
- Now mesh the geometry by clicking the option mesh and then select the desired meshing parmeters and click on generate mesh.
- In this case medium mesh size is provided and created the mesh and is shown below.
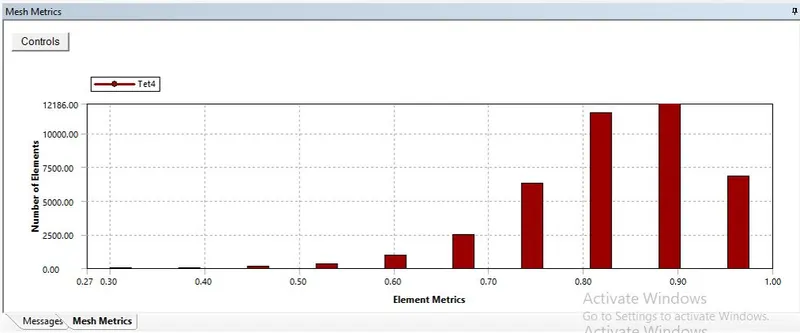
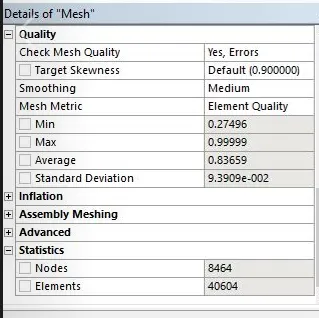
Mesh Metric, Mesh Quality and Mesh Staistics

Case Setup
- Case 1
- Short mixing tee with a hot inlet velocity of 3m/s.
- Momentum ratio =2
- y-inlet velocities of 6m/s.
- Here k-epsilon model is first selected and then based on the results, K-Omega SST model is then selected for comparison.
K-epsilon model:-
- Once the setup is open, click on general-->Units-->Temperature
- Set the solver type as pressure based and Absolute under velocity formulation.
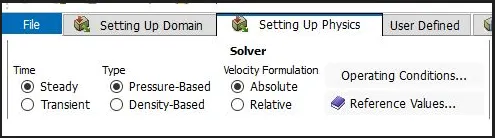
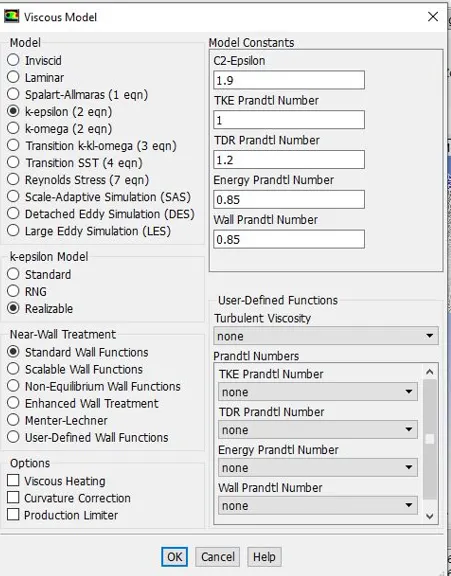
- Under Models, Enegy equation is on and select the K-epsilon Model and then click ok.
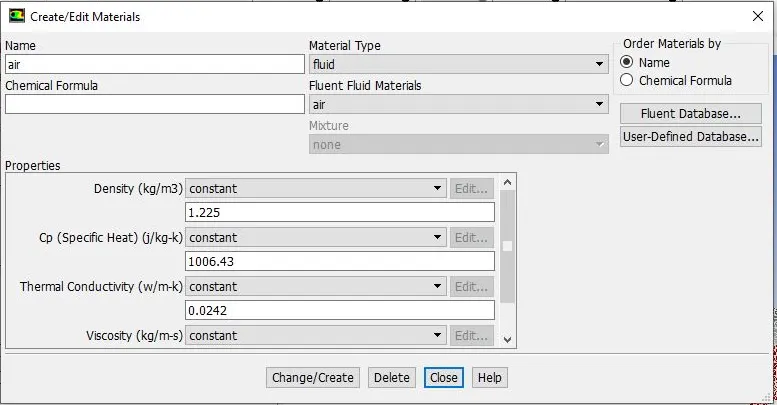
- Under material set the fluid to be air.
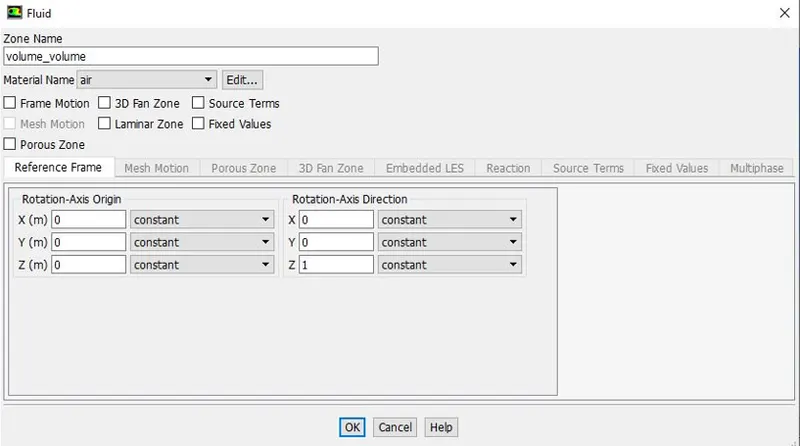
- Under Cell zone conditions, the fluid selected as air.
- Select the Boundary conditions and set the boundary conditions for the created named selections.
X-inlet
- Assign Velocity-inlet and set the velocity and temperature of the fluid.
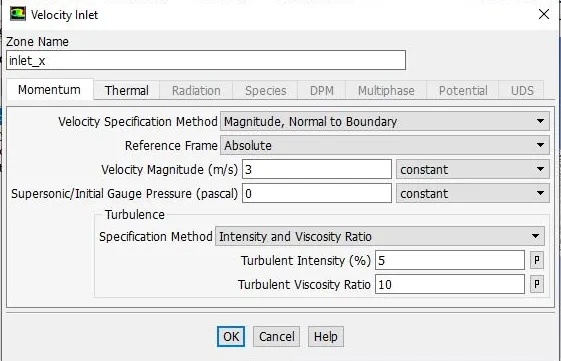
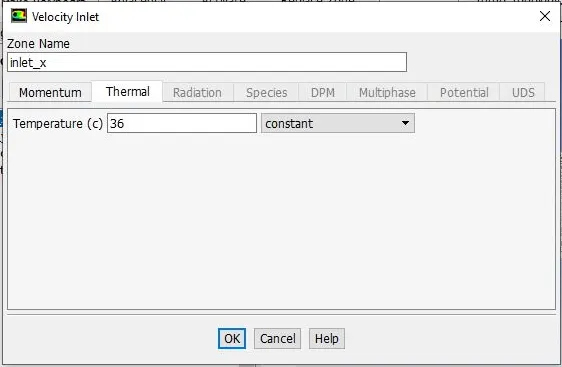
Y-inlet
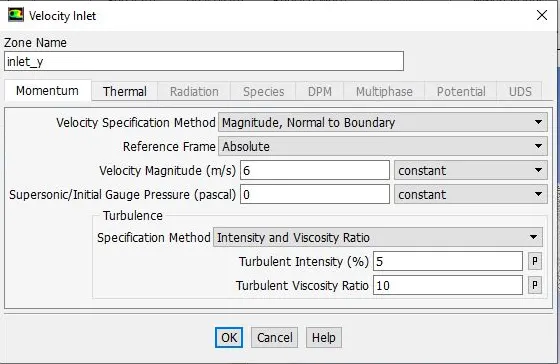
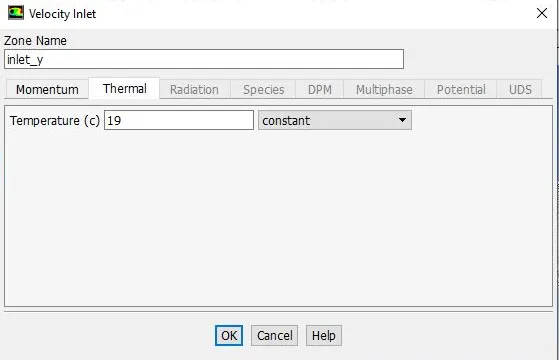
Walls
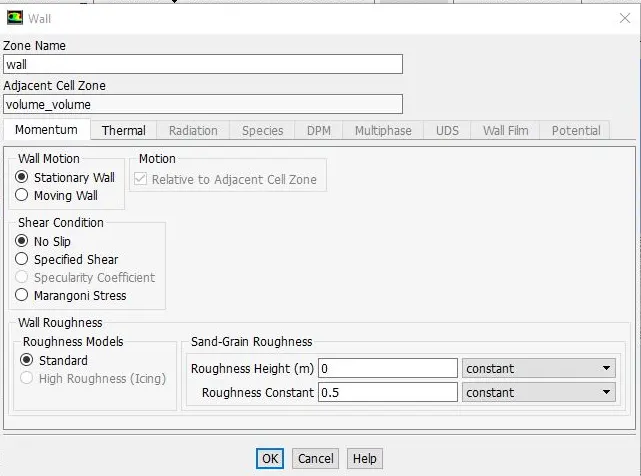
- Then under Report Definitions select the parameters that are needed to be calculated. under Initialization select the initialization method as Hybrid and then select initialise button.Then under Run Calculation parameter enter the desired number of iterations and click on calculate.
Reports
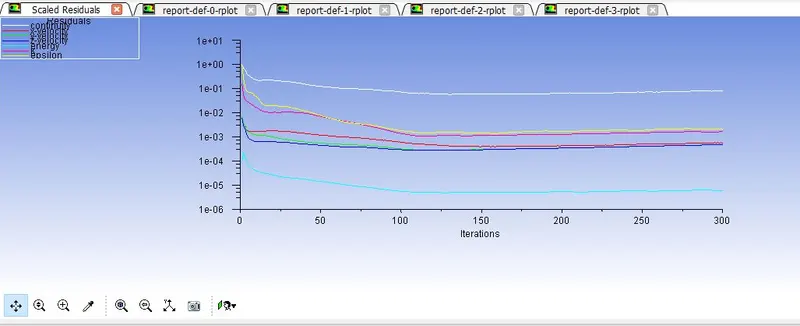
K-epsilon model:-
Scaled Residual
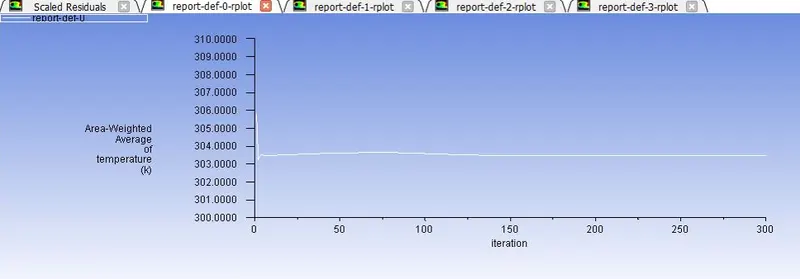
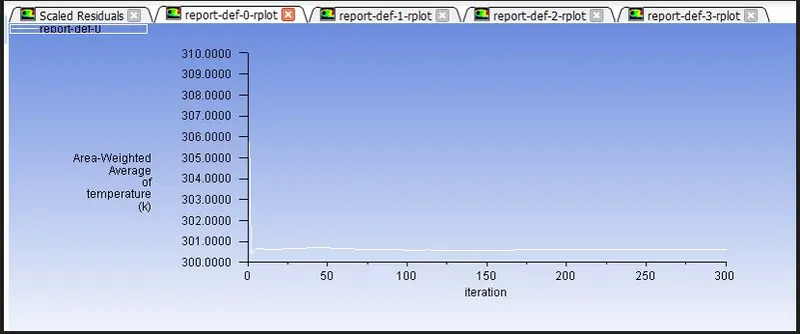
Area Weighted Average of temperature
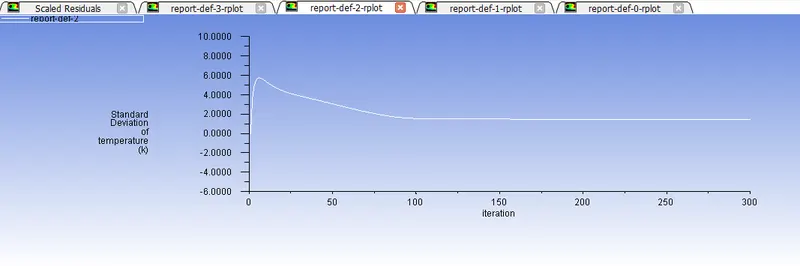
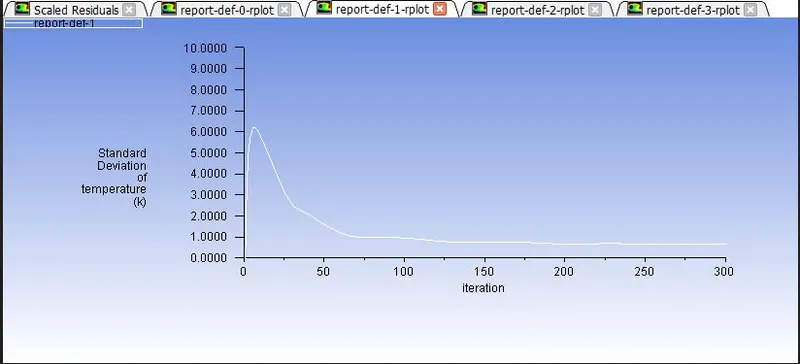
Standard Deviation of temperature
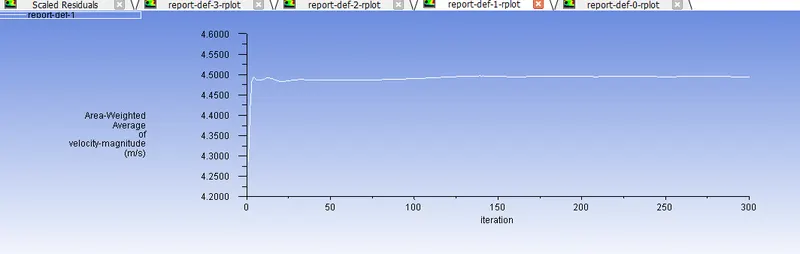
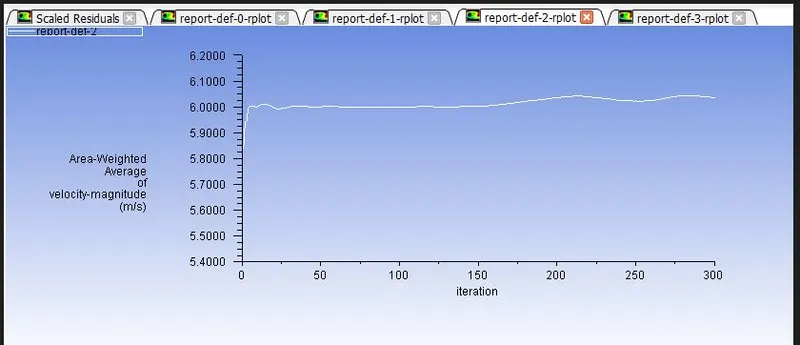
Area-Weighted Average of Velocity-Magnitude
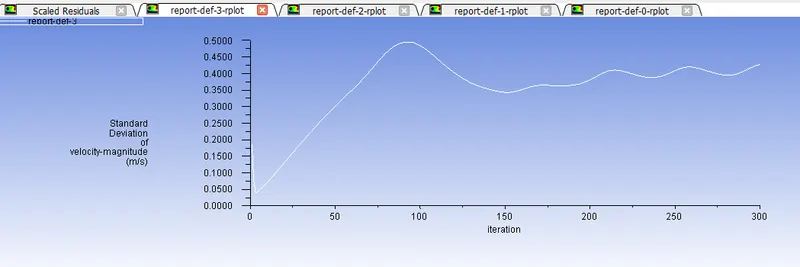
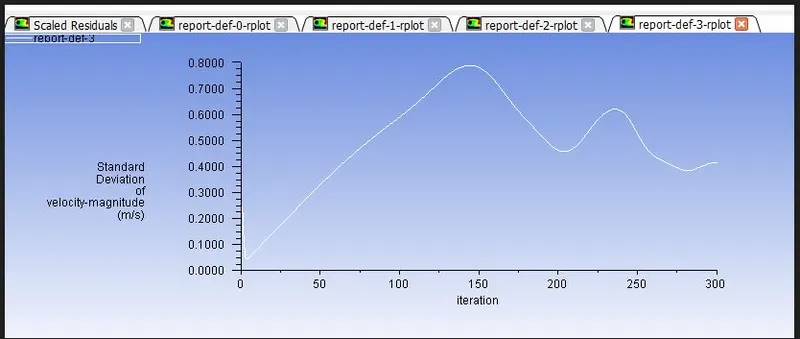
Standard Deviation of Velocity-Magnitude
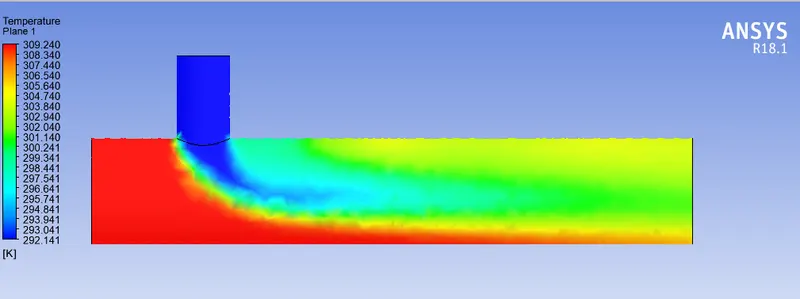
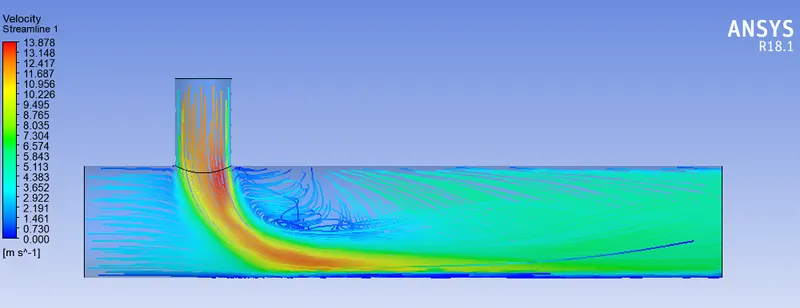
Contour Plots
1)For Temperature distribution
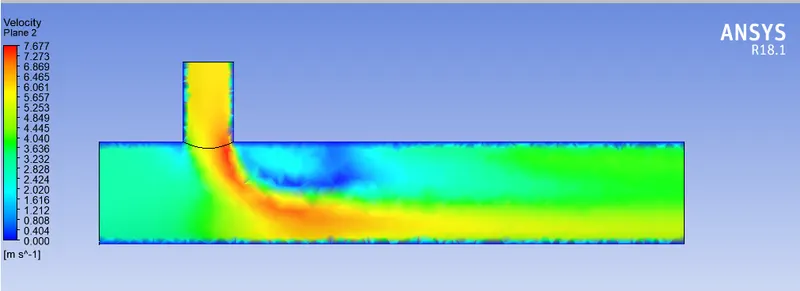
2)For Velocity Distribution
Line Plot
1)For Temperature distribution
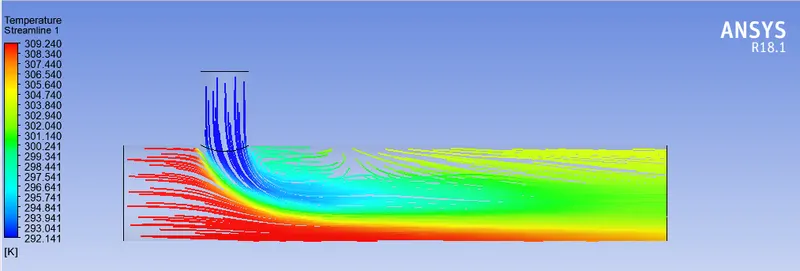
2)For Velocity Distribution
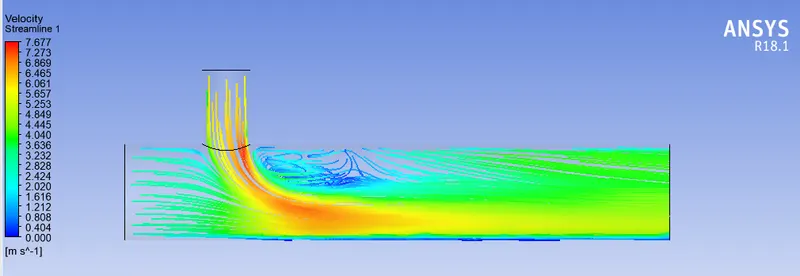
Reports
K-Omega SST model:-
Scaled Residual
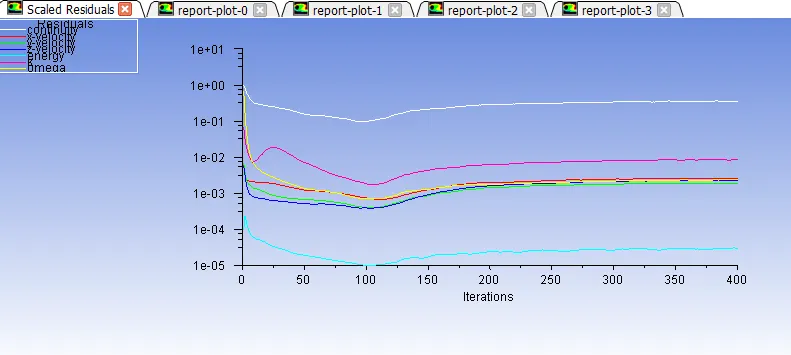
Area Weighted Average of temperature
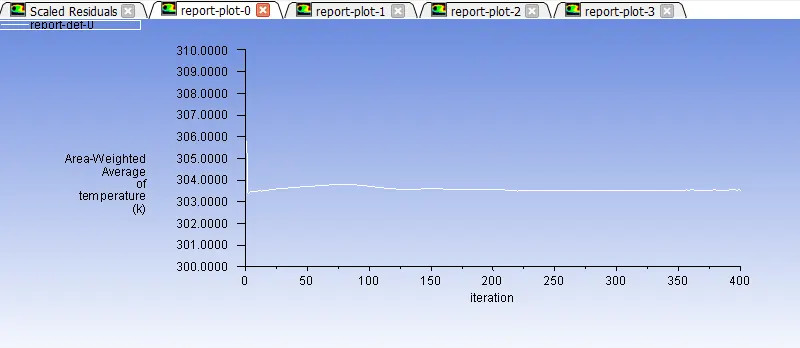
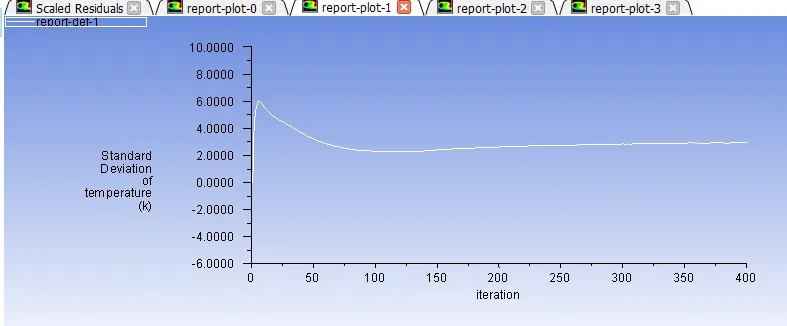
Standard Deviation of temperature
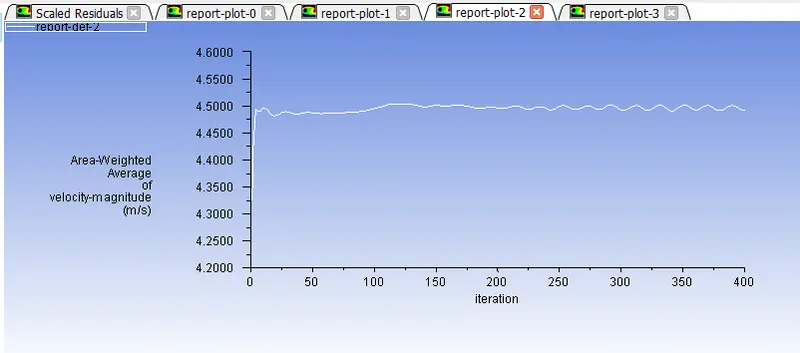
Area-Weighted Average of Velocity-Magnitude
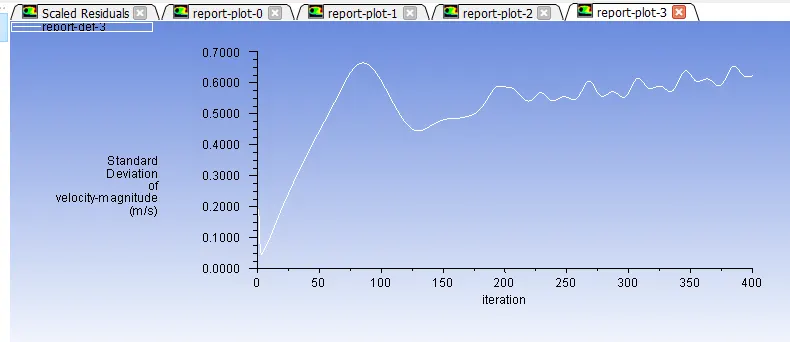
Standard Deviation of Velocity-Magnitude
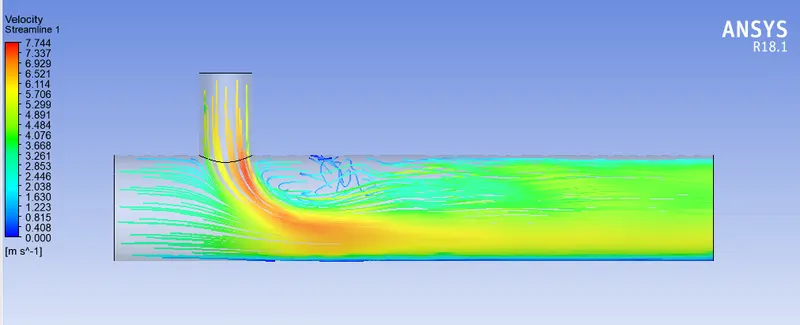
Contour Plots
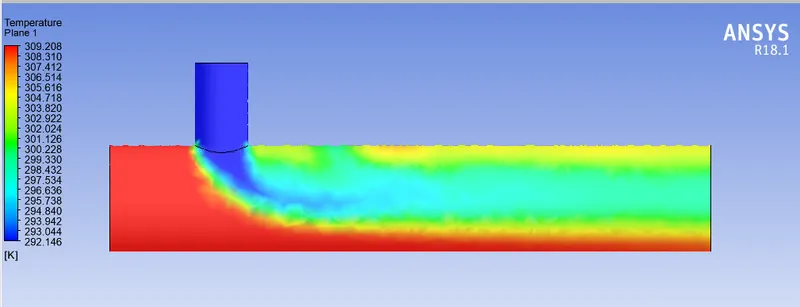
1)For Temperature distribution
2)For Velocity Distribution
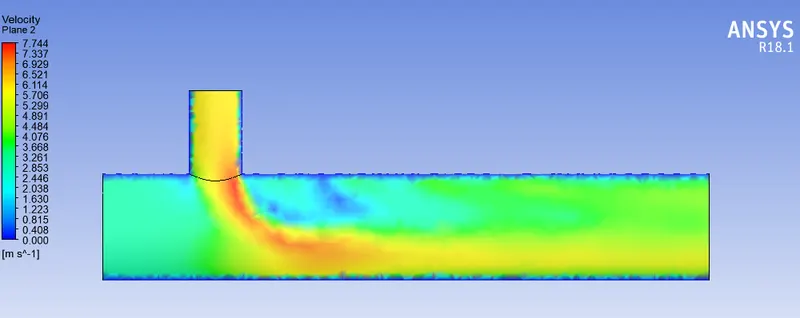
Line Plot
1)For Temperature distribution
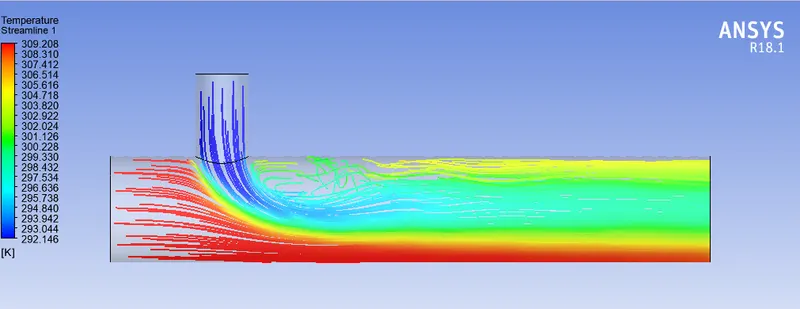
2)For Velocity Distribution
|
Short Tee (MR=2) |
||
|
k-epsilon |
k-omega |
|
|
Cell count |
40604 |
40604 |
|
Avg. Outlet Temperature |
303.46802k |
303.54667 kelvin |
|
Standard Deviation |
1.41 |
2.94 |
|
No of Iterations |
300 |
400 |
Short mixing tee with a hot inlet velocity of 3m/s.
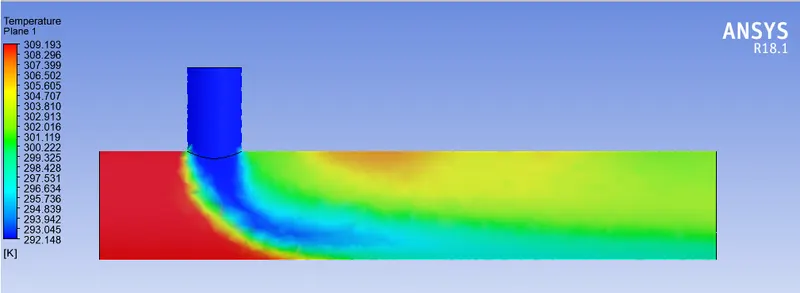
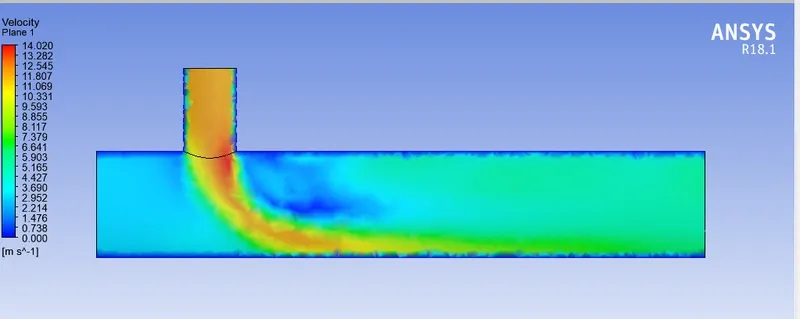
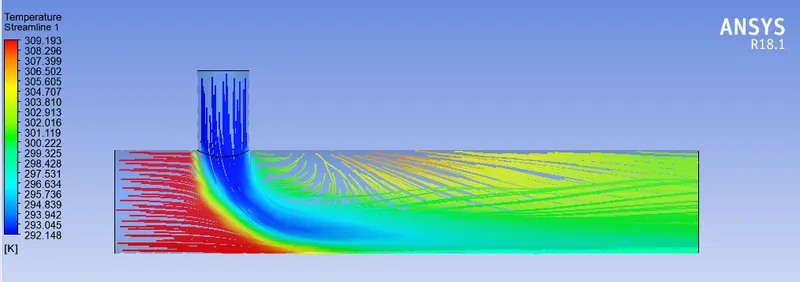
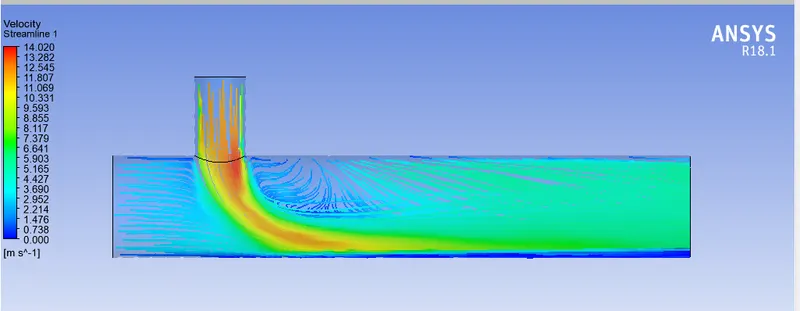
Momentum ratio =4
y-inlet velocities of 12m/s.
Reports
K-epsilon model:-
Scaled Residual
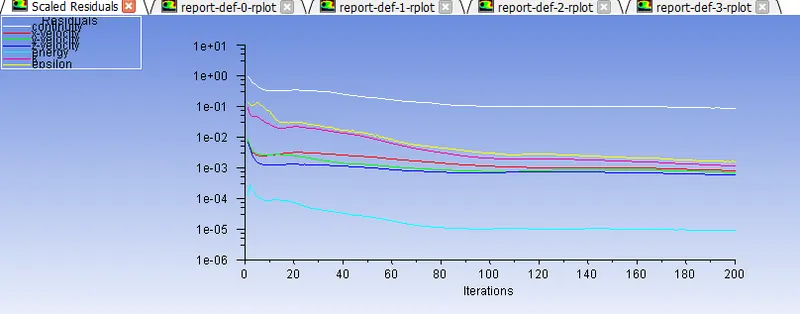
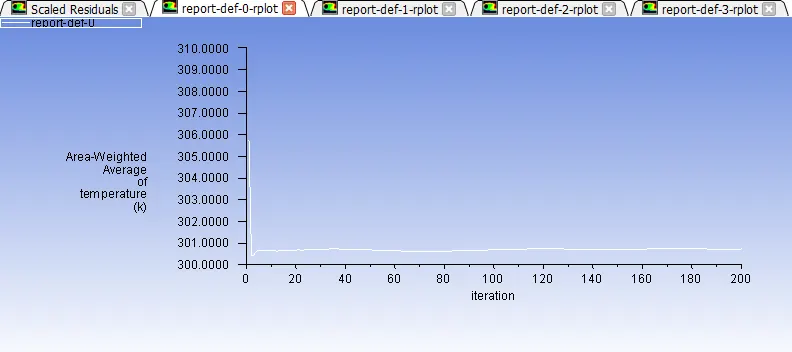
Area Weighted Average of temperature
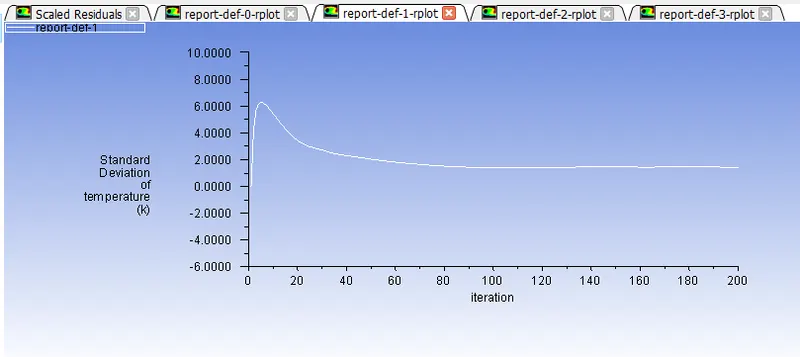
Standard Deviation of temperature
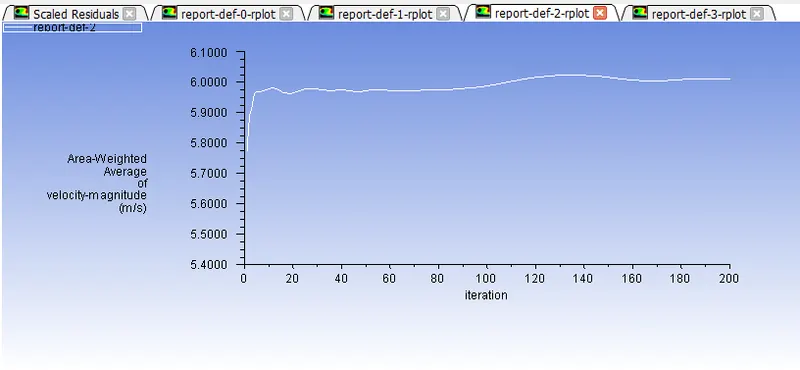
Area-Weighted Average of Velocity-Magnitude
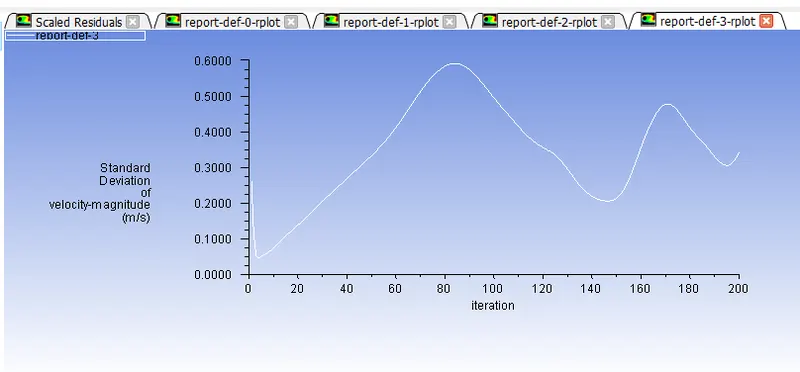
Standard Deviation of Velocity-Magnitude
Contour Plots
1)For Temperature distribution
2)For Velocity Distribution
Line Plot
1)For Temperature distribution
2)For Velocity Distribution
Reports
K-Omega SST model:-
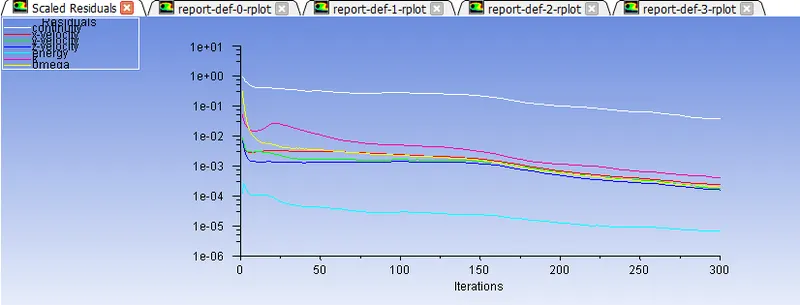
Scaled Residual
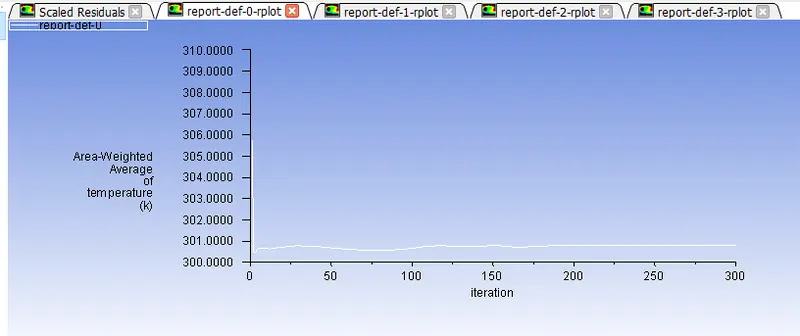
Area Weighted Average of temperature
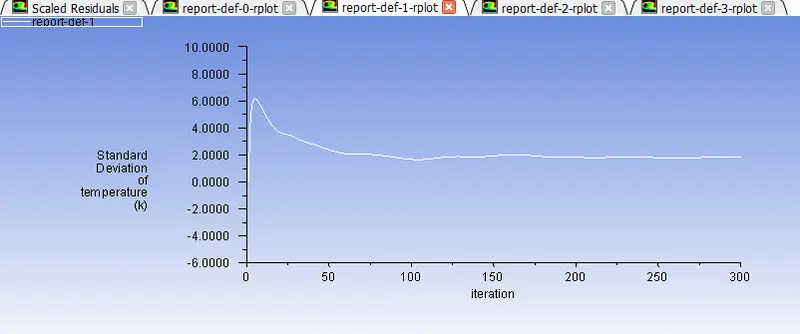
Standard Deviation of temperature
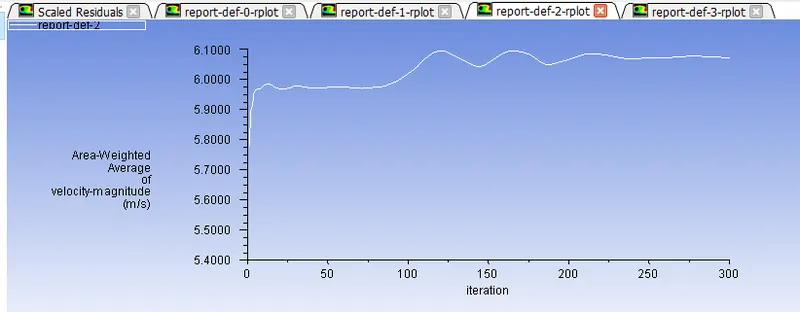
Area-Weighted Average of Velocity-Magnitude
Standard Deviation of Velocity-Magnitude
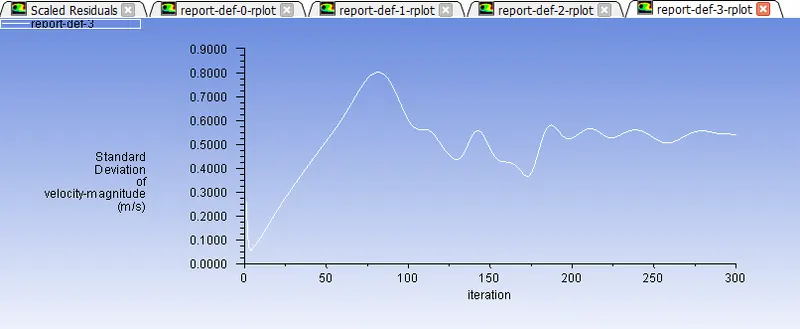
Contour Plots
1)For Temperature distribution
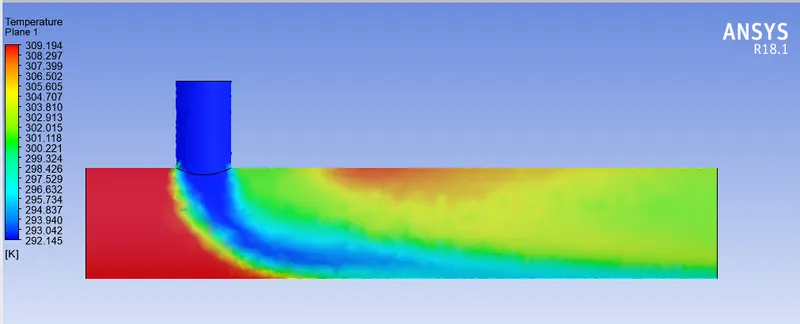
2)For Velocity Distribution
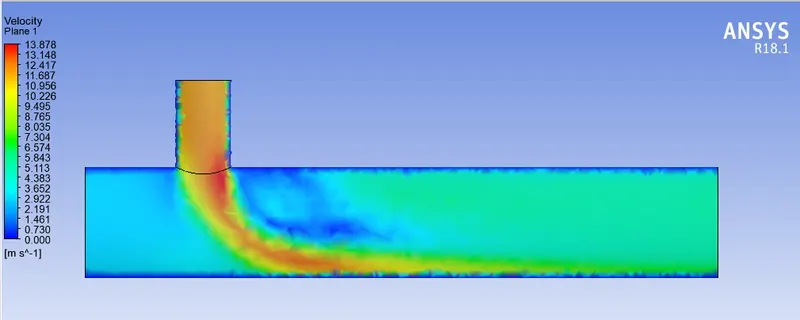
Line Plot
1)For Temperature distribution
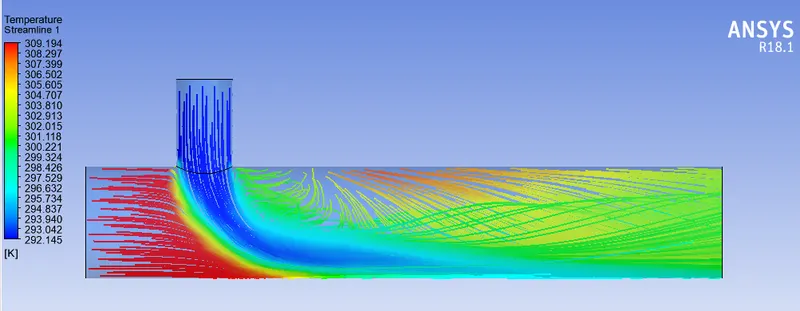
2)For Velocity Distribution
|
Short Tee (MR=4) |
||
|
k-epsilon |
k-omega |
|
|
Cell count |
40604 |
40604 |
|
Avg. Outlet Temperature |
300.73748 |
300.81932 |
|
Standard Deviation |
1.43 |
1.85 |
|
No of Iterations |
200 |
300 |
CONCLUSION
- While comparing the short tee with momentum ratio 2 and 4, the standard deviation for K-epsilon model is lower than while comparing with the K-omega SST model. Hence it may understand that the K-epsilon model has better mixing efficiency than the K-omega SST model.
- Also comparing with K-omega SST model, the k-epsilon model is faster to converge the solutions with less no of iterations.
- So k-epsilon model is used for the future calculations.
CASE 2
- Long mixing tee with a hot inlet velocity of 3m/s.
- Momentum ratio of 4.
Geometry- Setup
- Step file of the suitable case has to be selected and right click on the "geometry" and "import geometry" option is selected and loaded the geometry.
- After the geometry has to be loaded and then modify the geometry as per requirments.
- As the gemetry is loaded in ansys space claim and now we need to create the wet region for setting up the fluid flow simulation.
- The fluid volume for analysis is extracted from the geometry by using the following commands that are available in the "ansys space claim". ie; Prepare--> Volume extract-->Select the Select Edges option-->Select the open edges --> Select the green tick option, to form the fluid volume flow region for analysis. As the wet region is formed, then suppress the solid region.
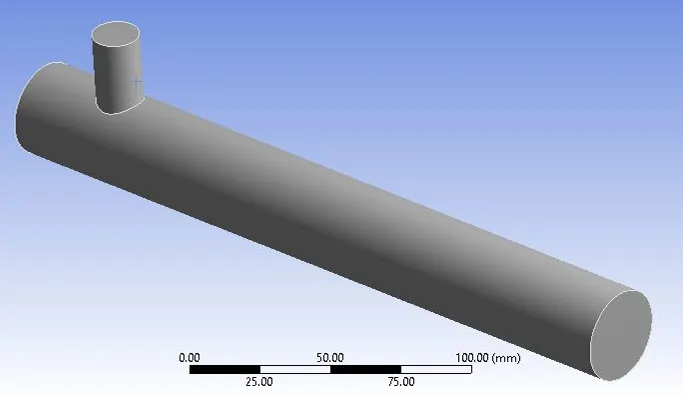
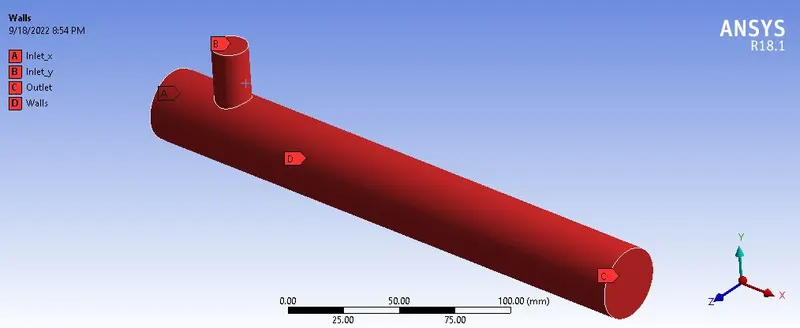
- Now we have to creae the named selection. For creating a named selection, fix the selection mode to "Face selection".
- Select the faces and create the named selections and shown below
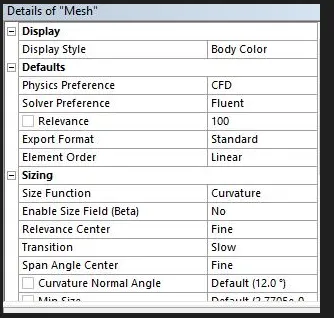
- Now mesh the geometry by clicking the option mesh and then select the desired meshing parmeters and click on generate mesh.
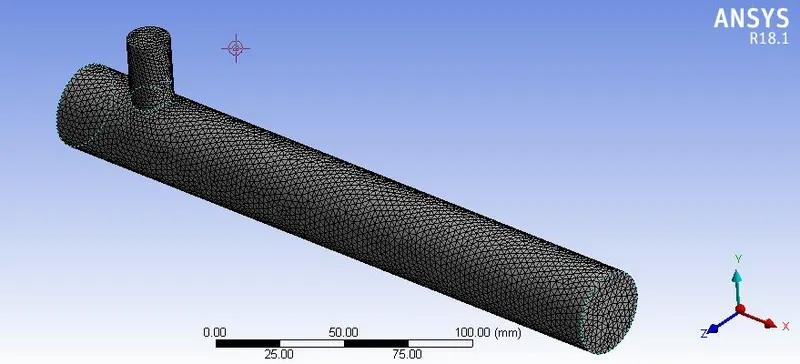
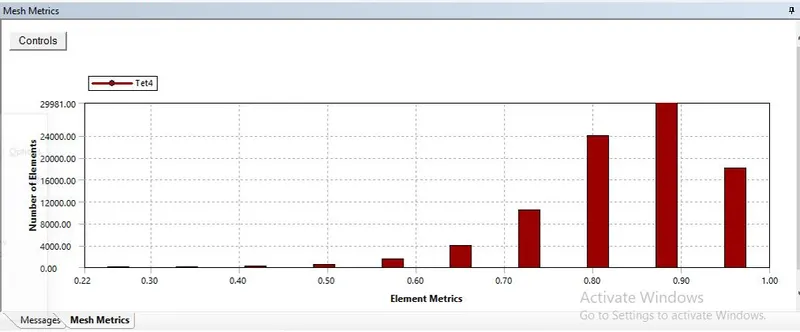
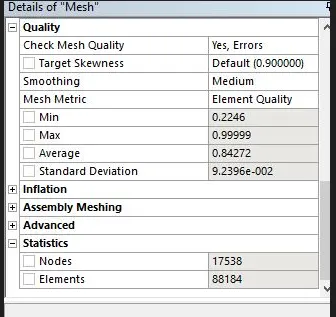
Mesh Metric, Mesh Quality and Mesh Staistics
Results:
For K-epsilon model:
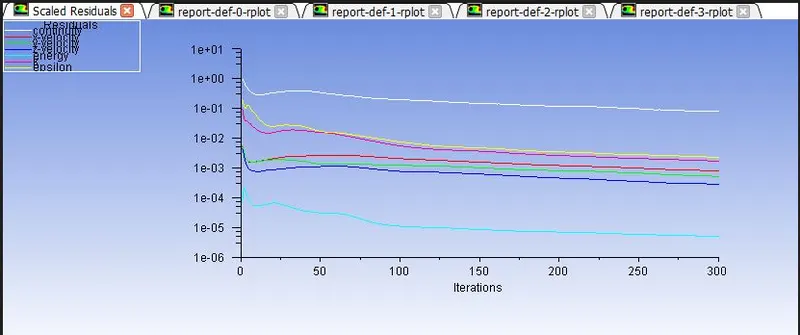
Residuals Plot
Area Weighted Average of temperature
Standard Deviation of temperature
Area-Weighted Average of Velocity-Magnitude
Standard Deviation of Velocity-Magnitude
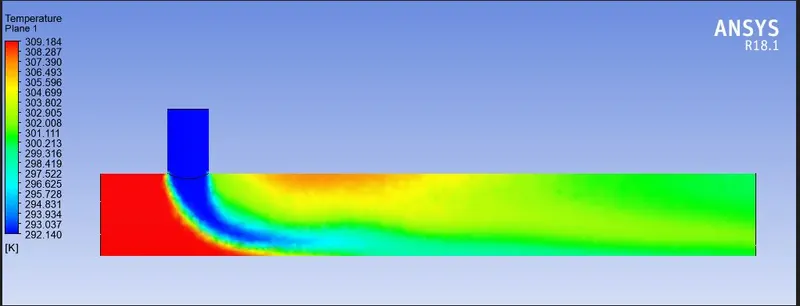
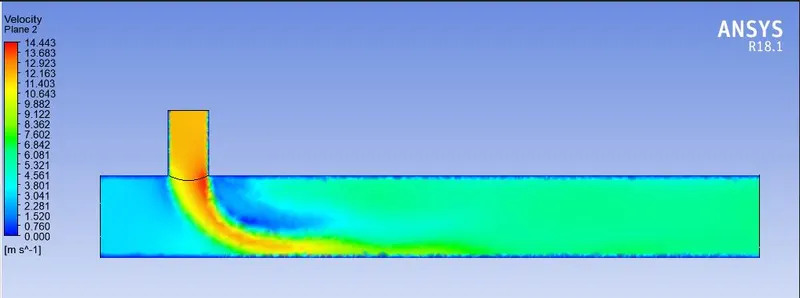
Contour Plots
1)For Temperature distribution
2)For Velocity Distribution
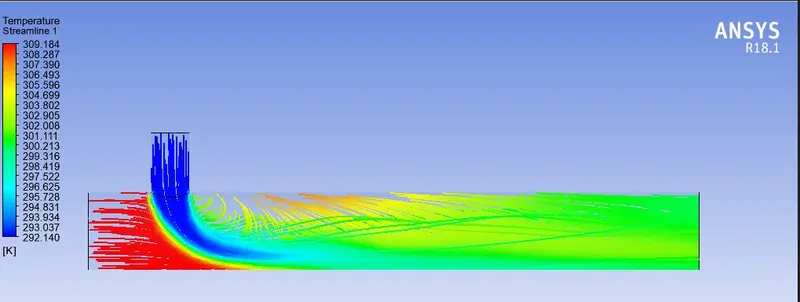
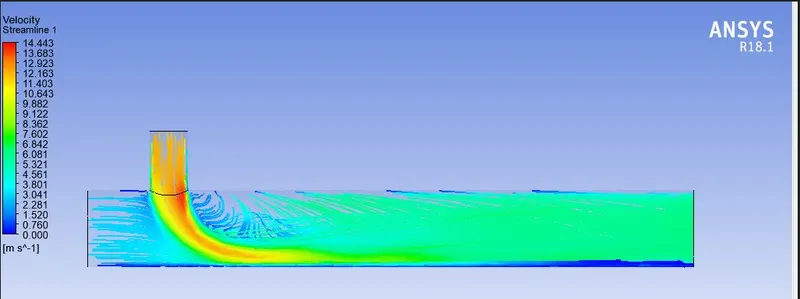
Line Plot
1)For Temperature distribution
2)For Velocity Distribution
|
Long Tee (MR=4) |
||
|
k-epsilon |
k-omega |
|
|
Cell count |
88184 |
------ |
|
Avg. Outlet Temperature |
300.62864 |
------- |
|
Standard Deviation |
0.65 |
------- |
|
No of Iterations |
300 |
------- |
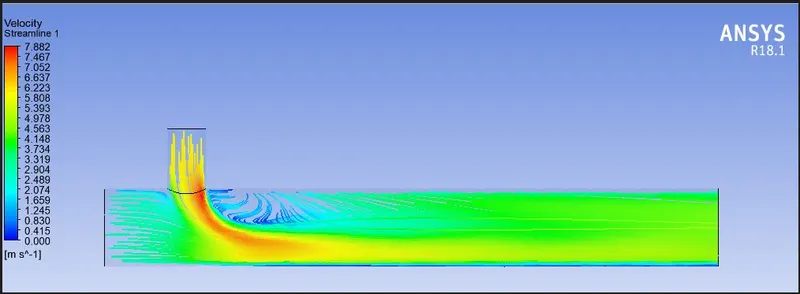
- Long mixing tee with a hot inlet velocity of 3m/s.
- Momentum ratio of 2.
Results:
For K-epsilon model:
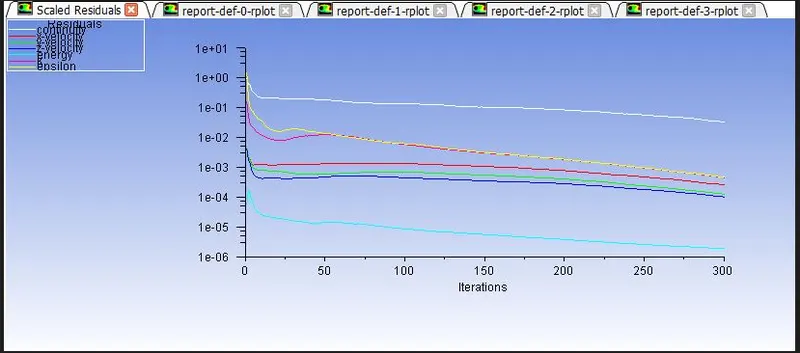
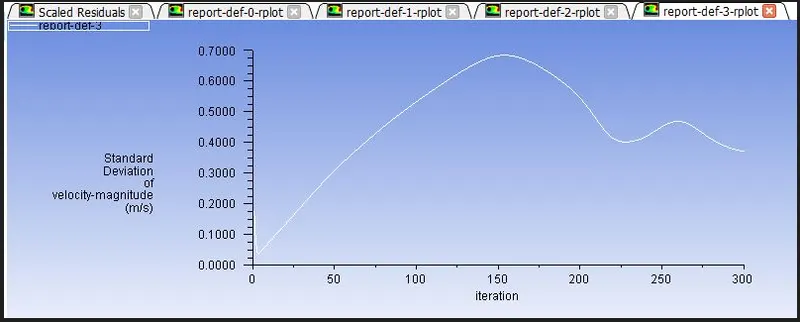
Residuals Plot
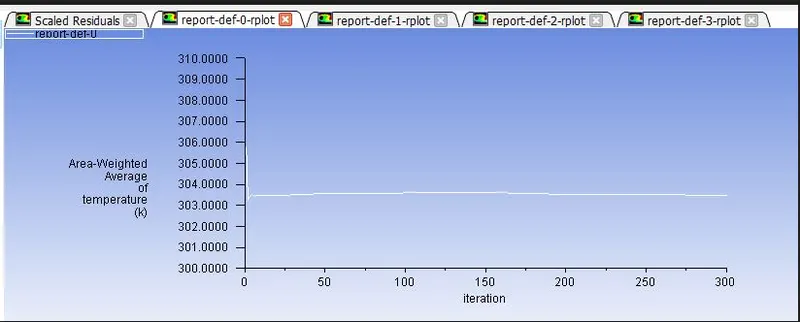
Area Weighted Average of temperature
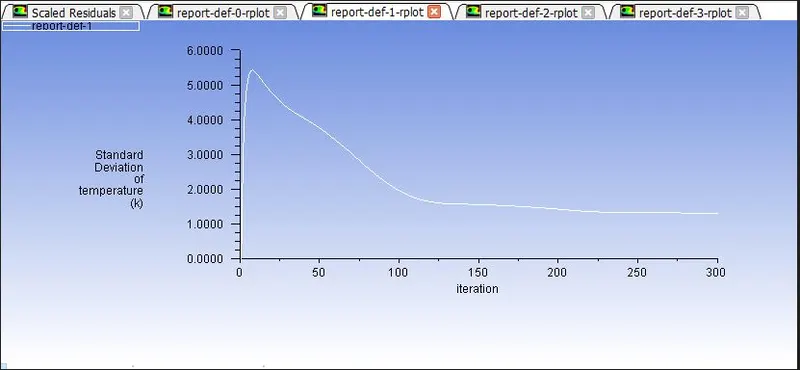
Standard Deviation of temperature
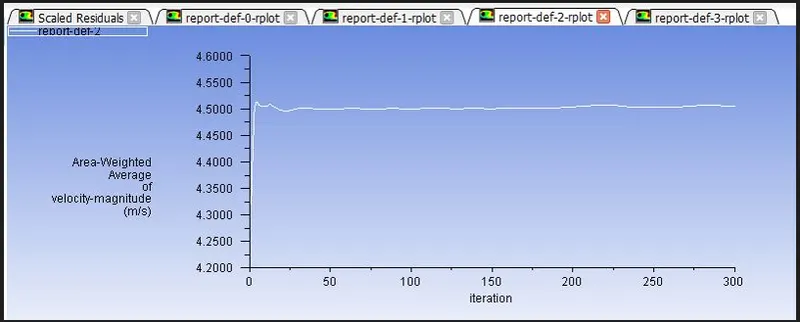
Area-Weighted Average of Velocity-Magnitude
Standard Deviation of Velocity-Magnitude
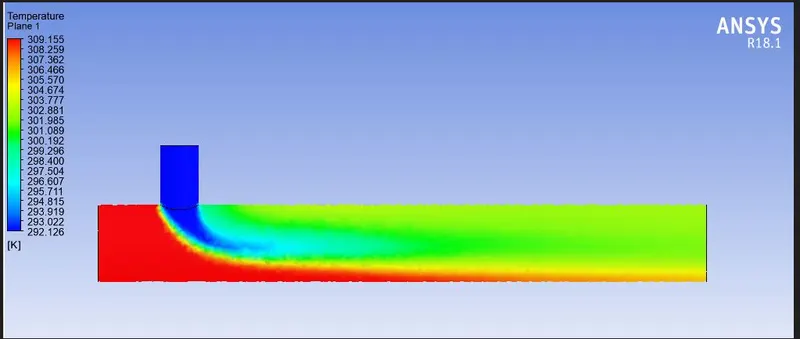
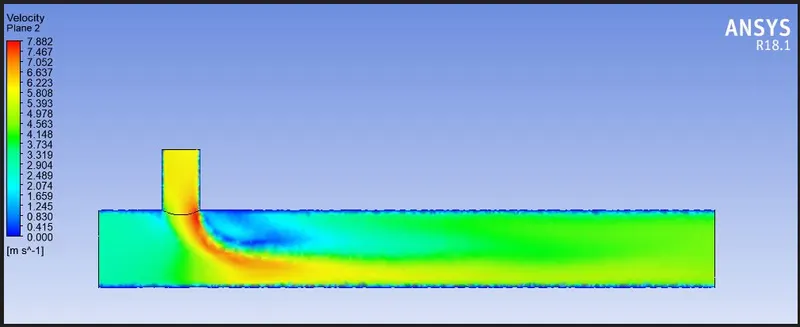
Contour Plots
1)For Temperature distribution
2)For Velocity Distribution
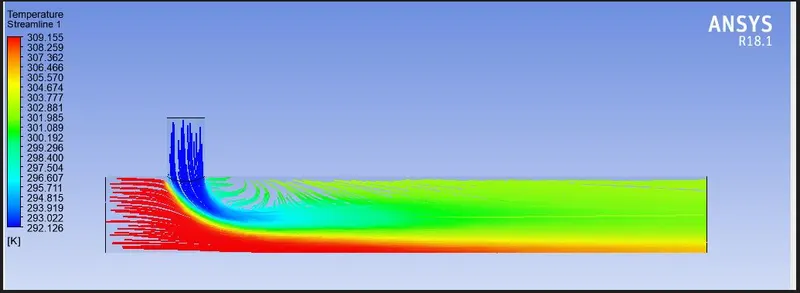
Line Plot
1)For Temperature distribution
2)For Velocity Distribution
|
Long Tee (MR=2) |
||
|
k-epsilon |
k-omega |
|
|
Cell count |
88184 |
------ |
|
Avg. Outlet Temperature |
303.48389 |
------- |
|
Standard Deviation |
1.30 |
------- |
|
No of Iterations |
300 |
------- |
Summary of Results
Comparison between Momentum Ratio 2 and 4:
|
Long Tee (MR=4) |
Long Tee (MR=2) | |
|
k-epsilon |
k-epsilon |
|
|
Cell count |
88184 |
88184 |
|
Avg. Outlet Temperature |
300.62864 |
303.48389 |
|
Standard Deviation |
0.65 |
1.30 |
|
No of Iterations |
300 |
300 |
Conclusion
- Comparing the results which are obtained from the above cases in both Long Tee and Short Tee. We can understand that Short Tee is preffered rather than Long Tee.
- Because short tee has better mixing efficiency and it should has low outlet temperature,while comparing it with long tee.
- As the cold fluid inlet velocity increases, thus results an increase in mixing effectivness.
- Analysing the results, it may find out that momentum ratio 4 has better effectivness than momentum ratio 2.
- We can seen that as the momentum ratio increases , the outlet temperature should decreases.
- As finer the size of mesh , better the accuracy of the solution. ie; as the size of the cells decreases, the no of cells increases and error should also decreases.
- One of the problem which is associated is as finer the size of cells, the computational time should increases.