Week 1- Mixing Tee
Mixing Tee in Ansys fluent
AIM:
For this challenge, we have created two versions of the mixing tee. One of them is longer than the other.
Your job is to set up steady-state simulations to compare the mixing effectiveness when the hot inlet temperature is 360C & the Cold inlet is 190C.
objective:
Use the k-epsilon and k-omega SST model for the first case and based on your judgment use the more suitable model for further cases. Giving the reason for choosing a suitable model is compulsory.
- Case 1
- Short mixing tee with a hot inlet velocity of 3m/s.
- Momentum ratio of 2, 4.
- Case 2
- Long mixing tee with a hot inlet velocity of 3m/s.
- Momentum ratio of 2, 4.
Momentum ratio = velocity at cold inlet / velocity at hot inlet
In a table, compare the following values from the 2 cases.
- Cell count
- Average outlet temperature
- Number of iterations for convergence
INTRODUCTION
In industrial process engineering, mixing is a unit operation that involves the manipulation of a heterogeneous physical system with the intent to make it more homogeneous. Mixing is performed to allow heat and/or mass transfer to occur between one or more streams, components, or phases. Modern industrial processing almost always involves some form of mixing. A mixing tee is a type of mixing mechanism. Mixing Tees utilizes a specifically engineered internal geometry to efficiently mix two fluid streams into one combined stream. Mixing tees are widely used in the petrochemical, HVAC industry, etc. in which two fluid streams with different physical and/or chemical properties mix together
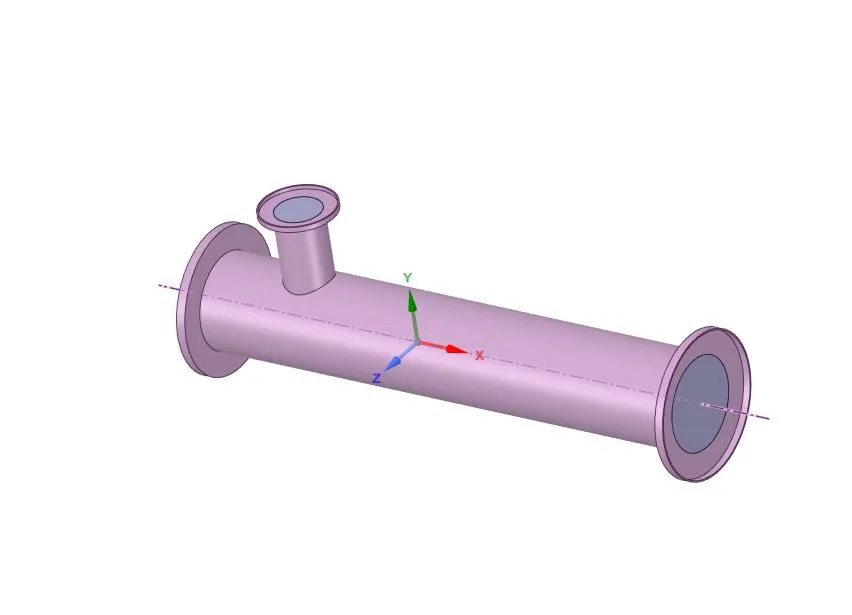
Hot air flowing in the main pipe is mixed with cold air flowing through a tee. The standard deviation of temperature is computed to quantify the degree of mixing. The velocity and temperature fields are also computed. The effects of the mesh size, and turbulence model on results were examined.
For this, we have created two versions of the mixing tee. One of them is longer than the other.
It is set up as steady-state simulations to compare the mixing effectiveness when hot inlet temperature is 360C & Cold inlet is 190C.
- Case 1
- Short mixing tee with a hot inlet velocity of 3m/s.
- Momentum ratio of 2, 4.
- Case 2
- Long mixing tee with a hot inlet velocity of 3m/s.
- Momentum ratio of 2, 4.
The momentum ratio is defined as the ratio of velocity at the cold inlet to the velocity at the hot inlet.
CASE setup-
CAD cleanup/Pre-processing- SpaceClaim.
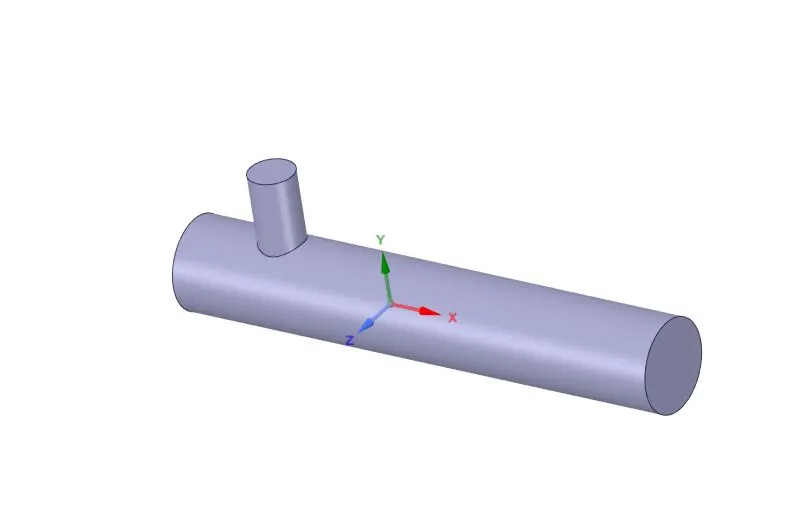
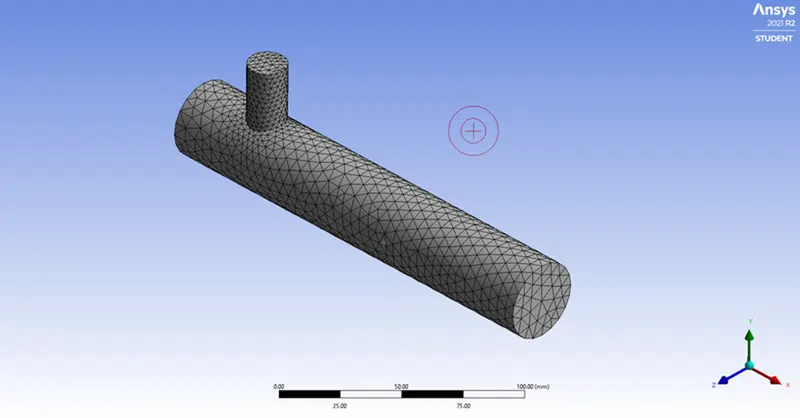
The CAD model is imported into SpaceClaim to extract the flow volume field from the model. The extracted volume is shown below:
Mesh
The boundary names are applied in this section and a mesh is generated.
Setup
In this section, we apply different boundary conditions like inlet, and outlet boundary conditions. Turbulence models are set up like K-epsilon or K-omega for solving the turbulent mixing of air. The number of iterations is set in this section.
CFD-Post
Post-processing is carried out in this section in which different contours are set up to visualize the properties (such as Temperature, velocity etc.) for which simulation is run.
[For Moment ratio 2 and velocity is 3m/s^2 and using k-epsilon)
CASE 1- SHORT TEE
a) For inlet velocity of 3m/s and momentum ratio of 2
Mesh size- 2m
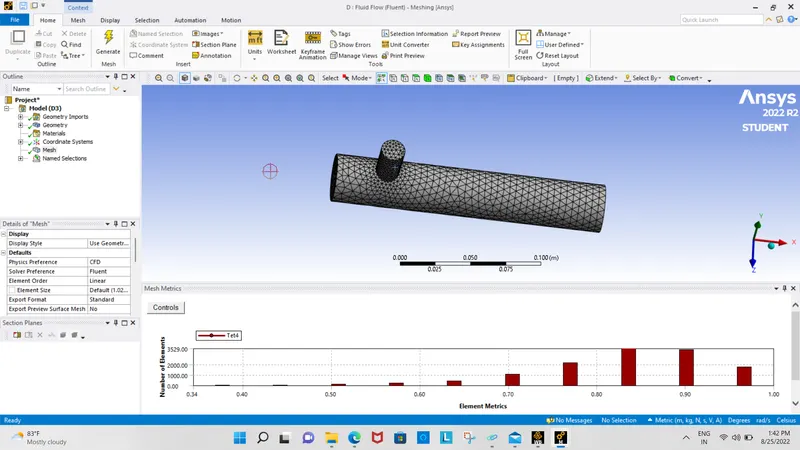
A mesh element metric that identifies the quality of mesh was employed and it can be seen that the elements of the lowest quality are minimal. Most of the elements have quality in the range of 0.7-1. Hence, the mesh is of acceptable quality.
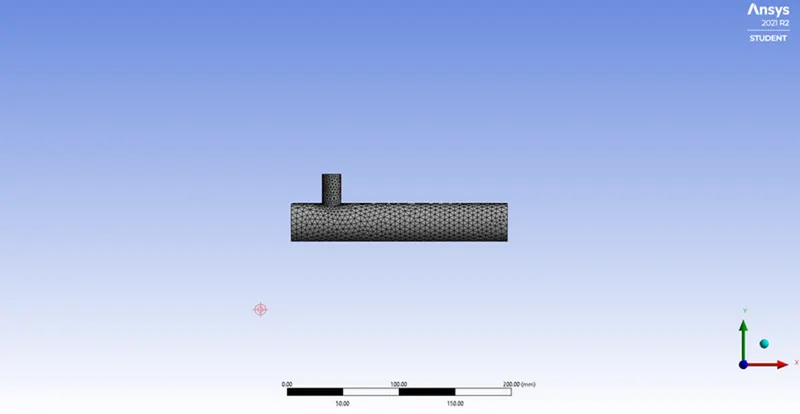
MESH
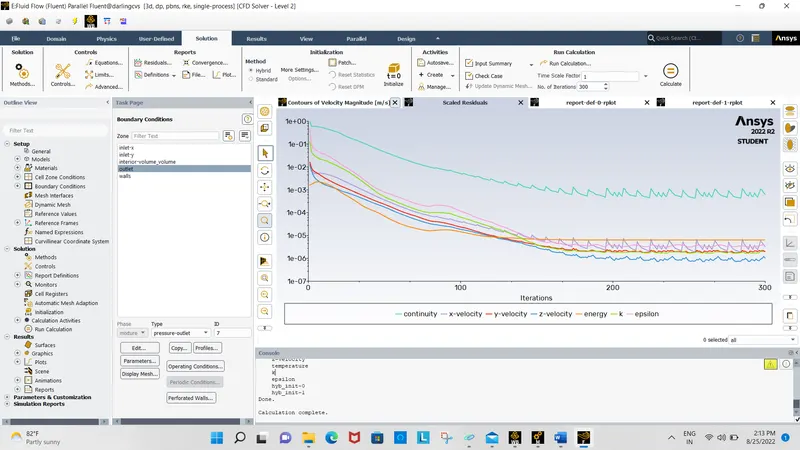
RESIDUAL
Standard-deviation:
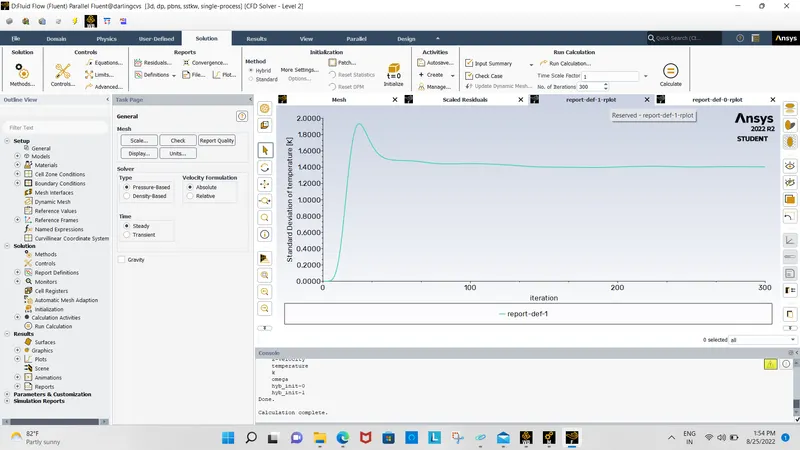
Temperature plot:
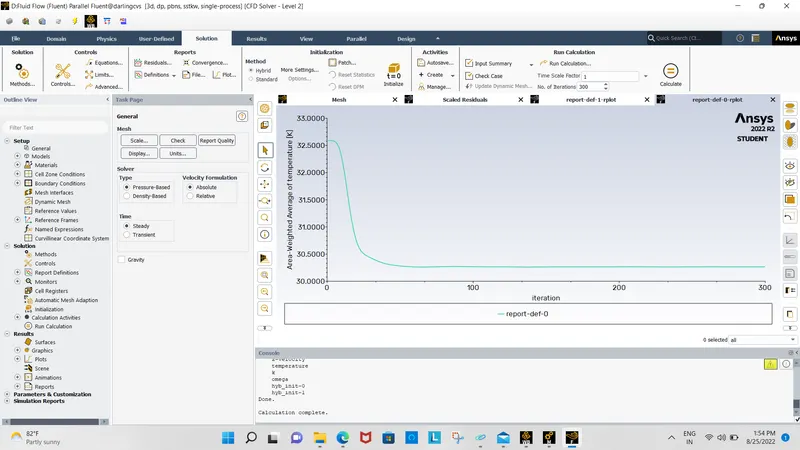
contour:
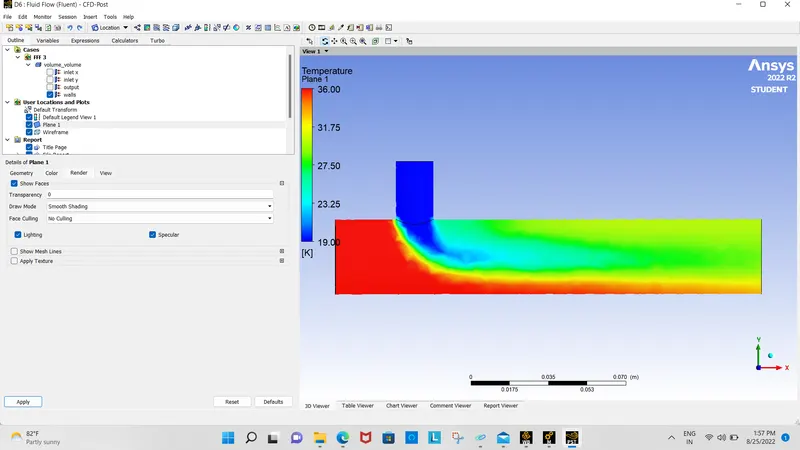
Temperature:
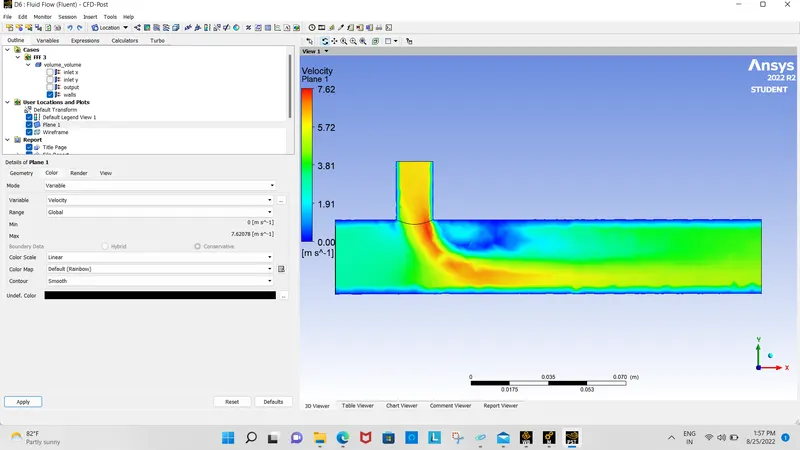
Velocity:
[For Moment ratio 2 and velocity is 3m/s^2 and using k-omega)
Cfd post:-
In this stage, we see the post results of the mixing tee simulation using the k-epsilon turbulence model and to make a plane along the XY axis to see the contour plots clearly.
The momentum ratio is 2.
Inlet velocity(x)=3m/s
Inlet velocity(y)=6m/s
Inlet temp(x)=36degC
Inlet temp(y)=19degC
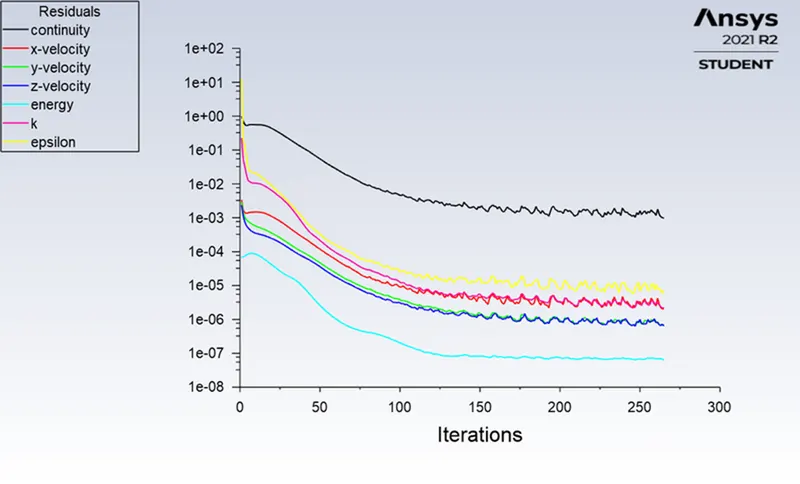
Residual plot:-
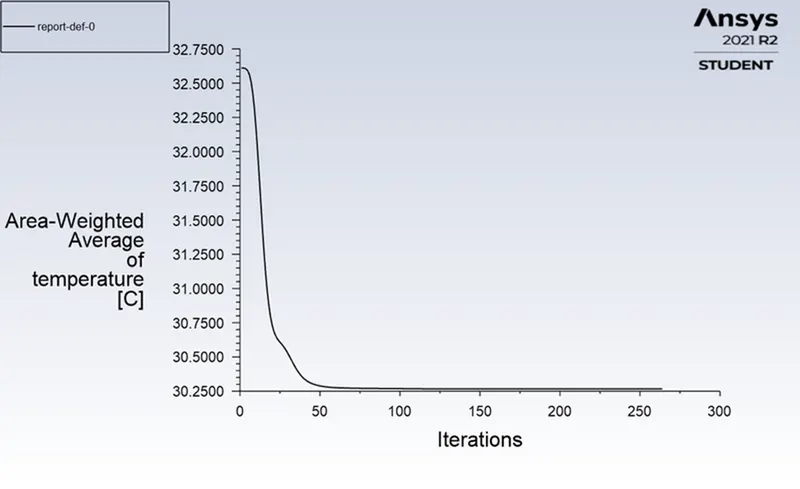
Temperature plot: -
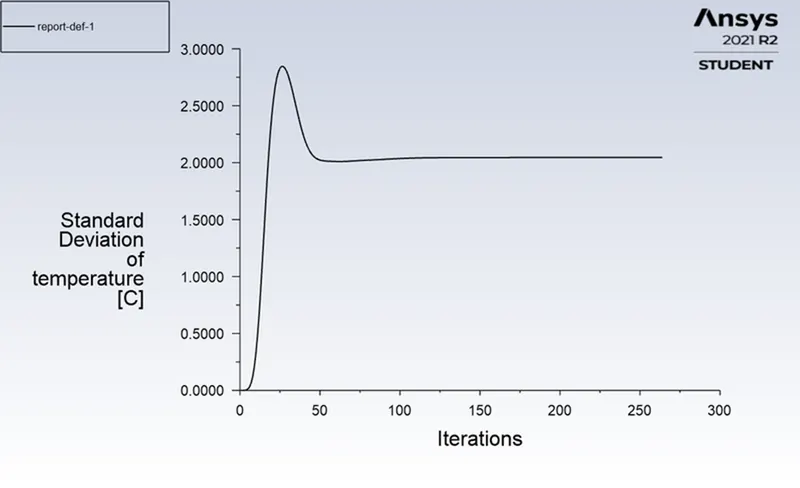
Standard deviation plot:-
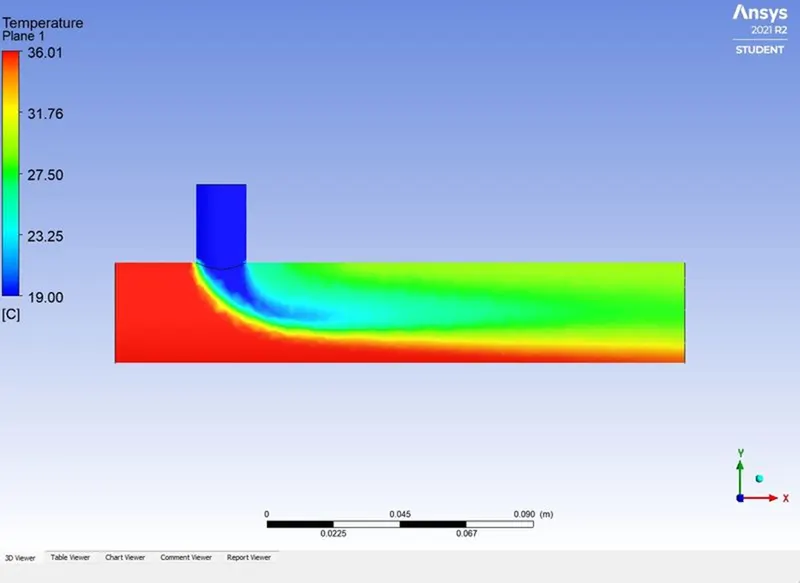
Temperature contour plot:-
Velocity contour plot:-
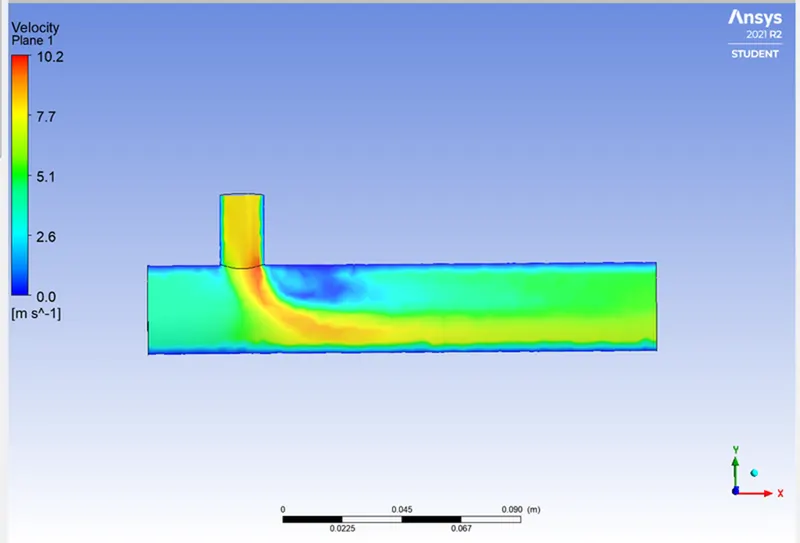
The above contour plots are showing the diffusion of temperature and velocity with respect to the mesh size and momentum ratio value. A number of elements in the 104716, solution are converged at the 150th iteration. Area weighted average=30.26659degC & Standard deviation=2.045488degC.
Case 1:-
mesh size 5mm
short.tee with momentum ration 2 & inlet-x velocity 3m/s.
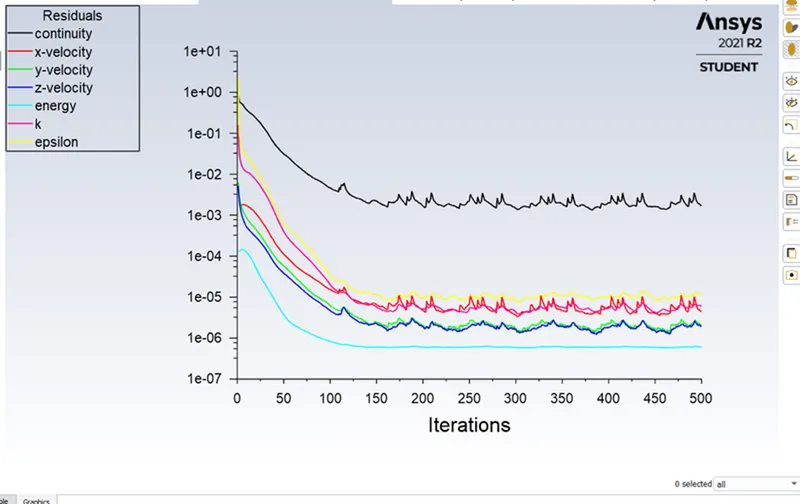
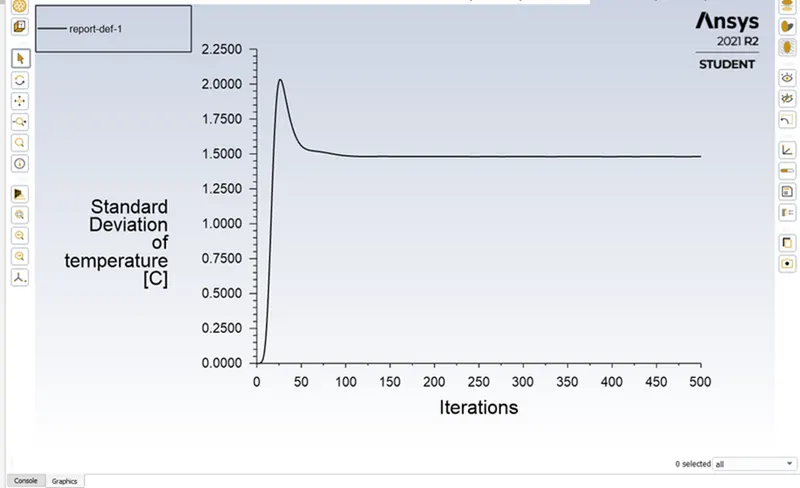
Residual plot: -
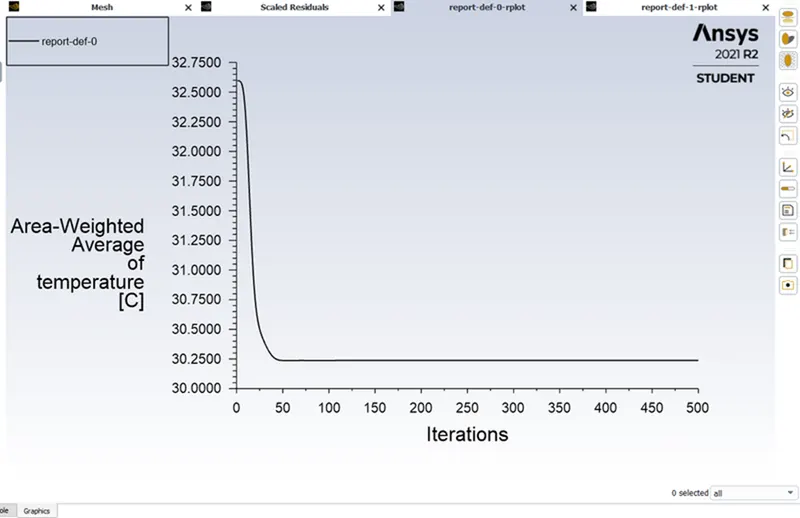
Area weighted avg plot:-
Standard deviation plot:-
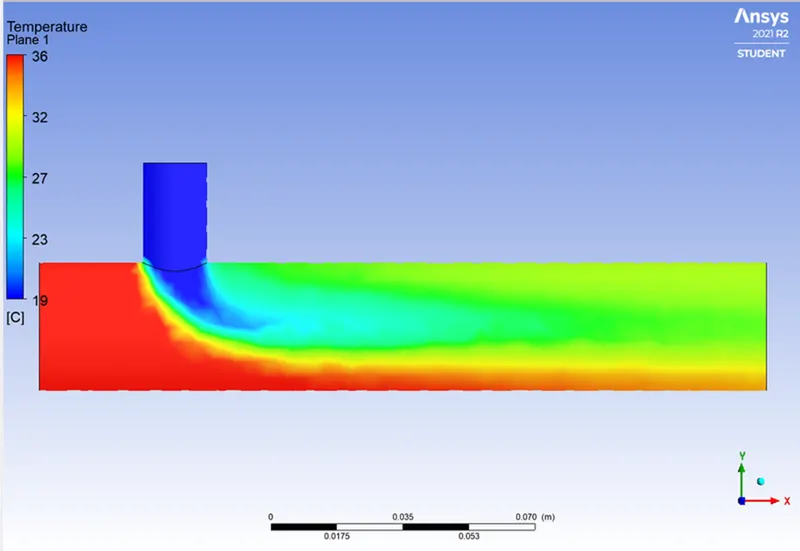
Temperature contour plot: -
Velocity contour plot: -
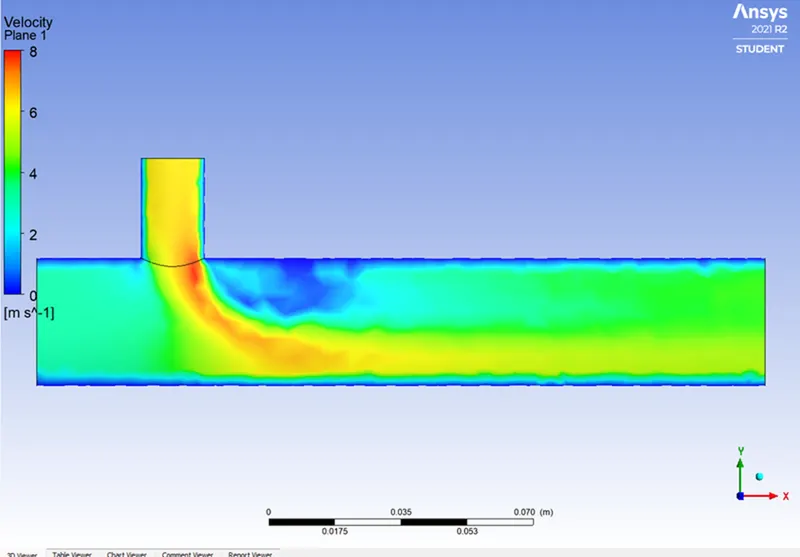
from the above plots, the cell count is 14166 and solution is converged at 250th iteration.
Average weighted avg temperature- 30.238097degC
Standard deviation temperature-1.480737degC
While comparing the above solution this shows the lower deviation in temperture.
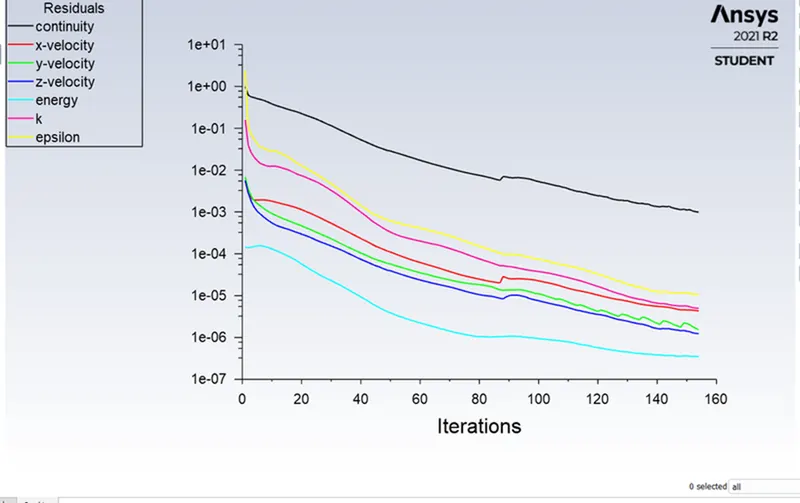
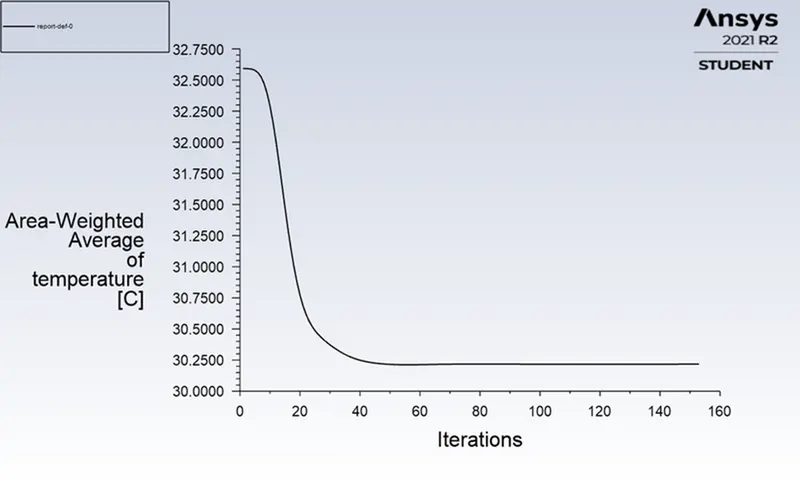
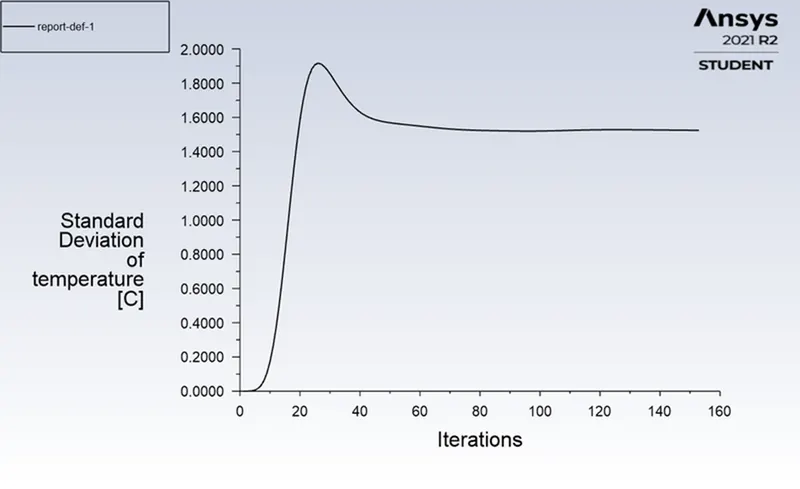
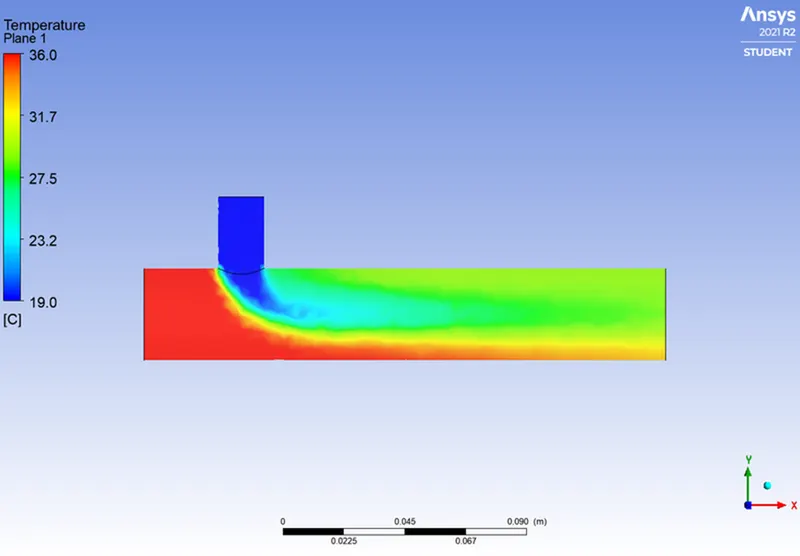
Mesh size 8mm:-
short tee with momentum ratio 2& inlet-x 3m/s
Residual plot:-
Area weighted average plot:-
Standard deviation plot: -
Temperature contour plot: -
Velocity contour plot:-
from the above plots the cell count is 14166 and solution is converged at 158th iteration.
Average weighted avg temperature- 30.21733 degC
Standard deviation temperature-1.524048degC
While comparing the above solution this shows the higher deviation in temperture.
From comparing the above three cases with three different element size using k-epsilon turbulence model the 5mm element size shows the lower standard deviation temperatures.
Case 1 :-
Short tee with mometum ration 4
inlet-x will be 3m/s
inlet-y will be 12m/s
Mesh size default(10.219mm)
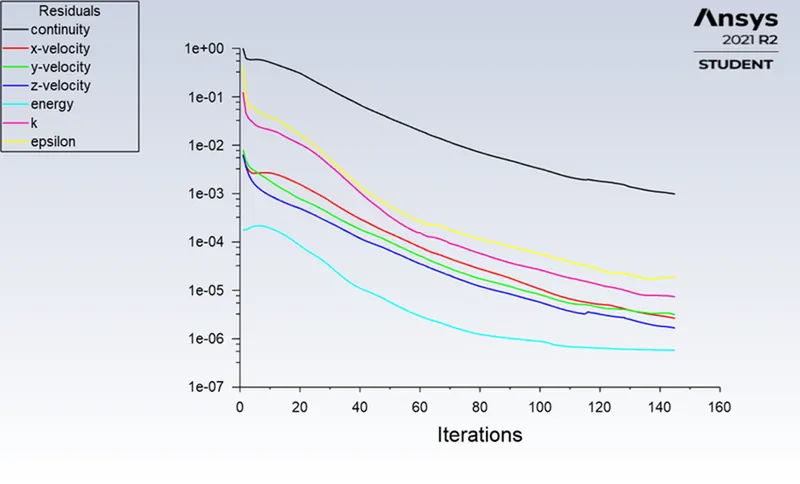
Residual plot: -
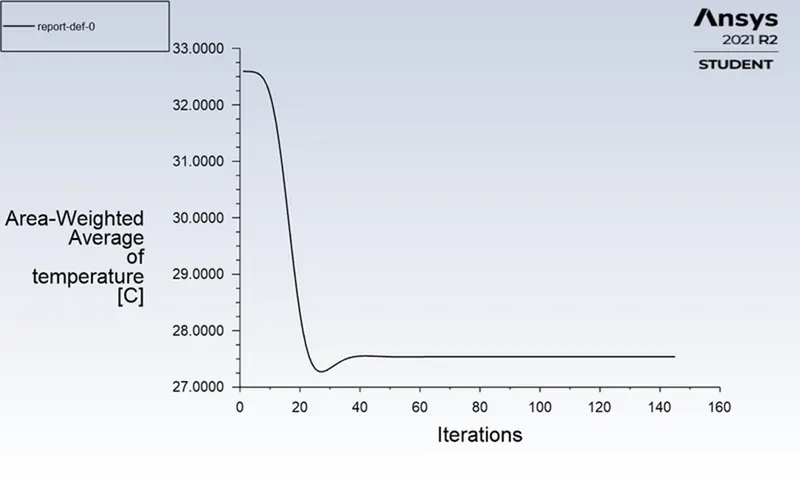
Area weighted average plot: -
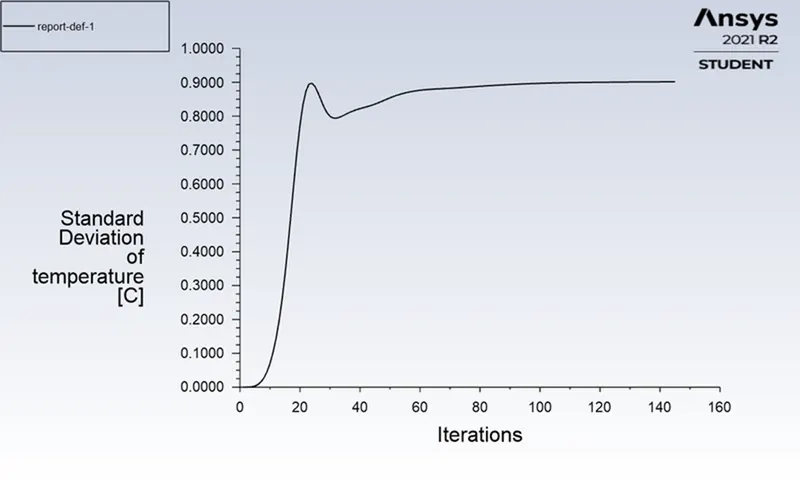
Standard deviation plot: -
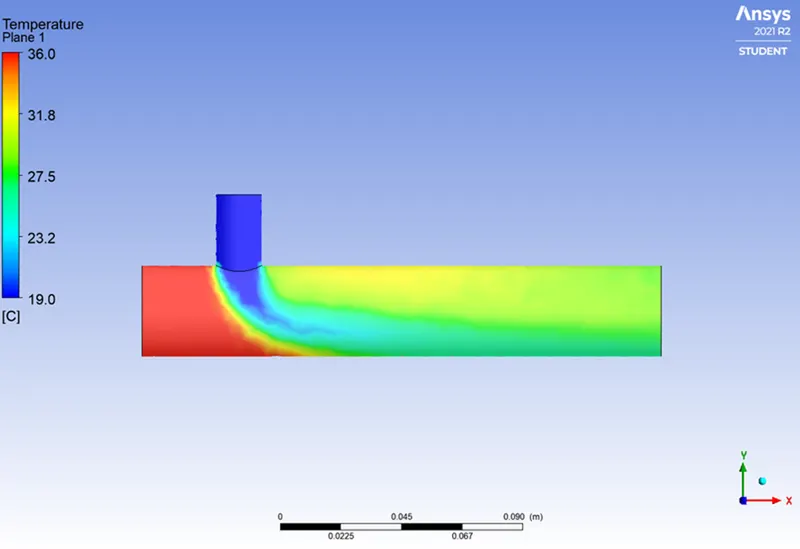
Temperature contour plot:-
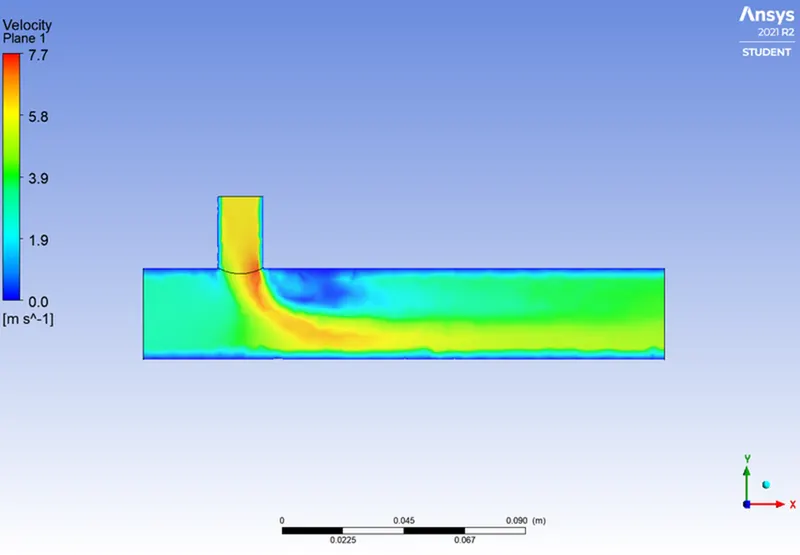
Velocity contour plot: -
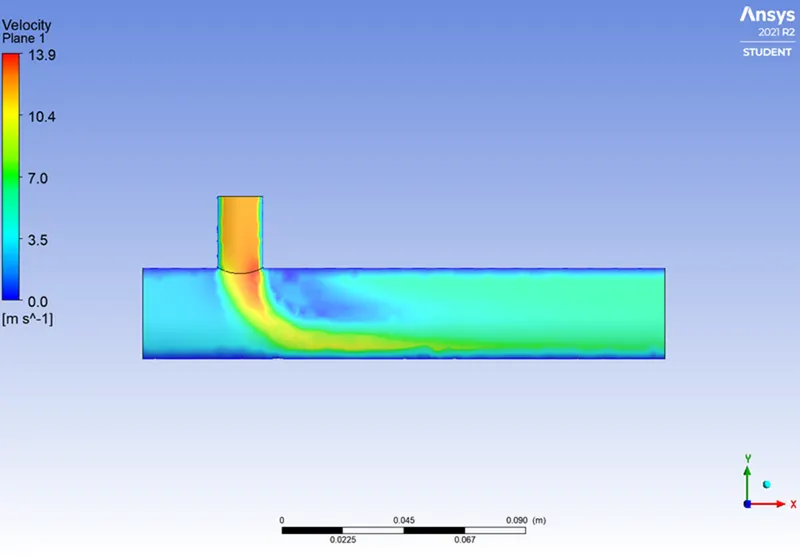
For this mixing tee simulation of momentum ratio 4. Here we used the k-epsilon method.
the cell count is 12444, the solution is converged at the 145th iteration.
Standard deviation- 0.901348degC
Average weighted average-27.53962degC
Case 2:-
Long. tee with momentum ration 2
inlet-x will be 3m/s
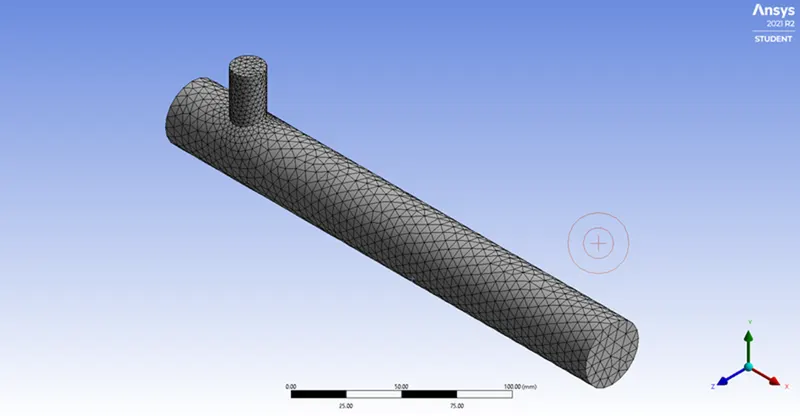
Mesh:-
mesh size default (13.583mm)
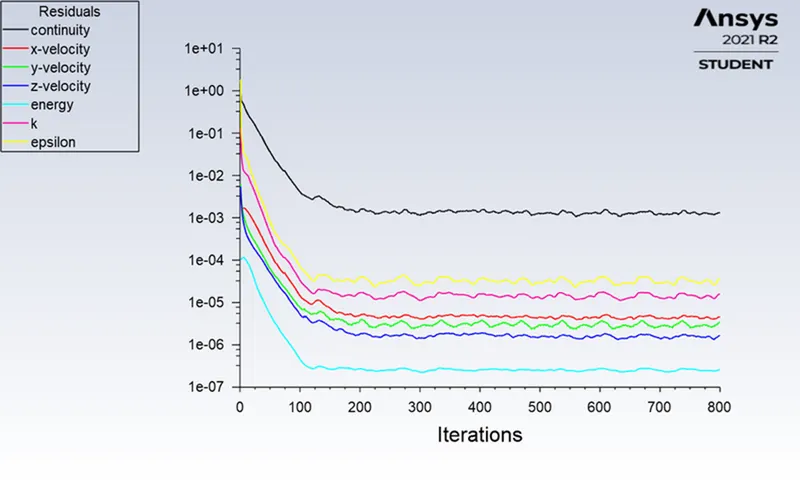
Residual plot:-
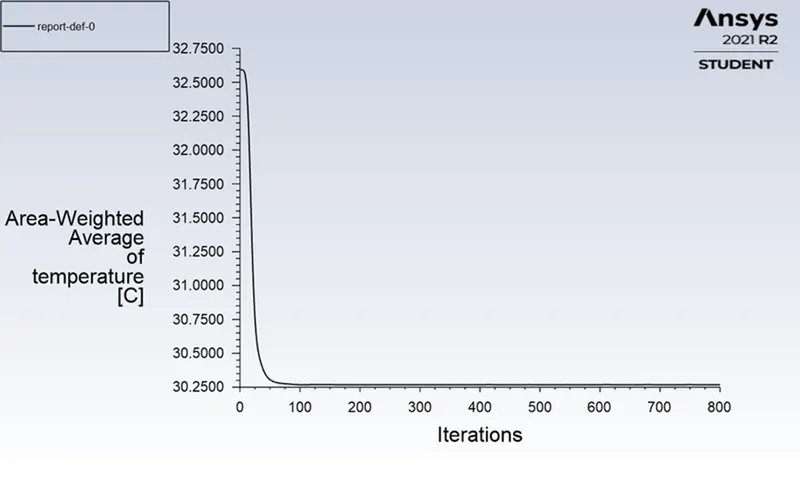
Area weighted average plot:-
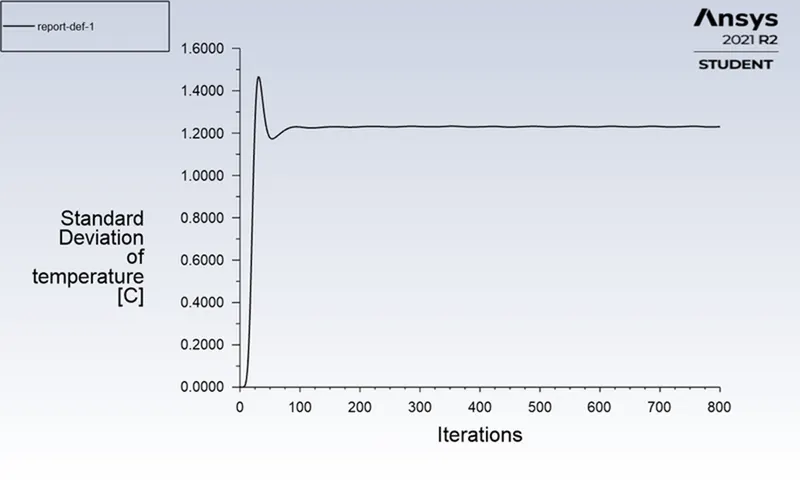
Standard deviation plot:-
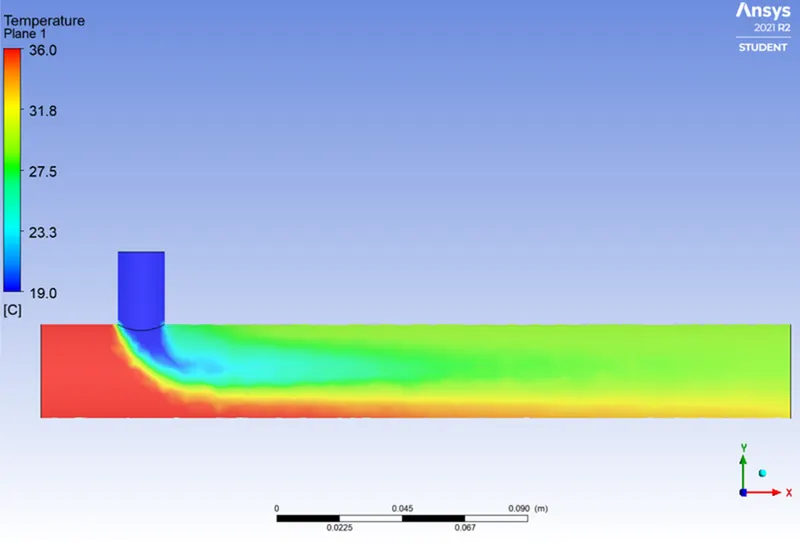
Temperature contour plot:-
Velocity contour plot: -
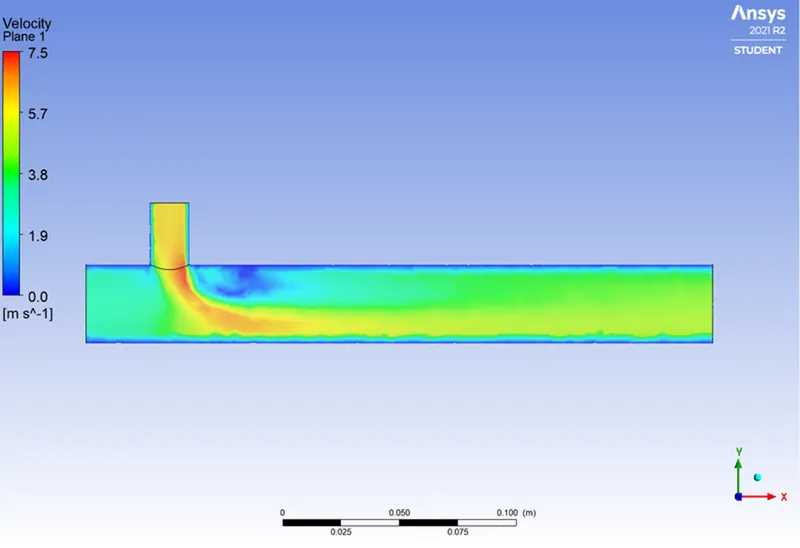
From the above Simulation of long. tee using k-epsilon turbulence model the total cell is 15566 and solution converged at 230th iteration, area-weighted average- 30.26818degC, Standard deviation temperature- 1.230068degC.
Case 2:-
Long tee with momentum ratio of 4
inlet-x velocity is 3m/s
Mesh:-
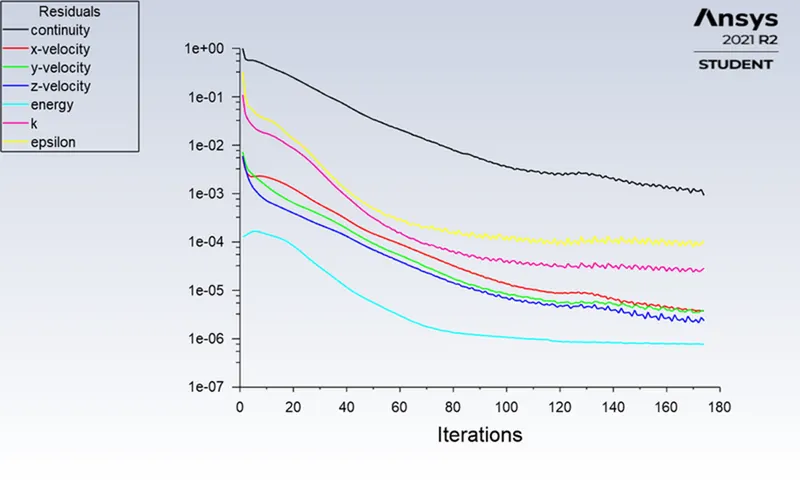
Residual plot: -
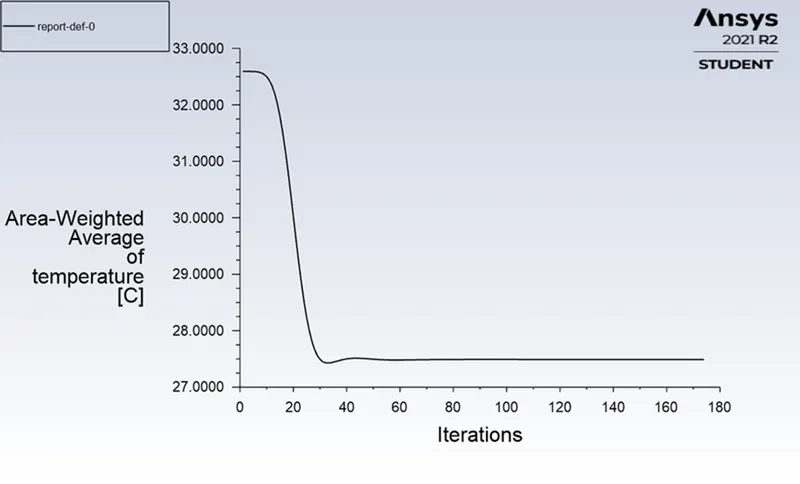
Area weighted average plot: -
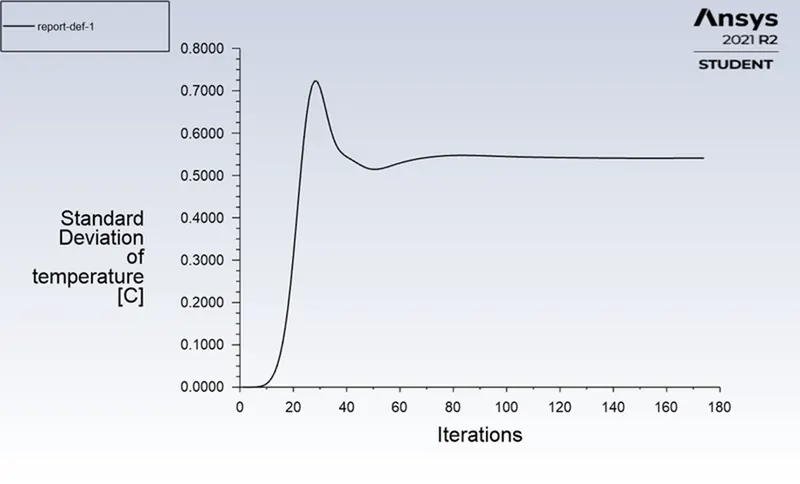
Standard deviation plot:-
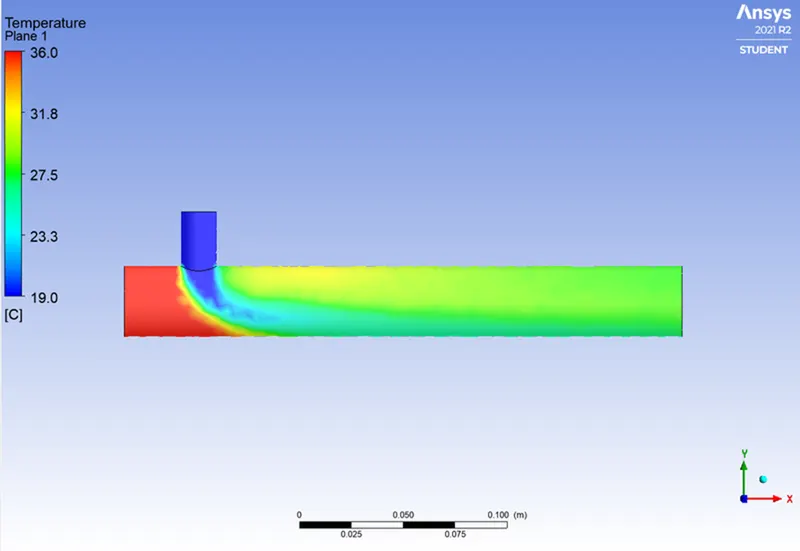
Temperature contour plot: -
Velocity contour plot: -
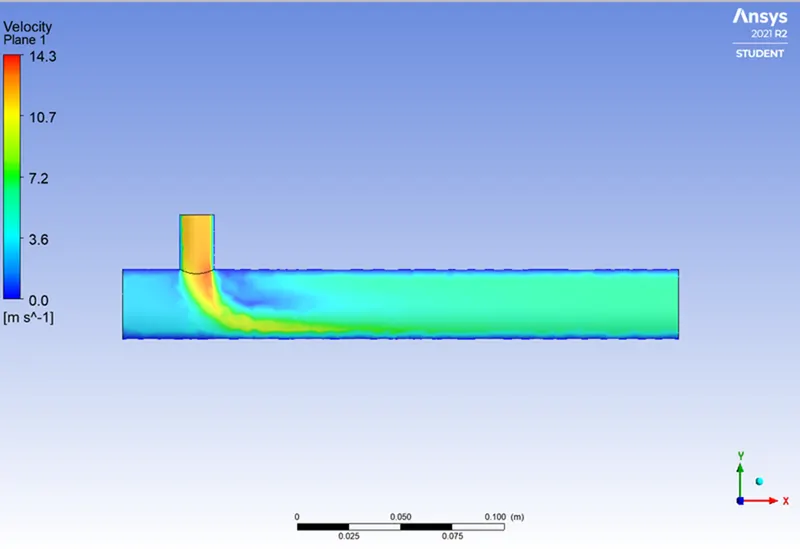
For the above simulation of long. tee with momentum ratio 4, using the k-epsilon turbulence model.
total cell count is 15566
mesh size is default-13.853mm
solution converged at the 174th iteration
Area weighted average temperature- 27.49085degC
Standard deviation temperature- 0.5410328degC
Comparing all the results the long tee with momentum ratio 4 has a low standard deviation temperature.
Comparing all the cases:- \
|
o Case |
o Element size |
o Outlet temp |
o Standard deviation temp |
o Converged |
o Cell count |
|
o Short. tee |
o 2mm |
o 30.2665 |
o 2.0454 |
o 150th iteration |
o 104716 |
|
o Short. tee |
o 5mm |
o 30.2381 |
o 1.4807 |
o 250th iteration |
o 14166 |
|
o Short. tee |
o 8mm |
o 30.2173 |
o 1.5240 |
o 158th iteration |
o 12444 |
|
o Short. tee |
o default(10.219mm) |
o 27.5396 |
o 0.9013 |
o 140th iteration |
o 12444 |
|
o, Long. tee |
o default(13.853mm) |
o 30.2681 |
o 1.2300 |
o 230th iteration |
o 15566 |
|
o, Long. tee |
o default(13.853mm) |
o 27.5396 |
o 0.5410 |
o 145th iteration |
o 15566 |
CONCLUSION:
- The resultant average temperature for both turbulence models Realizable K -Epsilon & K omega SST looks similar, but computing K omega SST takes more time and more number of iterations for convergence.
- For both cases momentum ratios of 4, the outlet temperature drops significantly this occurs because of very high cold velocity air. So this clearly shows higher the momentum ratio greater the efficiency of the mixing.
- We are getting an almost similar result for short tee & long tee for the momentum ratio of 4 from this we can get to know that the length of the pipe doesn't affect the efficiency of the pipe.
- When it comes to standard deviation, the long tee gives a very lower value compared to the short tee. Indeed, we can increase high inlet cold air velocity for the application so we can get pretty good mixing in nature for a short pipe instead of using the long pipe.
- If we increase velocity will get better turbulent mixing. majority of the mixing is because of higher velocity and as we go along the length of the pipe there is additional mixing that occurs because of diffusion.
- And there is not much difference in the analytical outlet temperature and numerical outlet temperature
- Overall, the short tee pipe gives a pretty good result, and also it saves material costs. Increasing the pipe length doesn't create any difference in the outlet temperature.