Week 1- Mixing Tee
Aim: To simulate air flow through a short mixing tee and a long mixing tee using two different turbulence models.
Theory: A mixing tee is a T structure that consists of two inlets and one outlet. It used to mix two different incoming flows from the inlets and let out the resulting mixture through the outlet.
Importance: Mixing tees are used widely in industries where two or more fluids require to be mixed for various further applications. This can include processes like air conditioning and so on.
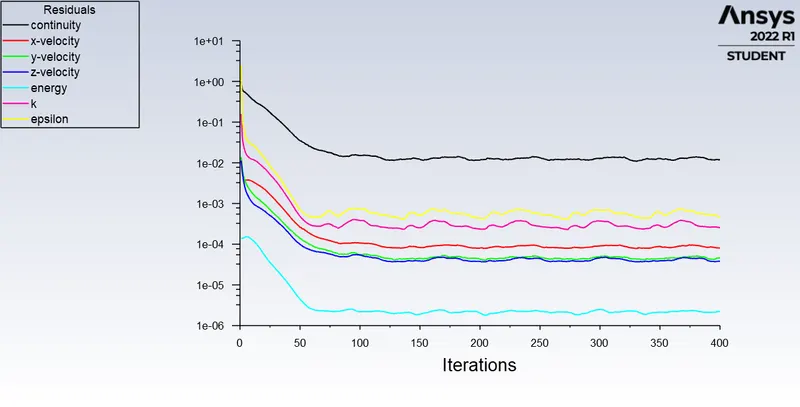
Solving and modelling: The `k-epsilon` realizable and `k-omega` SST turbulence models would be used. The energy equation would also be enabled for temperature calculations. The pressure-based solver would be used and the analysis would be steady state. The standard deviation and the area weighted average of temperature at the outlet would be monitored during the solving process. An absolute criterion of `10^-3` would be set for the scaled residuals of continuity, `u`, `v`, `w`, `k` and `epsilon` or `omega` equations and `10^-6` for the scaled residual of energy equation.
Pre-processing: After importing the geometry, only the volume contained by air would be extracted to simplify the domain. In the meshing engine, the inlets, the walls and the outlet are created as named selections so that the boundary conditions could be applied in fluent. First order tetrahedral elements (four nodes per element) would be used for meshing the geometry.
Post-processing:
- Short tee
- Model `k-epsilon`
- Momentum ratio `2`
- Convergence plot:
- Contours
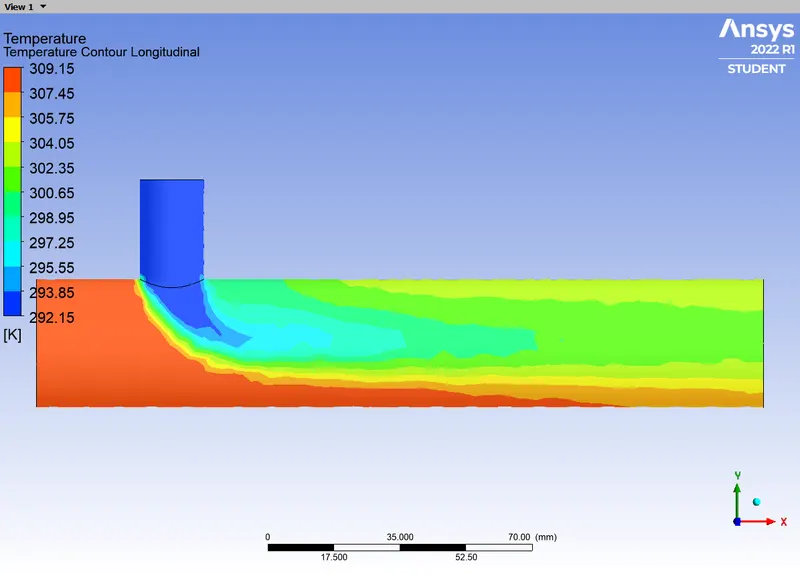
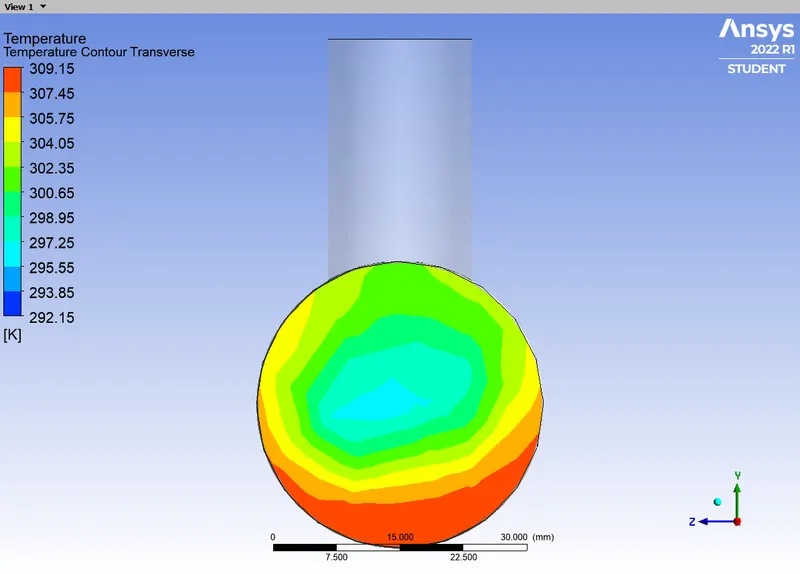
- Temperature
- Longitudinal Plane:
- Transverse Plane:
- Longitudinal Plane:
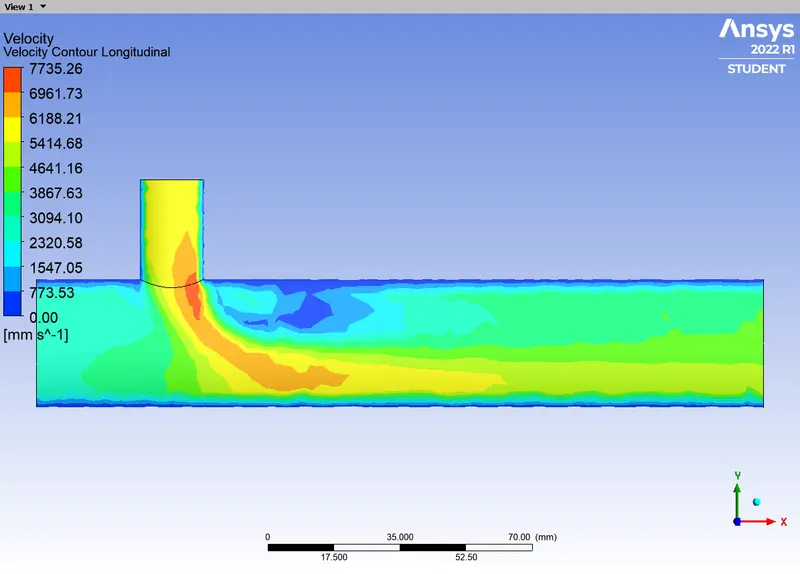
- Velocity
- Longitudinal Plane:
- Transverse Plane:
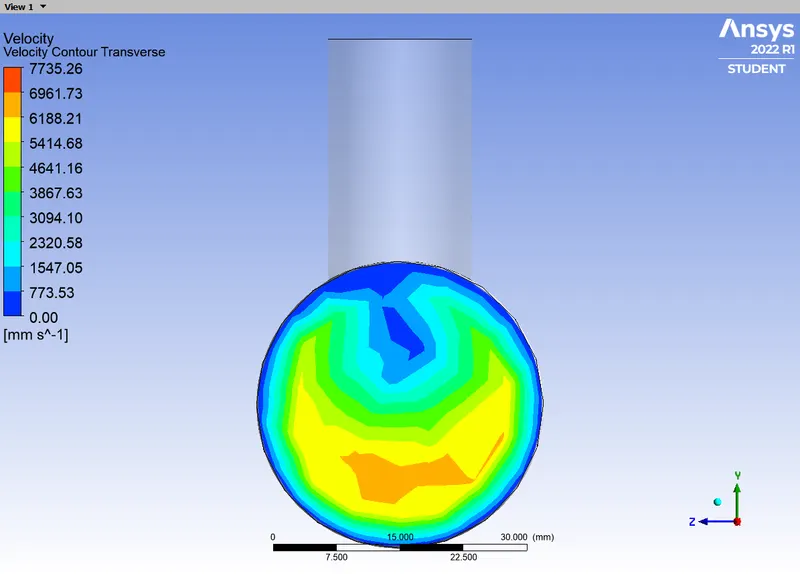
- Longitudinal Plane:
- Temperature
- Line plots
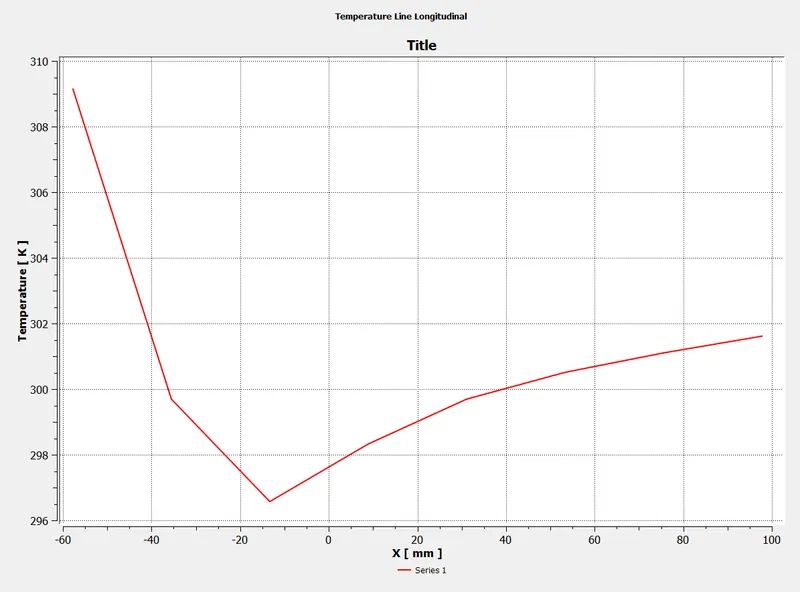
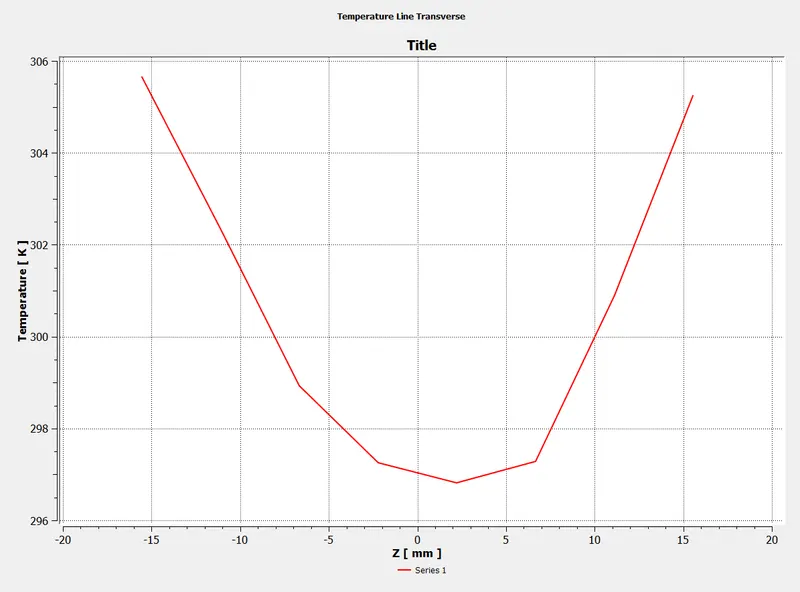
- Temperature
- Longitudinal Line:
- Transverse Line:
- Longitudinal Line:
- Velocity
- Longitudinal Line:
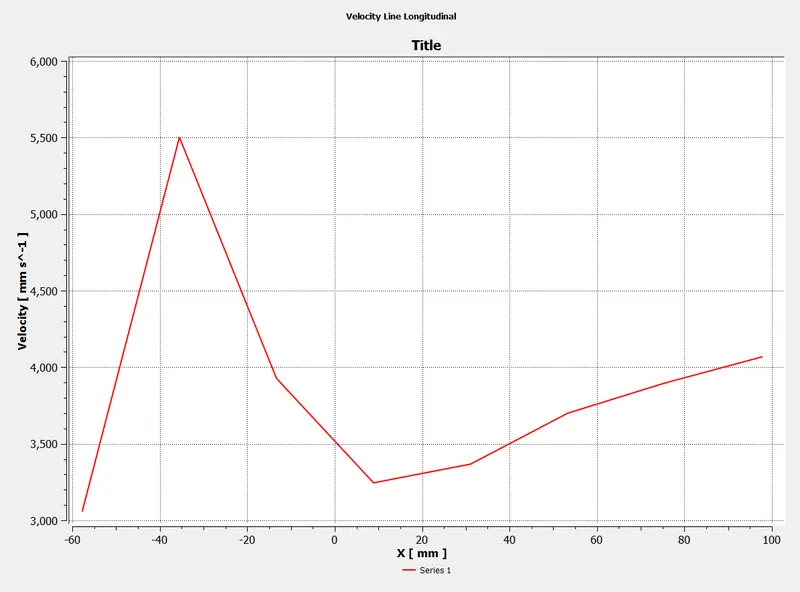
- Transverse Line:
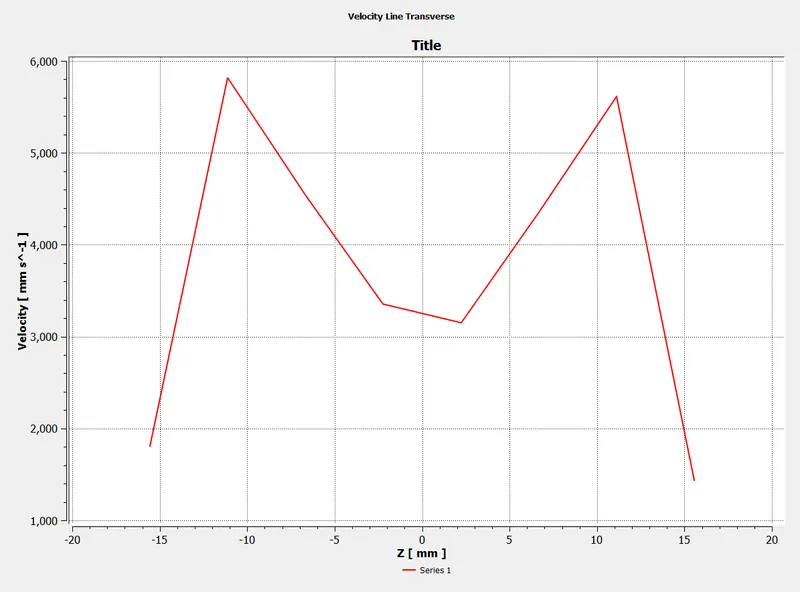
- Longitudinal Line:
- Temperature
- Convergence plot:
- Momentum ratio `4`
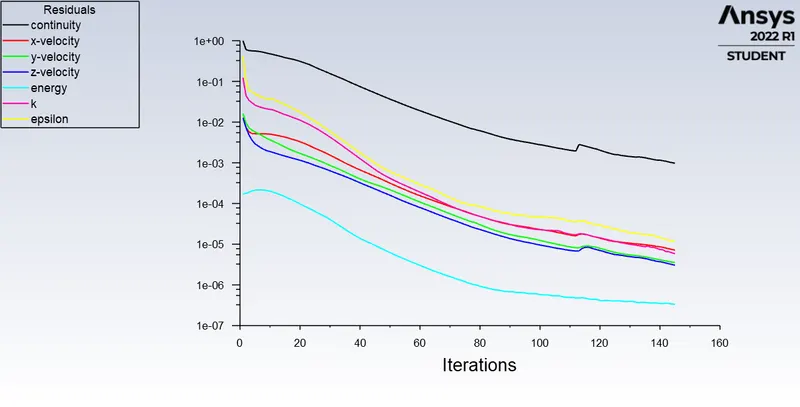
- Convergence plot:
- Contours
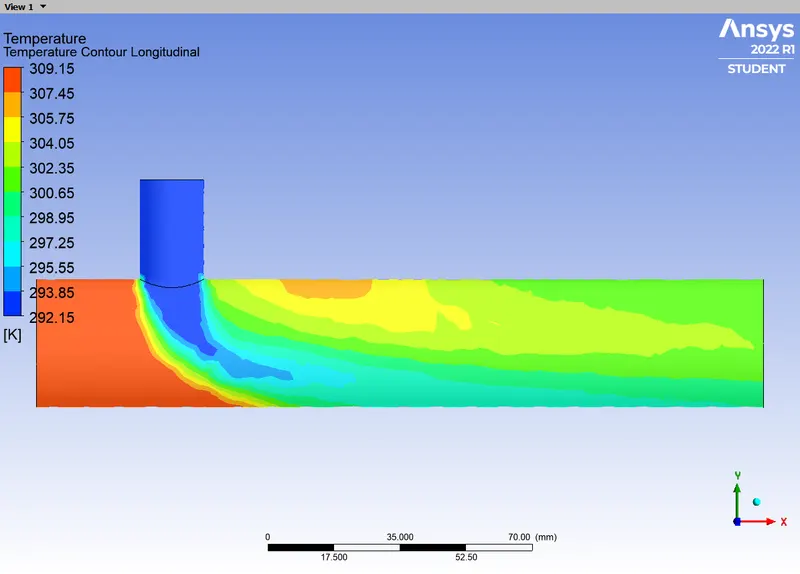
- Temperature
- Longitudinal Plane:
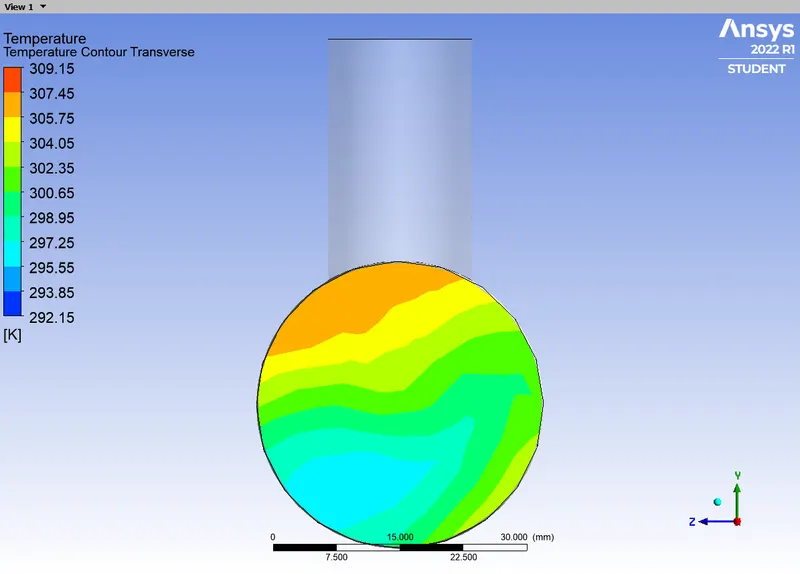
- Transverse Plane:
- Longitudinal Plane:
- Velocity
- Longitudinal Plane:
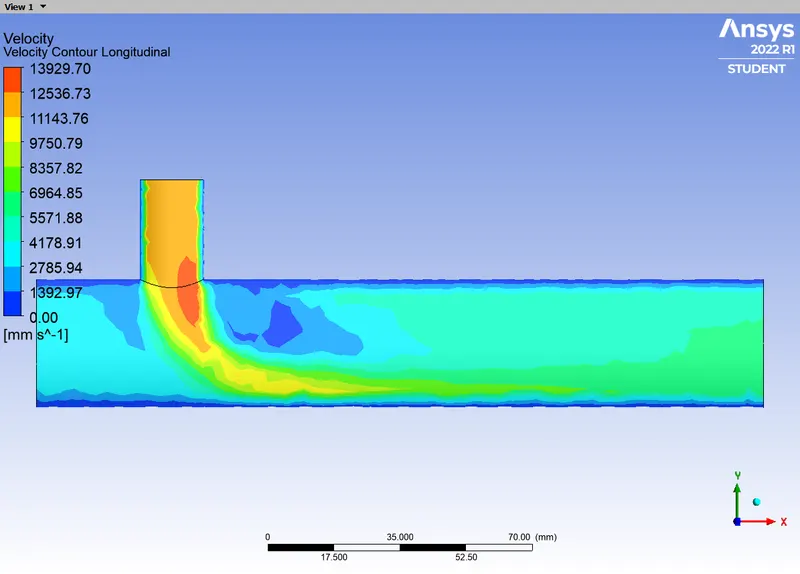
- Transverse Plane:
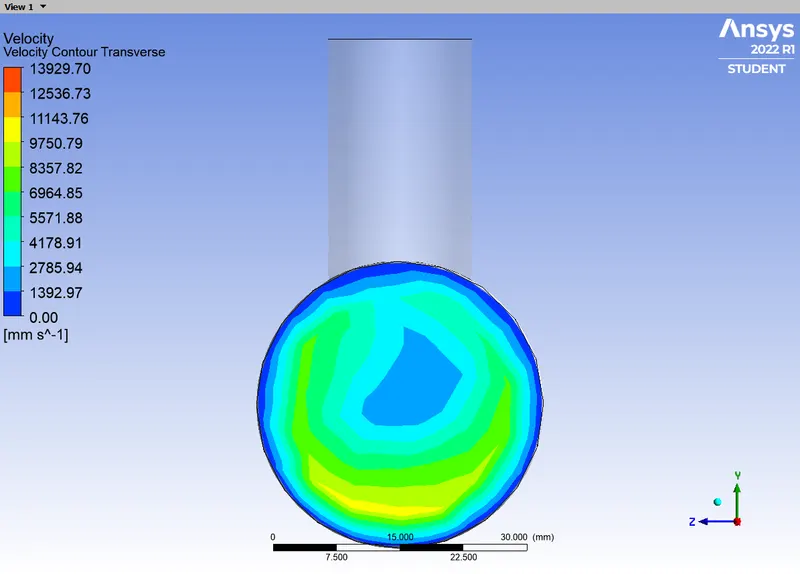
- Longitudinal Plane:
- Temperature
- Line plots
- Temperature
- Longitudinal Line:
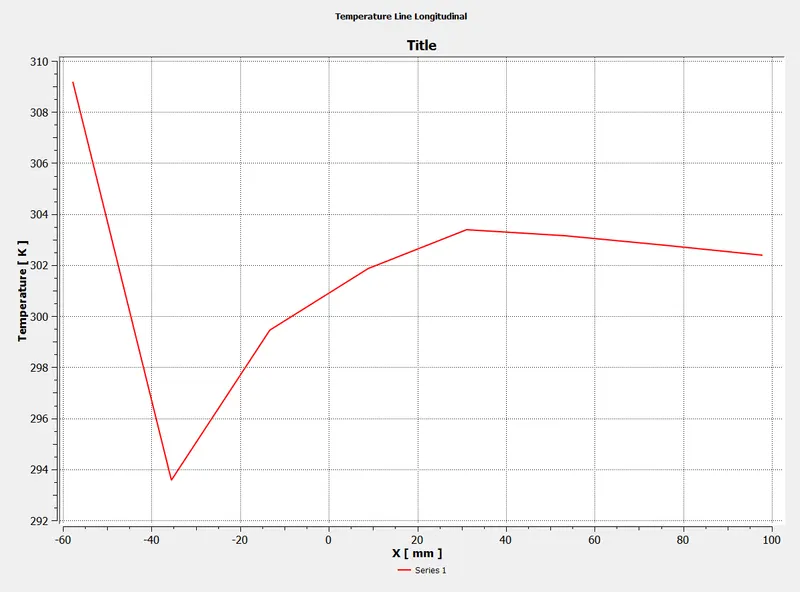
- Transverse Line:
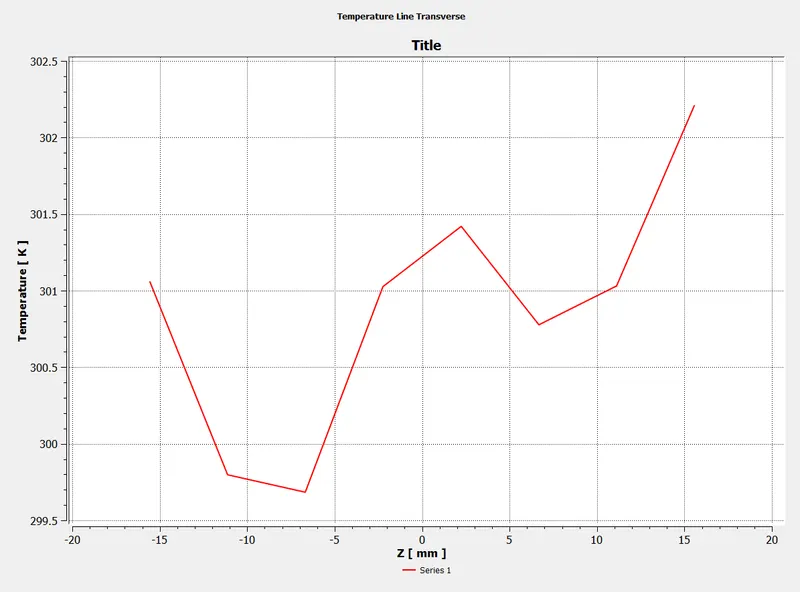
- Longitudinal Line:
- Velocity
- Longitudinal Line:
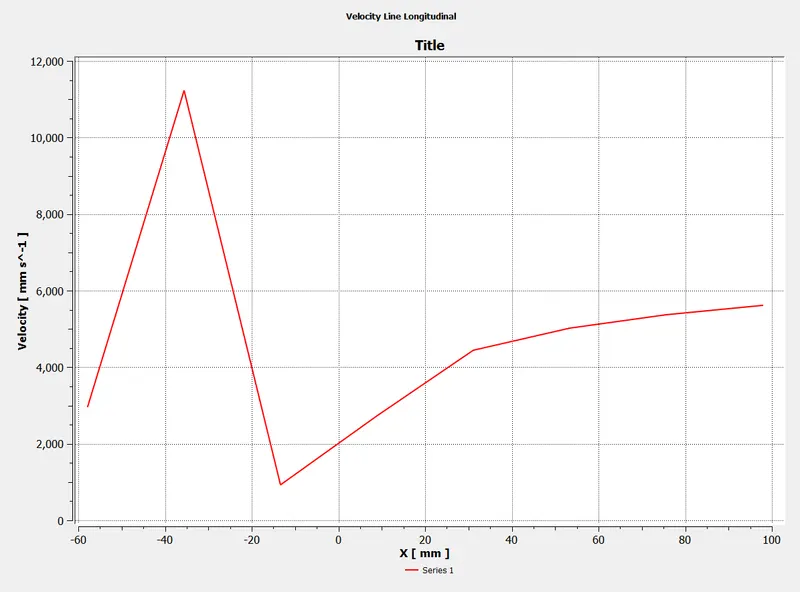
- Transverse Line:
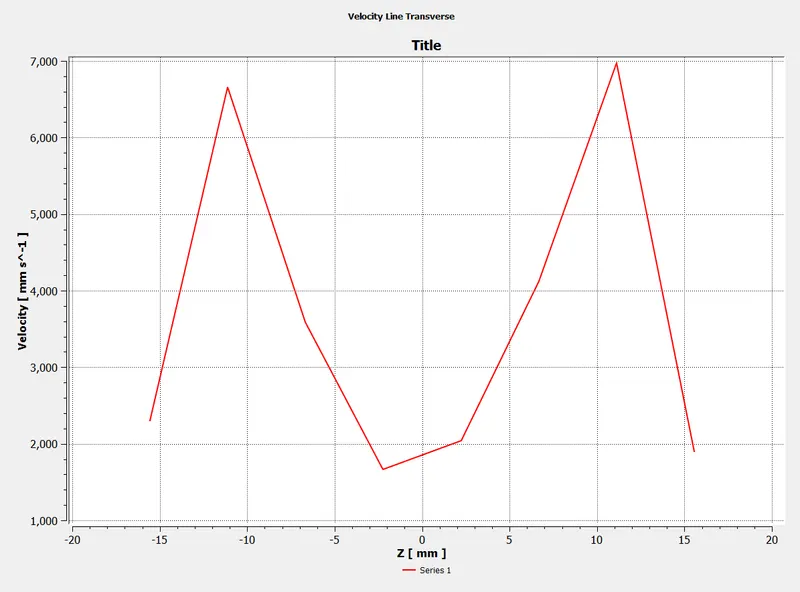
- Longitudinal Line:
- Temperature
- Convergence plot:
- Momentum ratio `2`
- Model `k-omega`
- Momentum ratio `2`
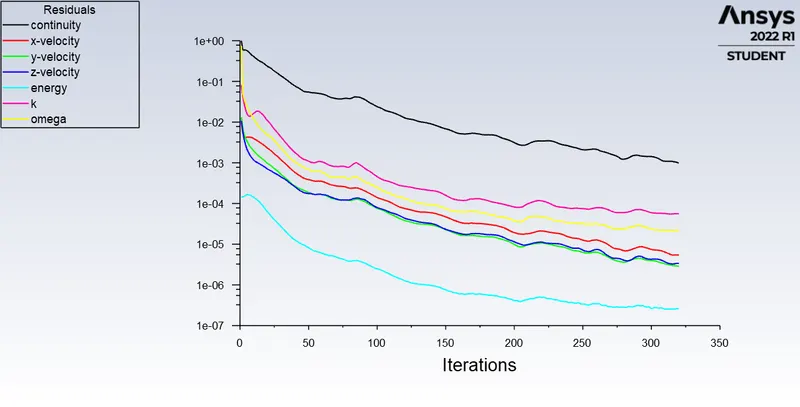
- Convergence plot:
- Contours
- Temperature
- Longitudinal Plane:
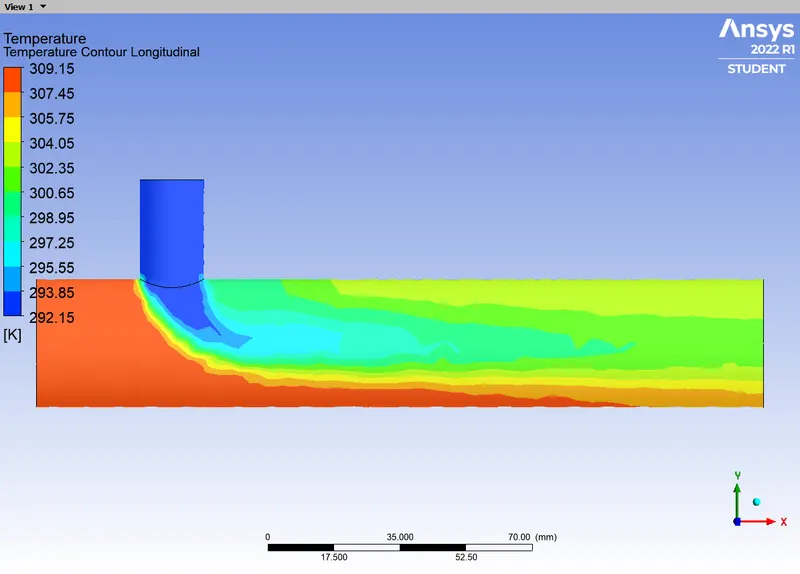
- Transverse Plane:
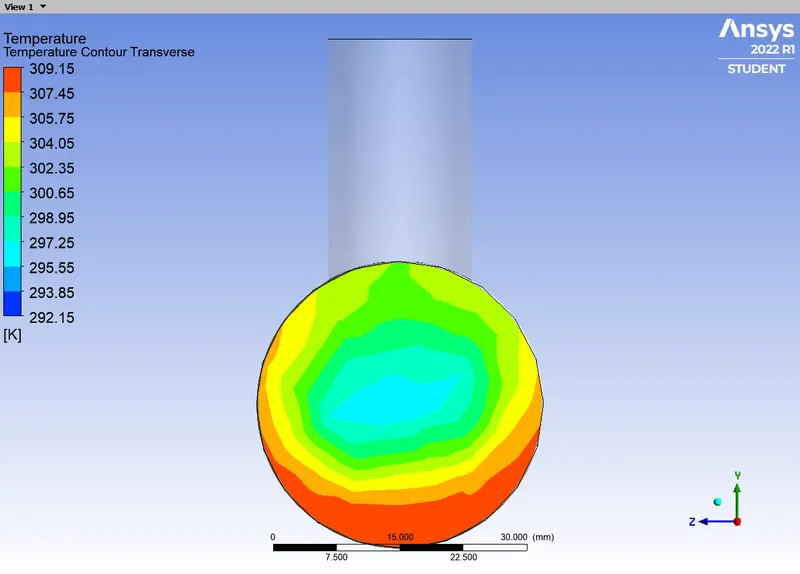
- Longitudinal Plane:
- Velocity
- Longitudinal Plane:
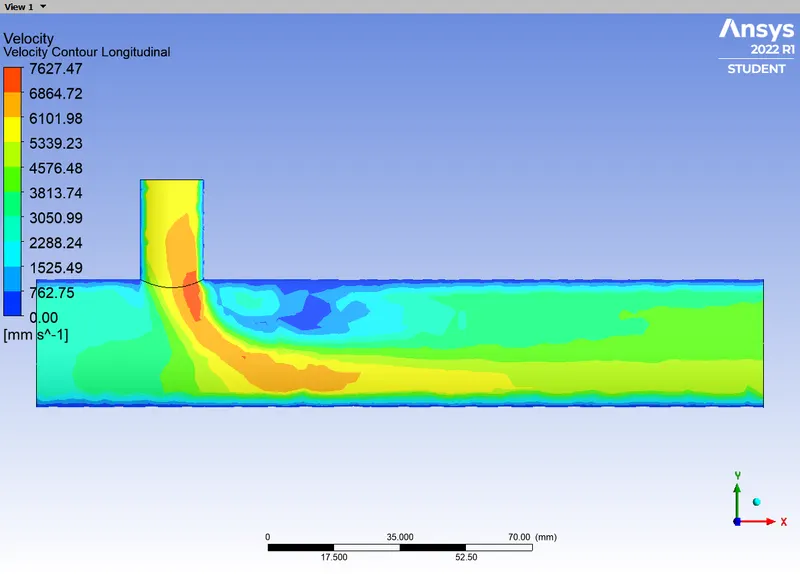
- Transverse Plane:
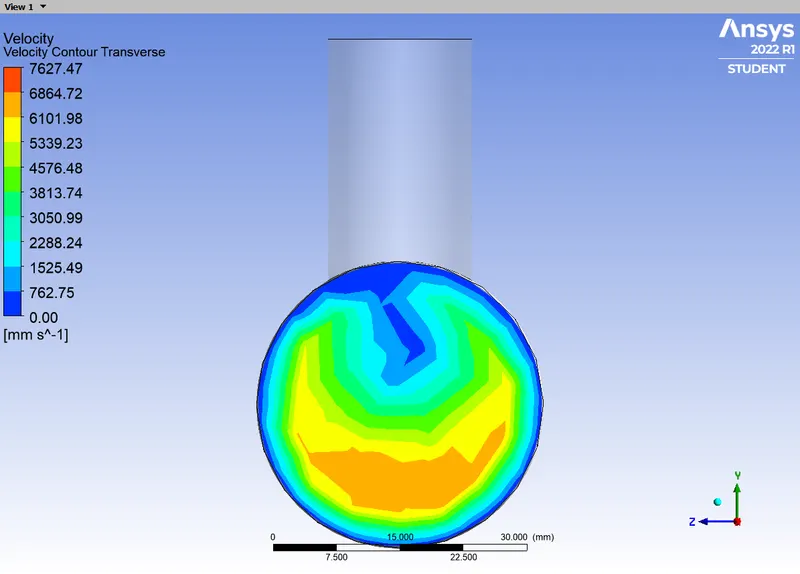
- Longitudinal Plane:
- Temperature
- Line plots
- Temperature
- Longitudinal Line:
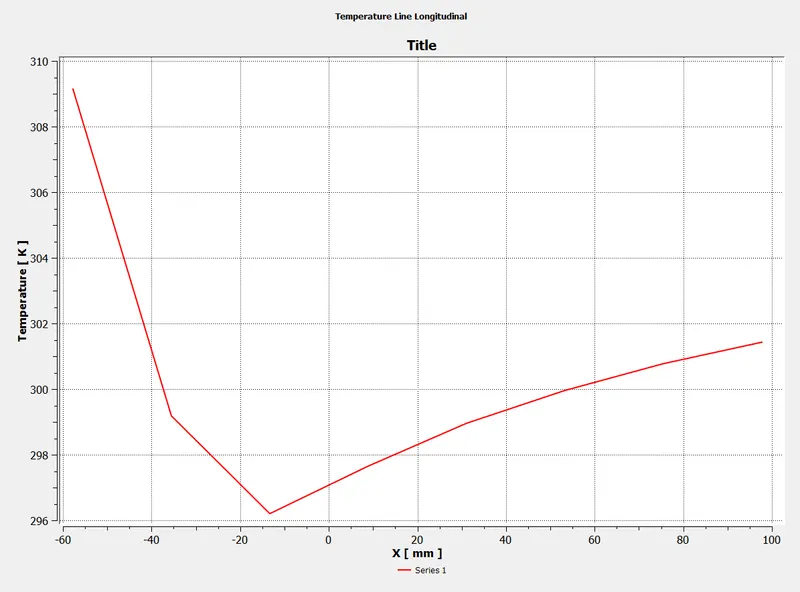
- Transverse Line:
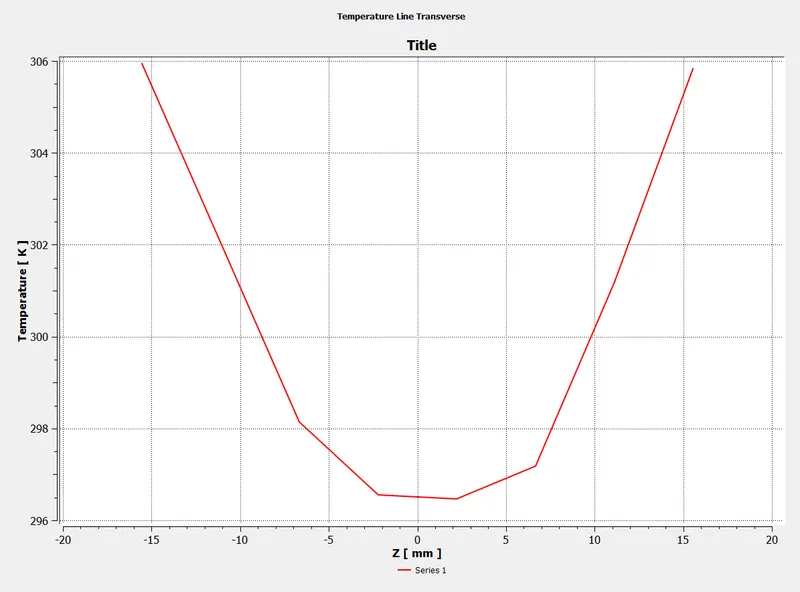
- Longitudinal Line:
- Velocity
- Longitudinal Line:
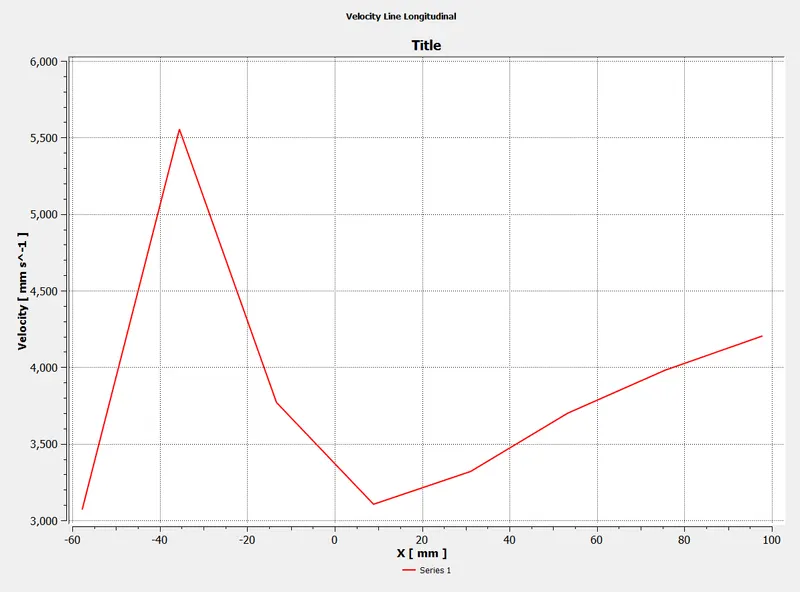
- Transverse Line:
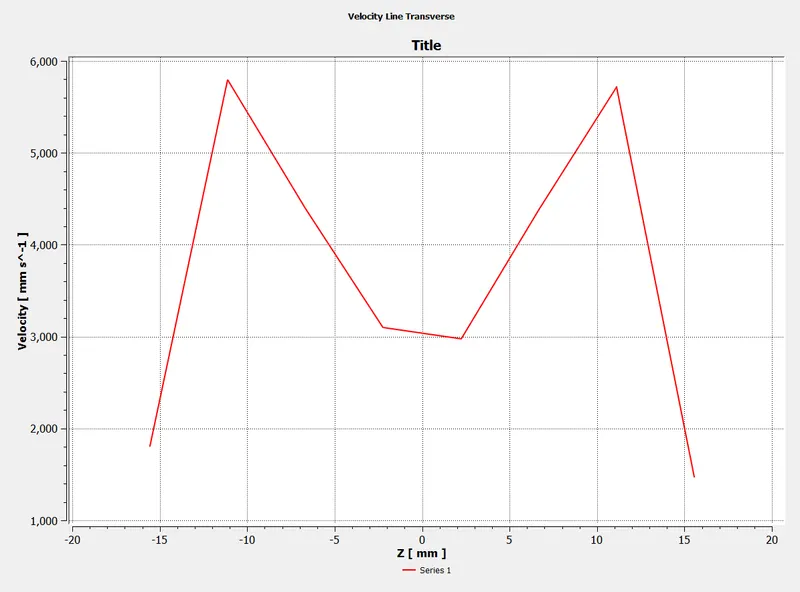
- Longitudinal Line:
- Temperature
- Convergence plot:
- Momentum ratio `4`
- Convergence plot:
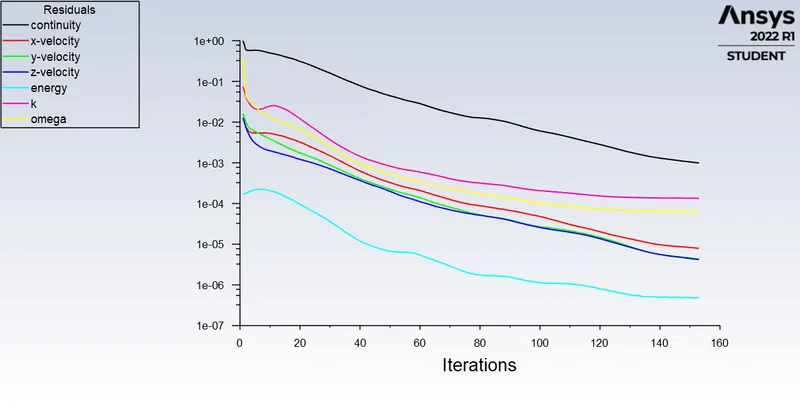
- Contours
- Temperature
- Longitudinal Plane:
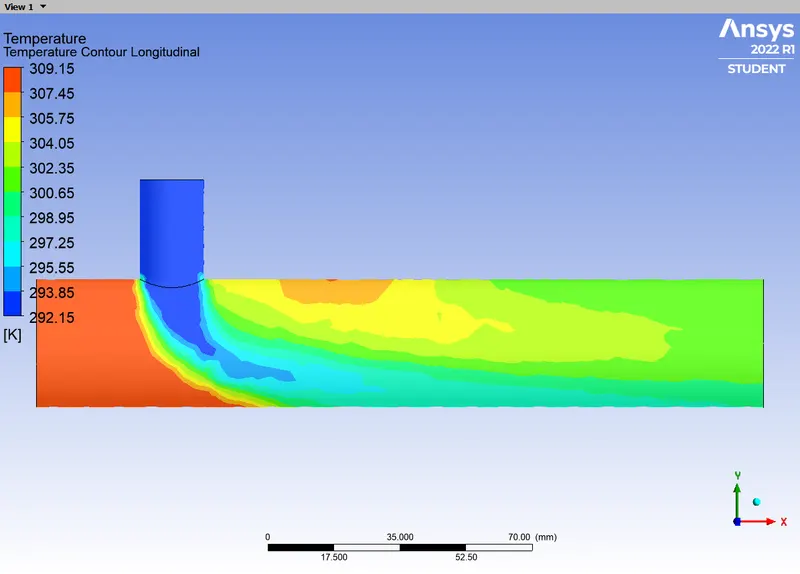
- Transverse Plane:
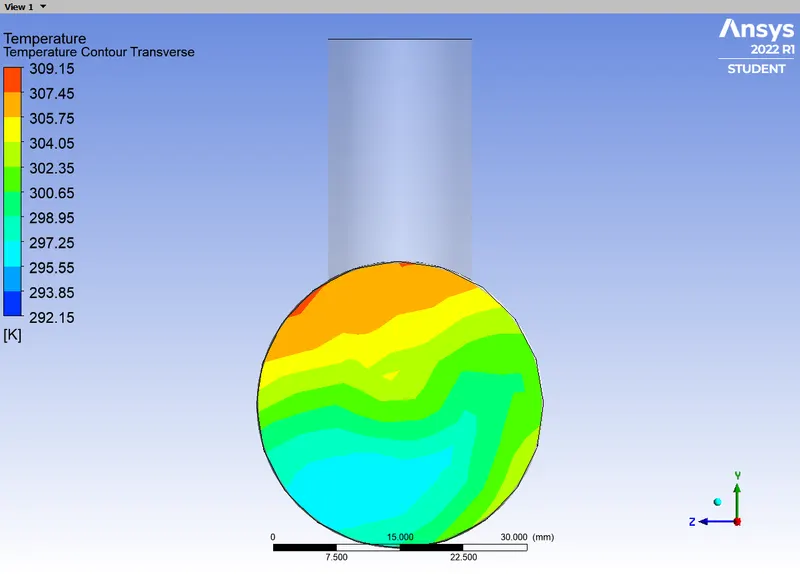
- Longitudinal Plane:
- Velocity
- Longitudinal Plane:
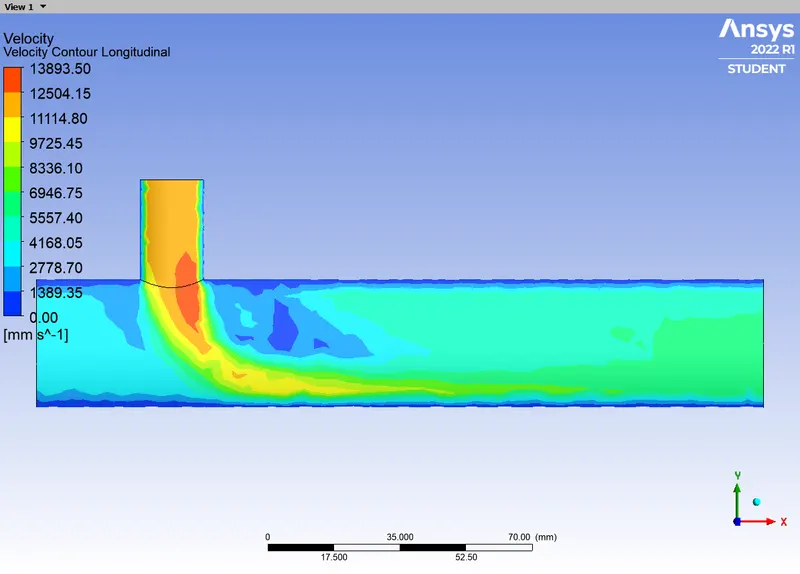
- Transverse Plane:
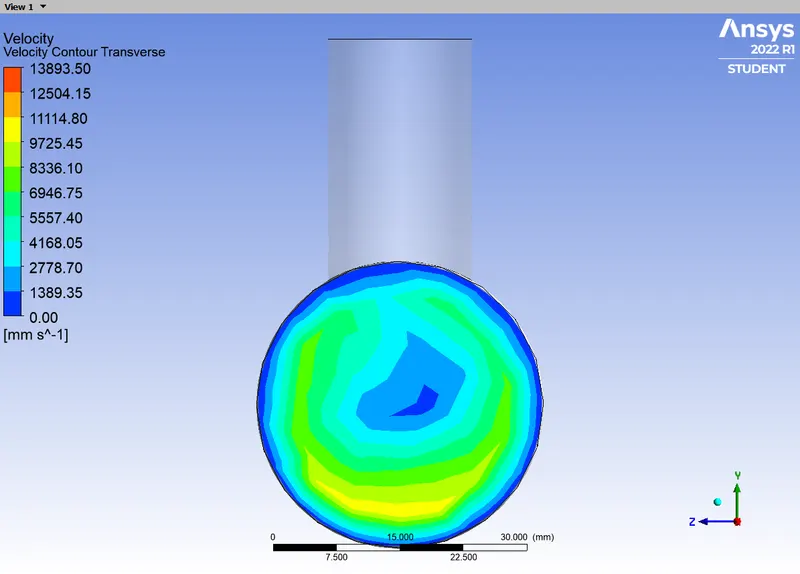
- Longitudinal Plane:
- Temperature
- Line plots
- Temperature
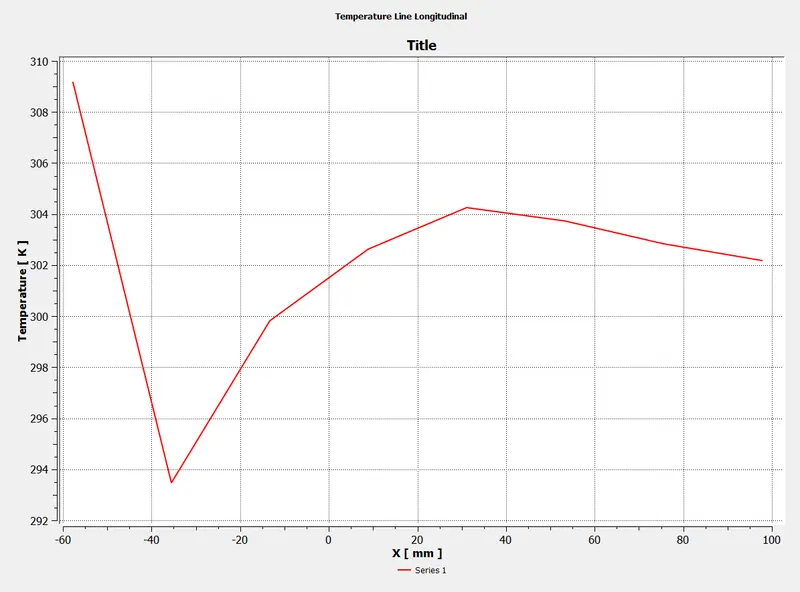
- Longitudinal Line:
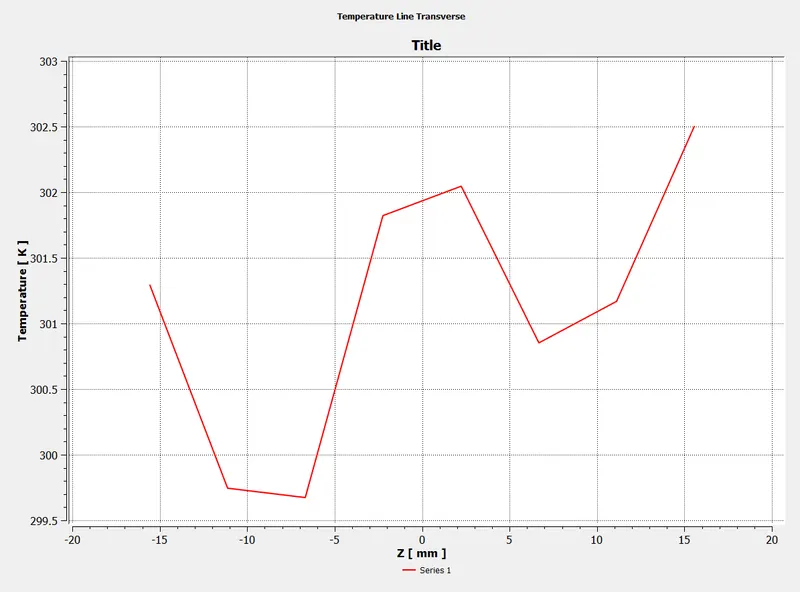
- Transverse Line:
- Longitudinal Line:
- Velocity
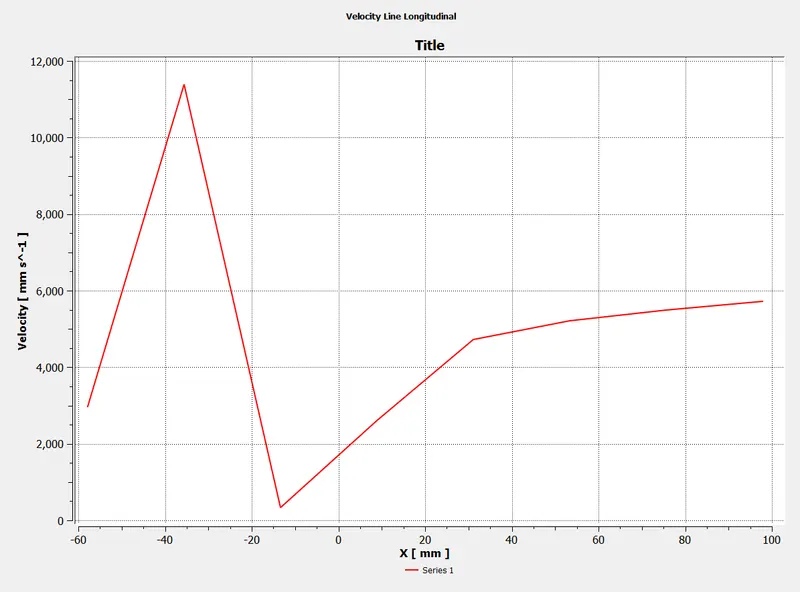
- Longitudinal Line:
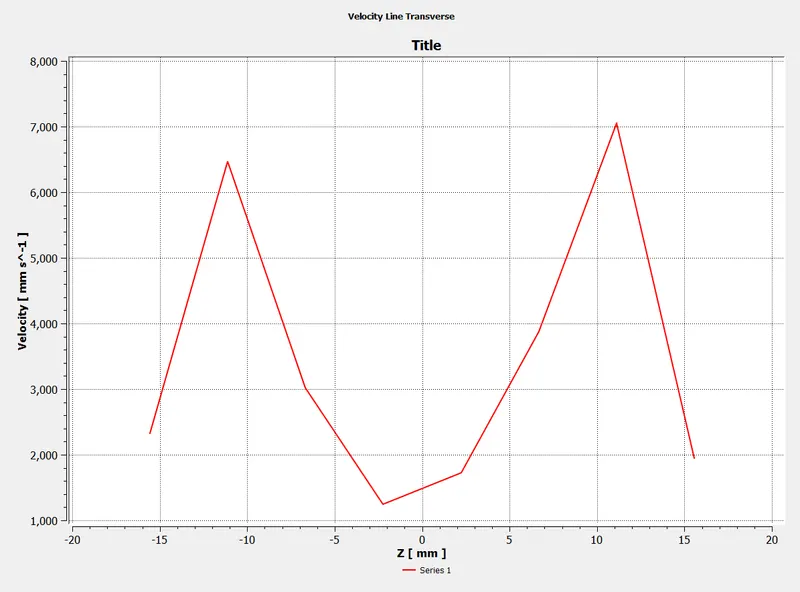
- Transverse Line:
- Longitudinal Line:
- Temperature
- Convergence plot:
- Momentum ratio `2`
- Model `k-epsilon`
- Long tee
- Model `k-epsilon`
- Momentum ratio `2`
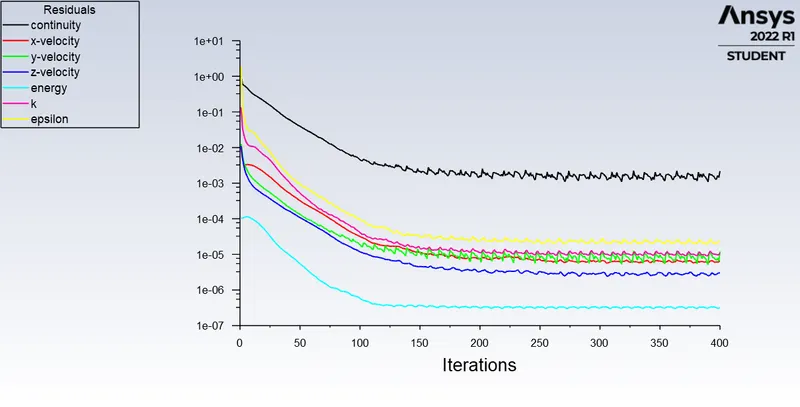
- Convergence plot:
- Contours
- Temperature
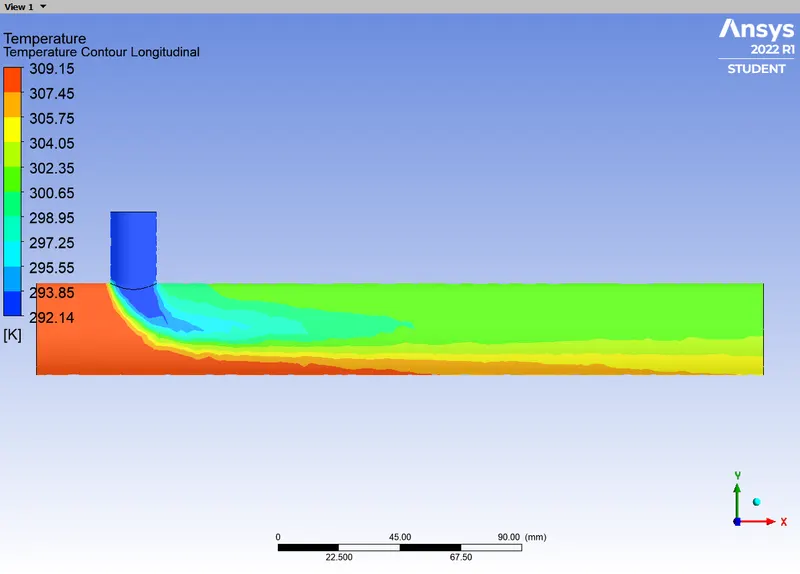
- Longitudinal Plane:
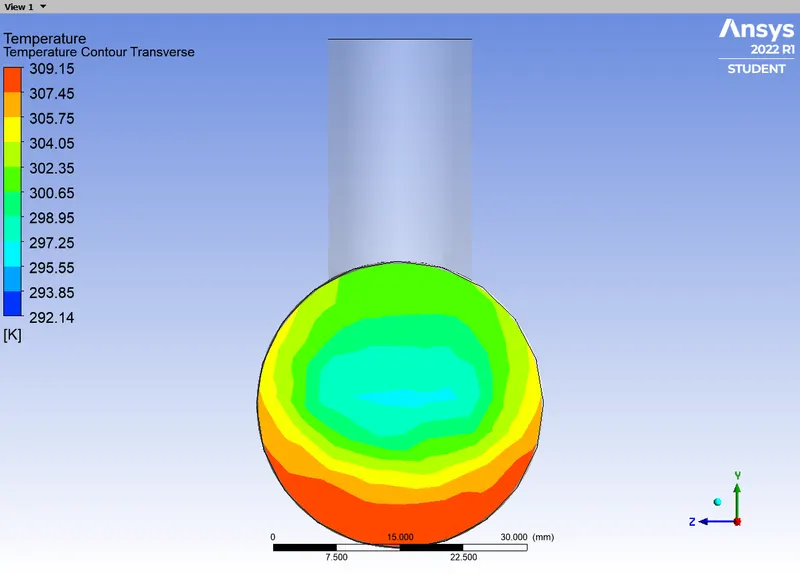
- Transverse Plane:
- Longitudinal Plane:
- Velocity
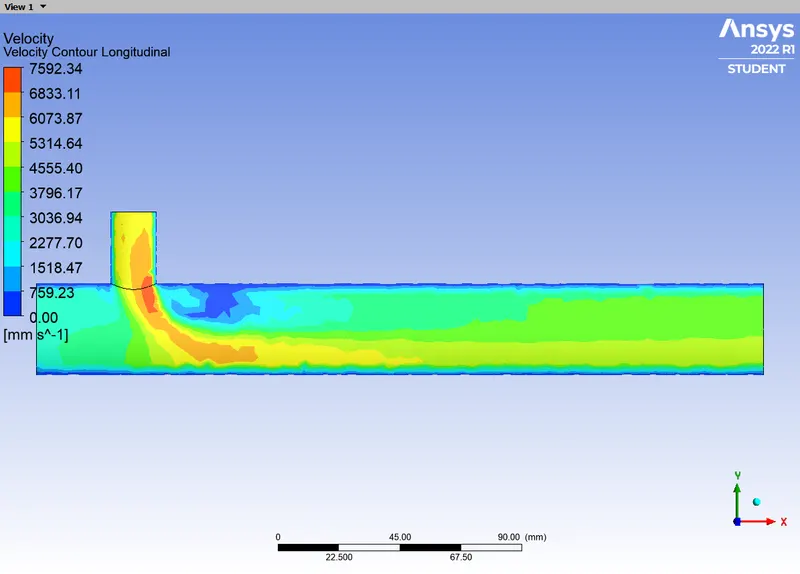
- Longitudinal Plane:
- Transverse Plane:
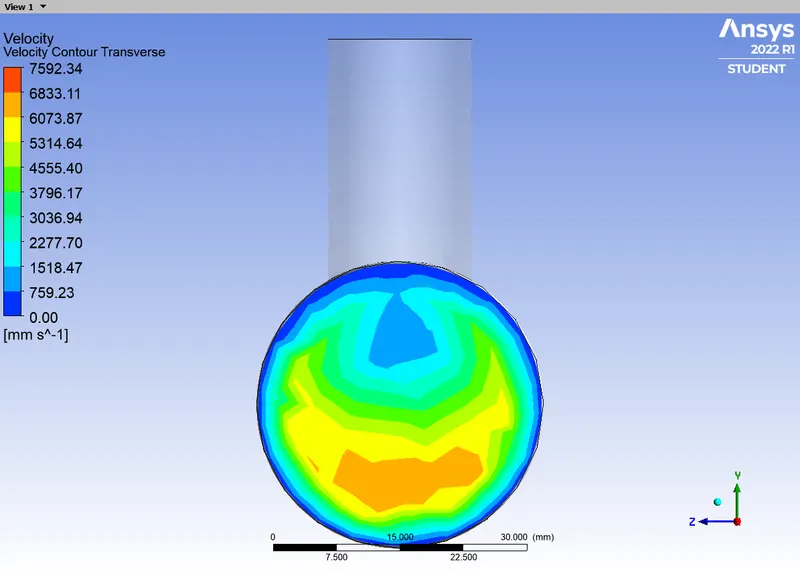
- Longitudinal Plane:
- Temperature
- Line plots
- Temperature
- Longitudinal Line:
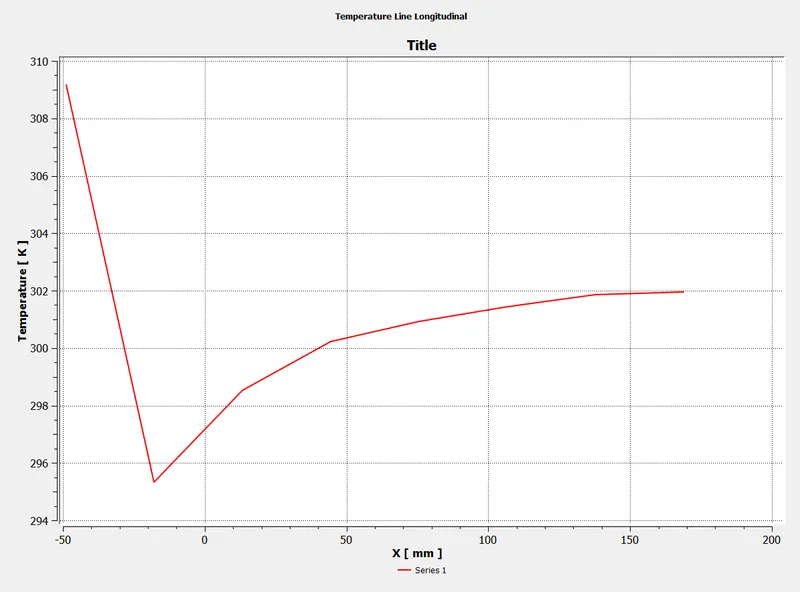
- Transverse Line:
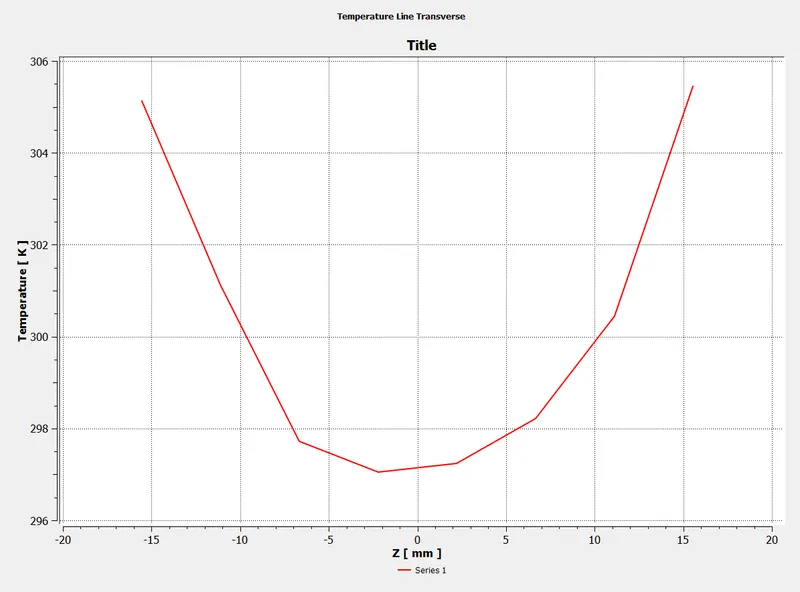
- Longitudinal Line:
- Velocity
- Longitudinal Line:
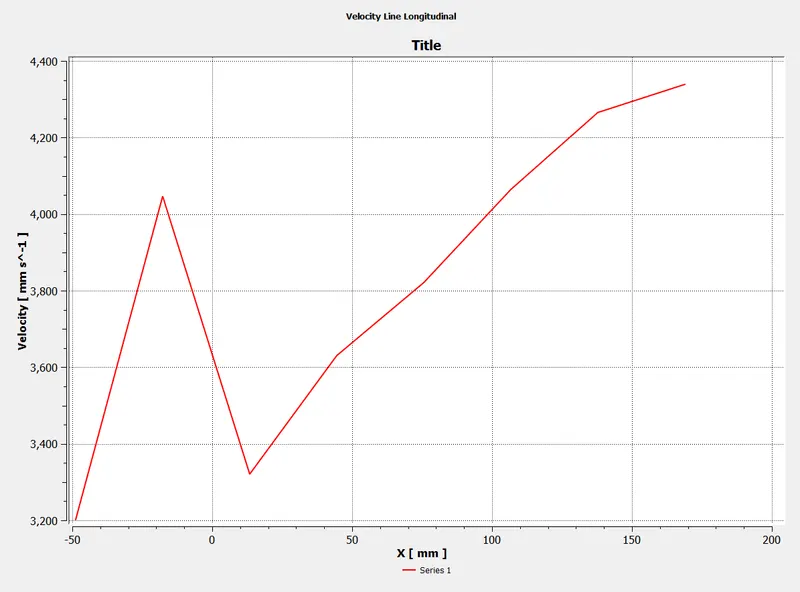
- Transverse Line:
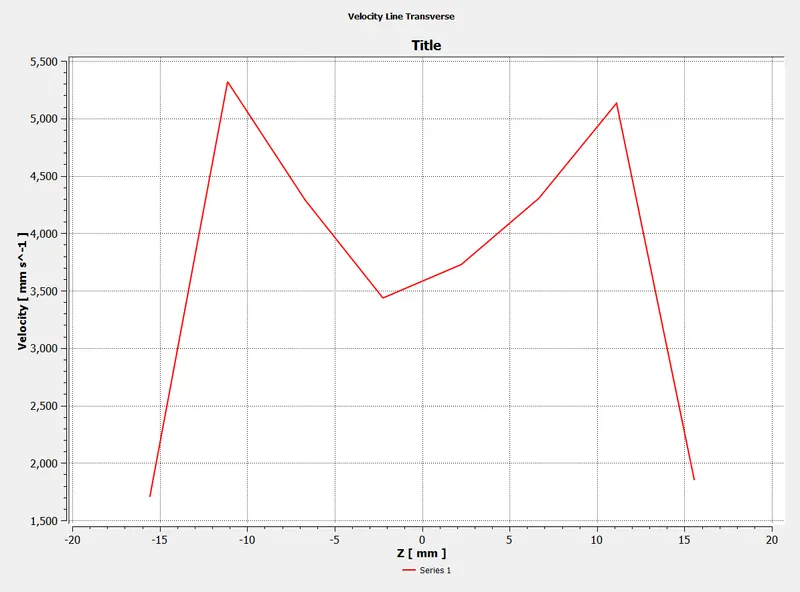
- Longitudinal Line:
- Temperature
- Convergence plot:
- Momentum ratio `4`
- Convergence plot:
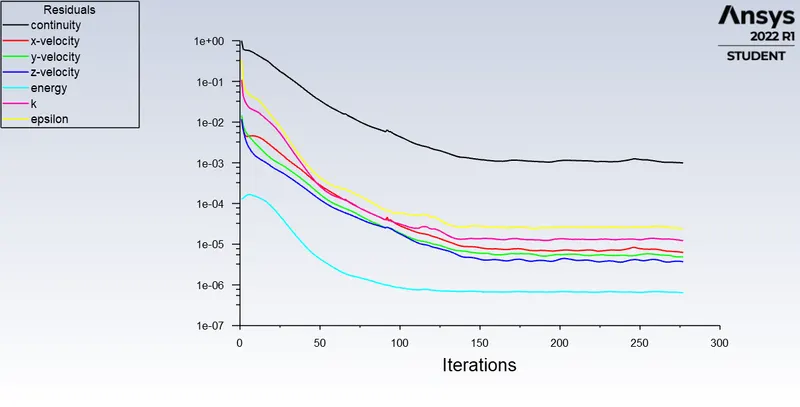
- Contours
- Temperature
- Longitudinal Plane:
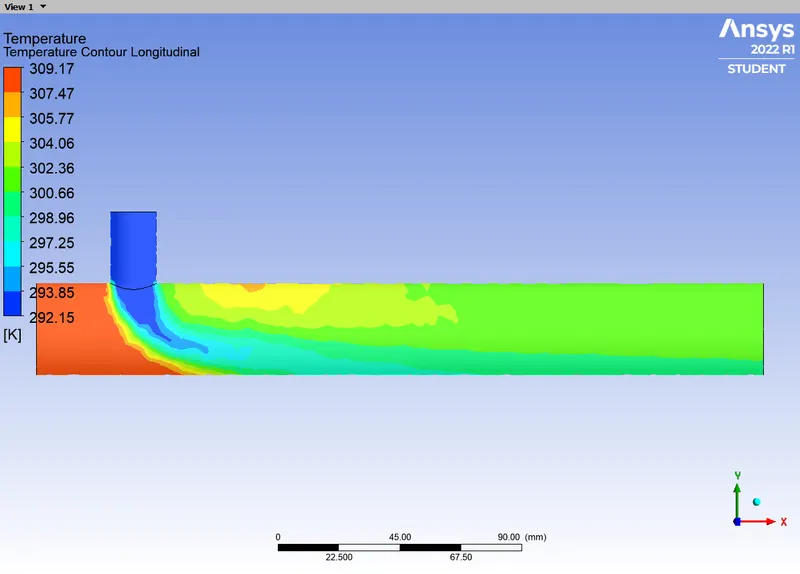
- Transverse Plane:
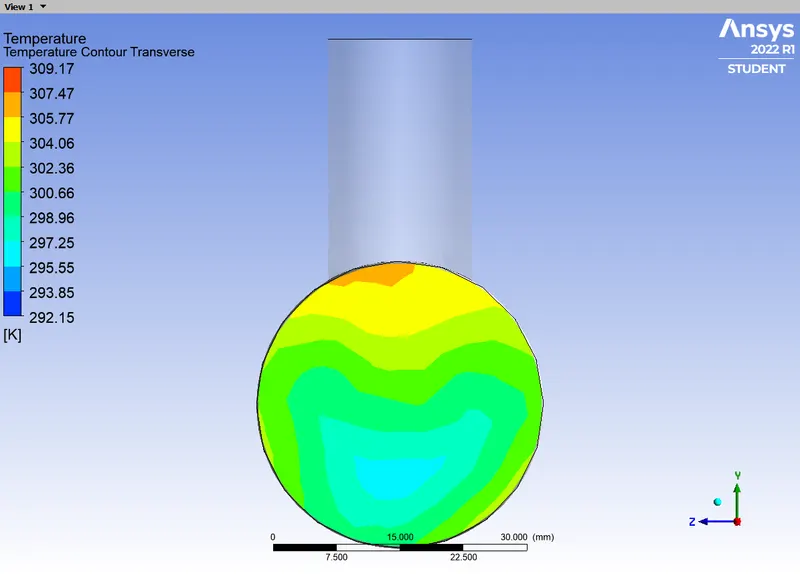
- Longitudinal Plane:
- Velocity
- Longitudinal Plane:
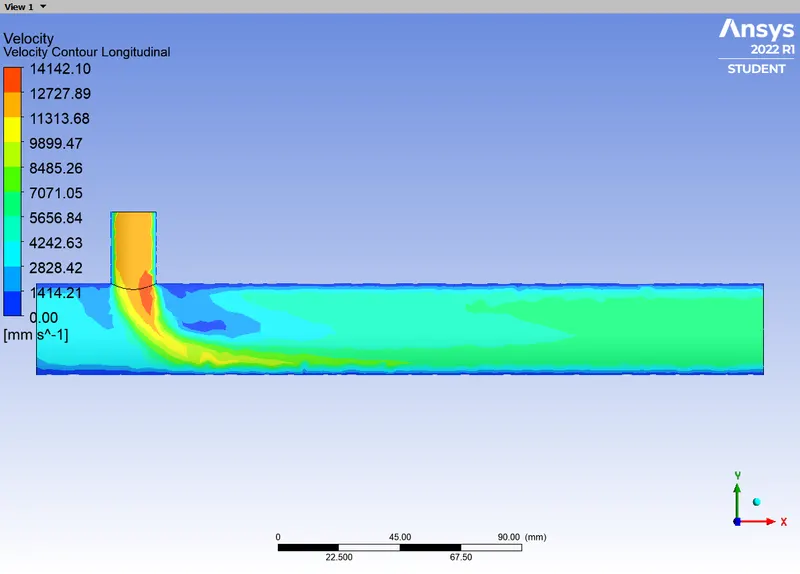
- Transverse Plane:
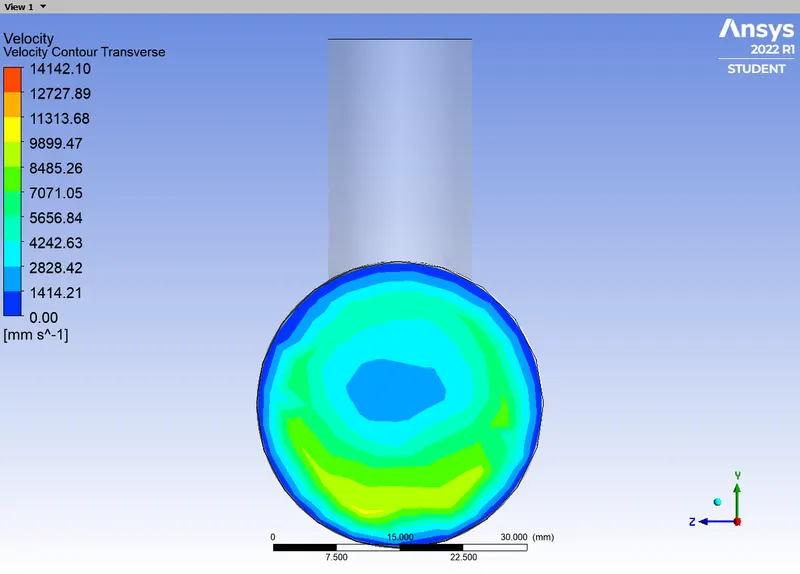
- Longitudinal Plane:
- Temperature
- Line plots
- Temperature
- Longitudinal Line:
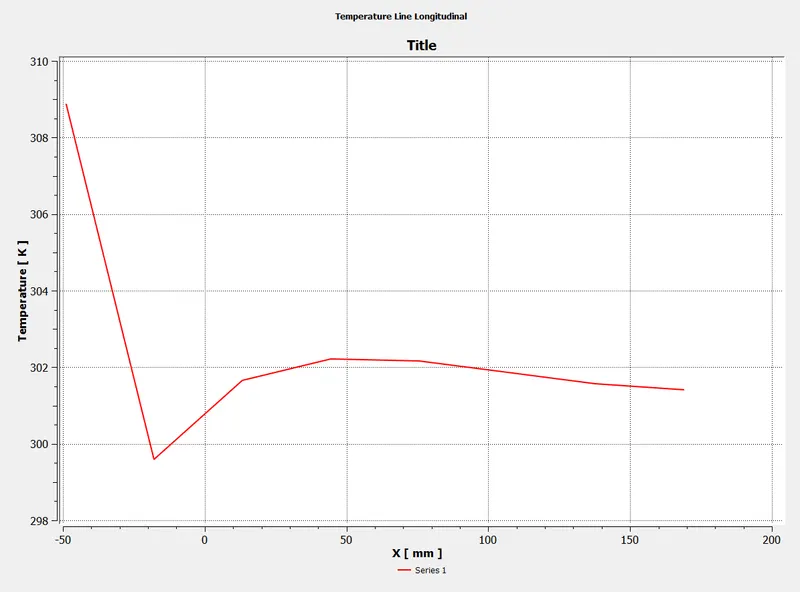
- Transverse Line:
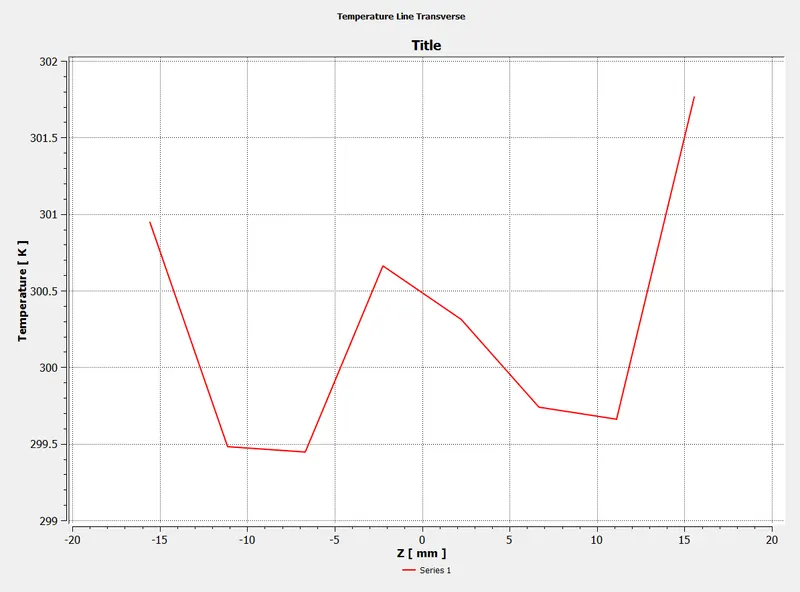
- Longitudinal Line:
- Velocity
- Longitudinal Line:
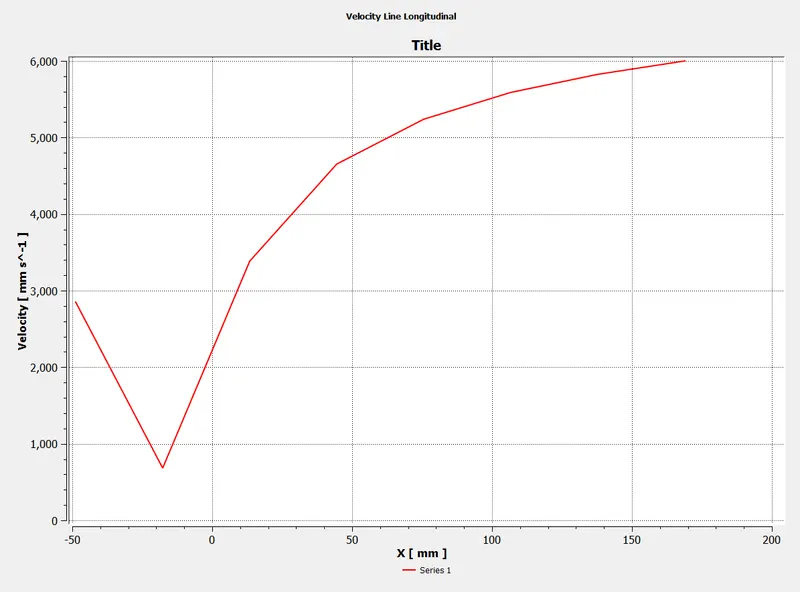
- Transverse Line:
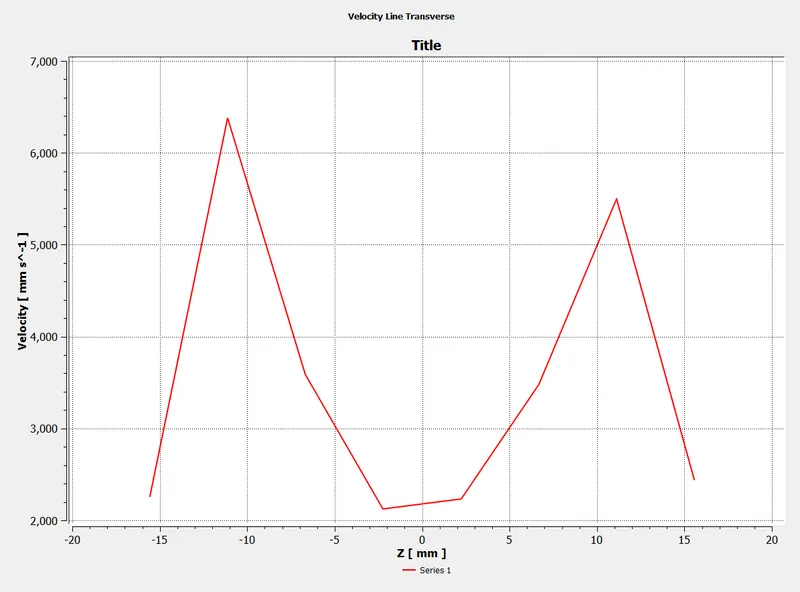
- Longitudinal Line:
- Temperature
- Convergence plot:
- Momentum ratio `2`
- Model `k-omega`
- Momentum ratio `2`
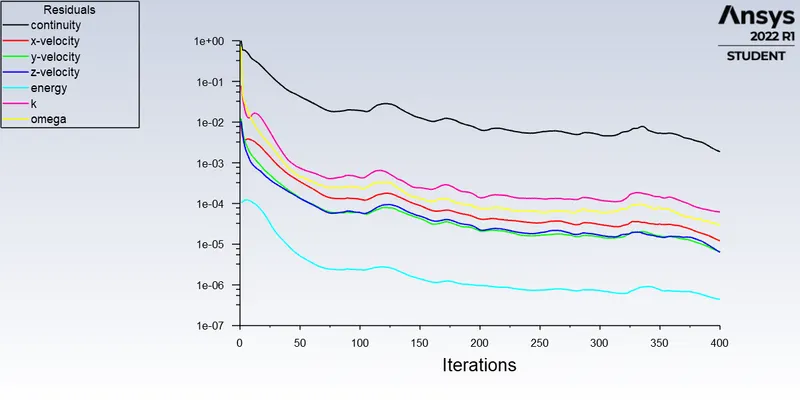
- Convergence plot:
- Contours
- Temperature
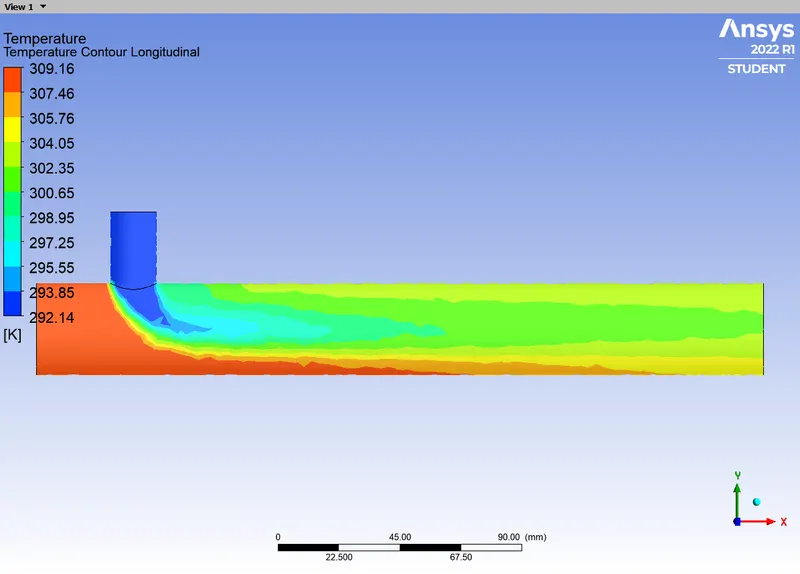
- Longitudinal Plane:
- Transverse Plane:
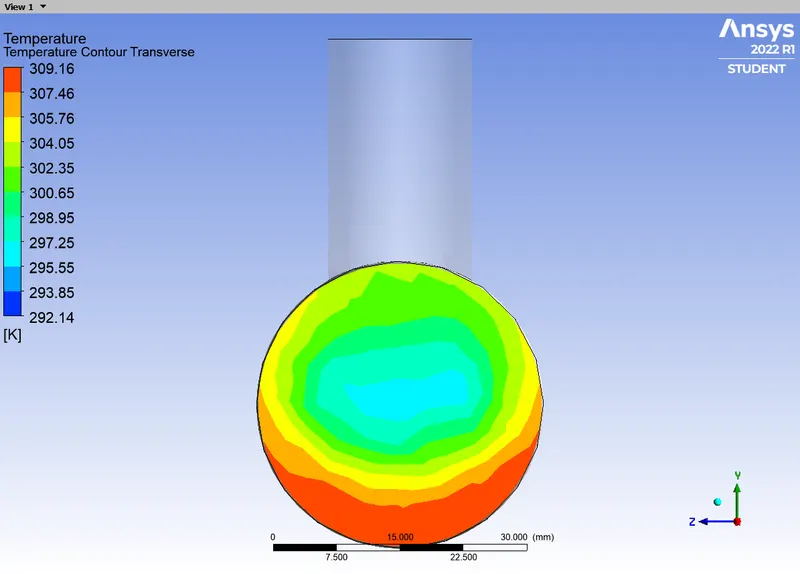
- Longitudinal Plane:
- Velocity
- Longitudinal Plane:
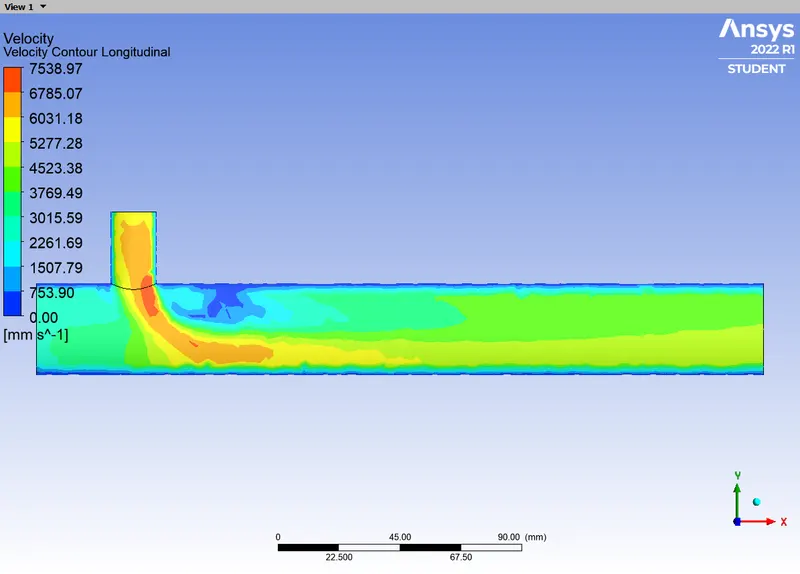
- Transverse Plane:
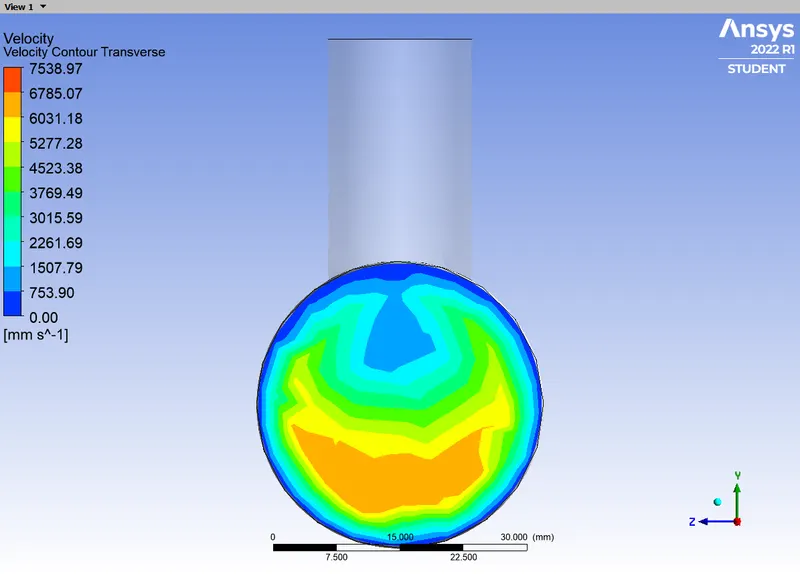
- Longitudinal Plane:
- Temperature
- Line plots
- Temperature
- Longitudinal Line:
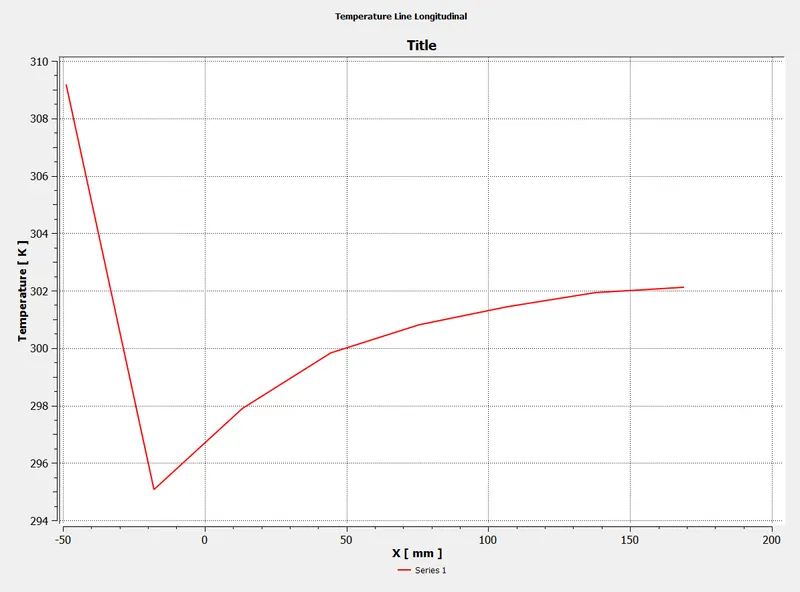
- Transverse Line:
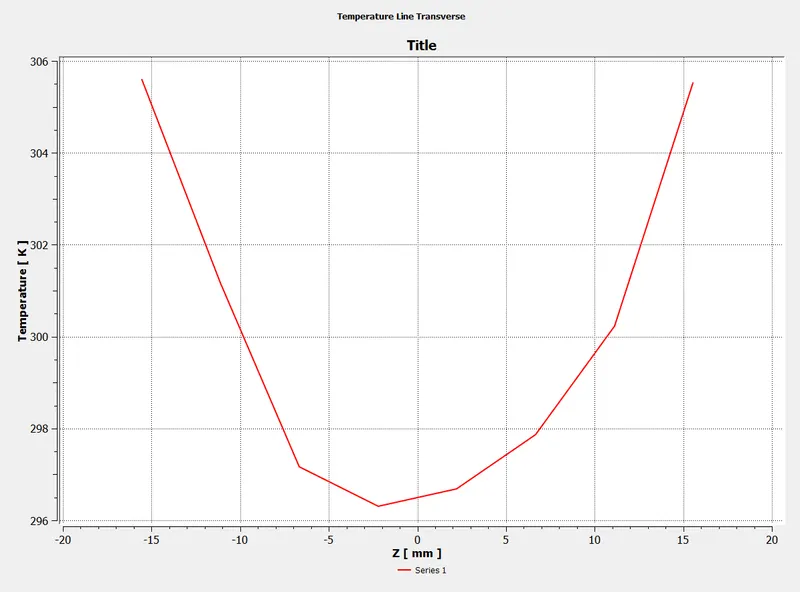
- Longitudinal Line:
- Velocity
- Longitudinal Line:
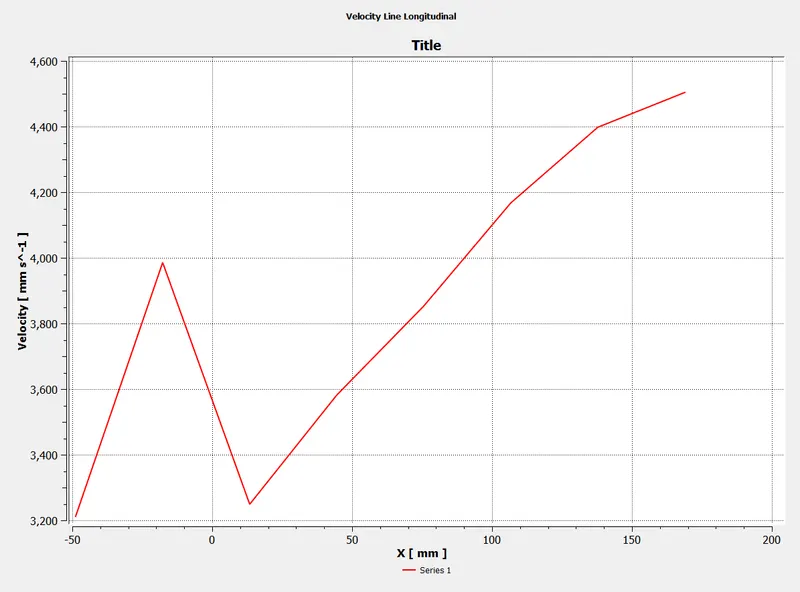
- Transverse Line:
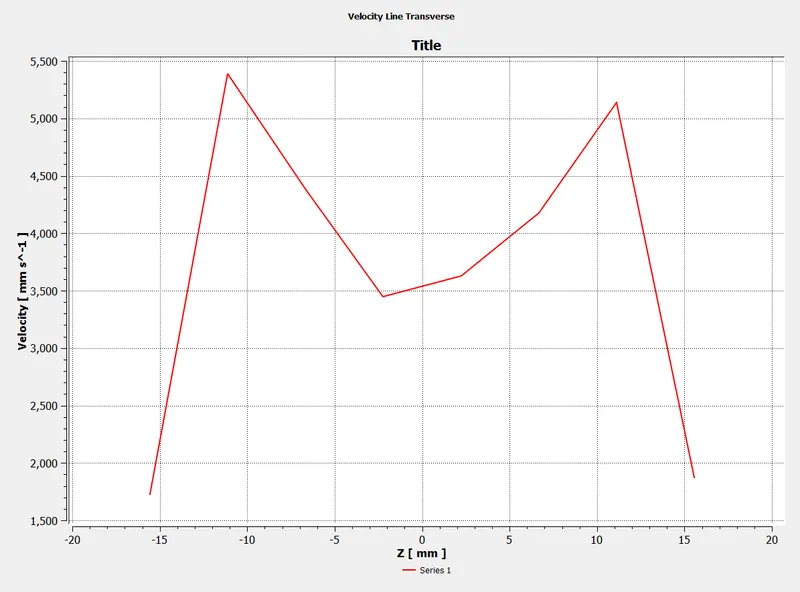
- Longitudinal Line:
- Temperature
- Convergence plot:
- Momentum ratio `4`
- Convergence plot:
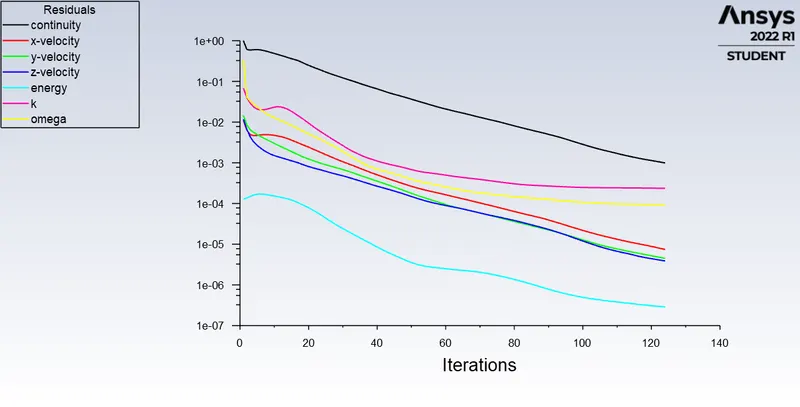
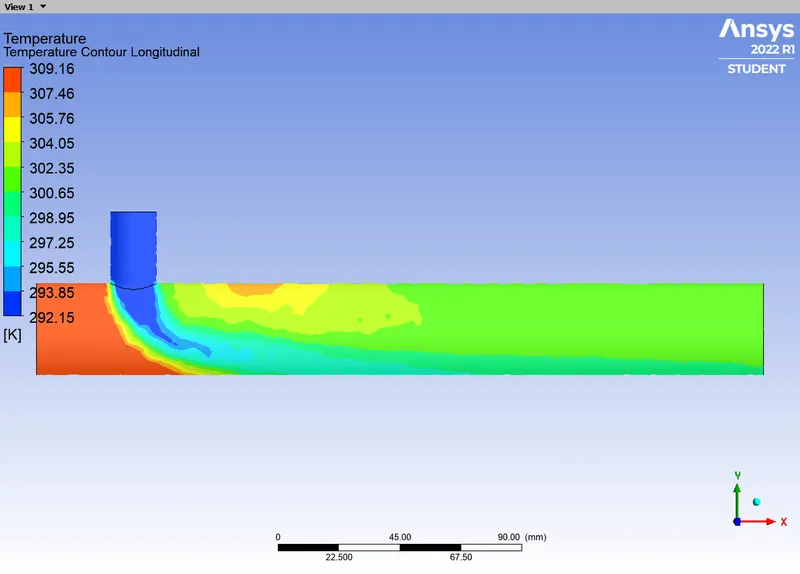
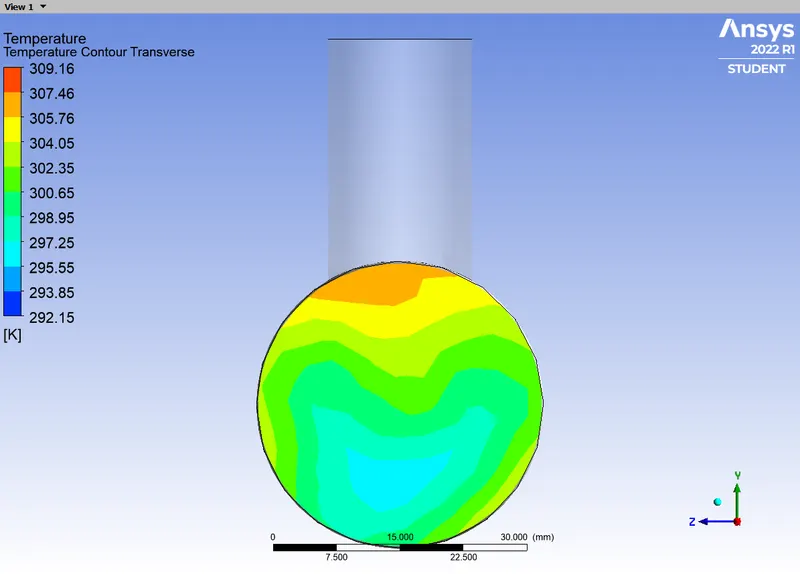
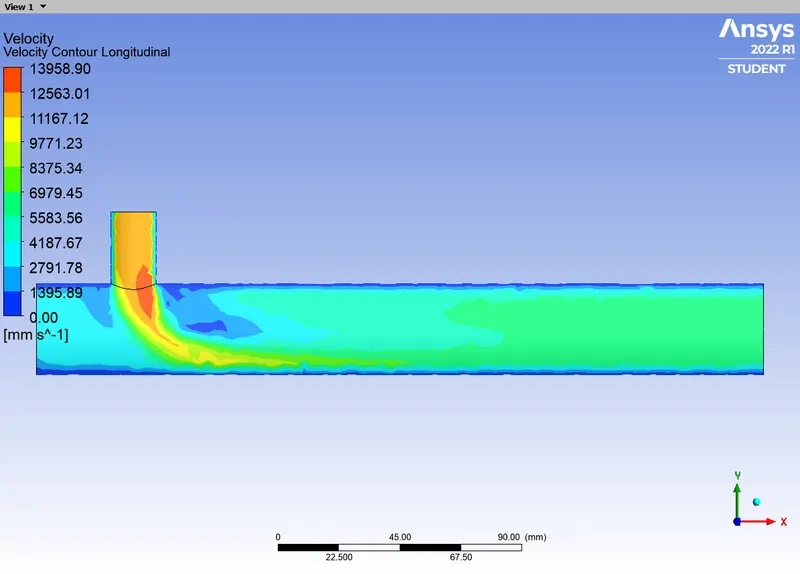
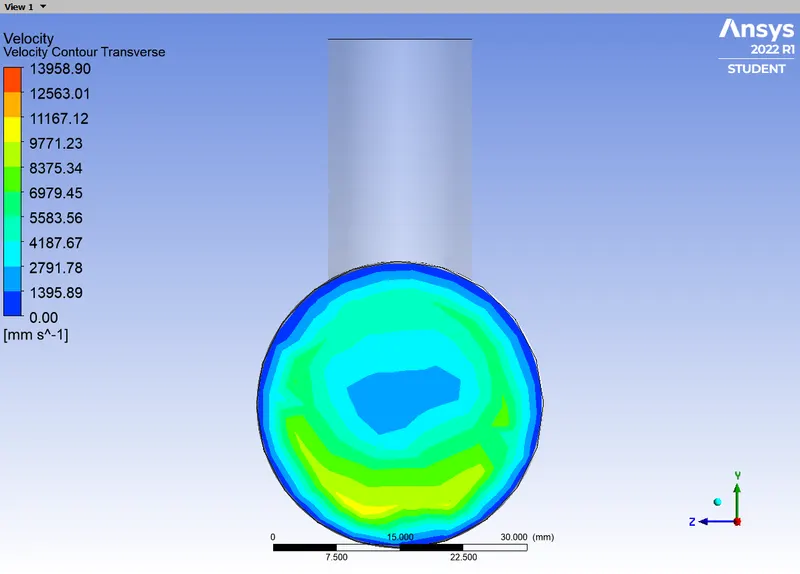
- Contours
- Temperature
- Longitudinal Plane:
- Transverse Plane:
- Longitudinal Plane:
- Velocity
- Longitudinal Plane:
- Transverse Plane:
- Longitudinal Plane:
- Temperature
- Line plots
- Temperature
- Longitudinal Line:
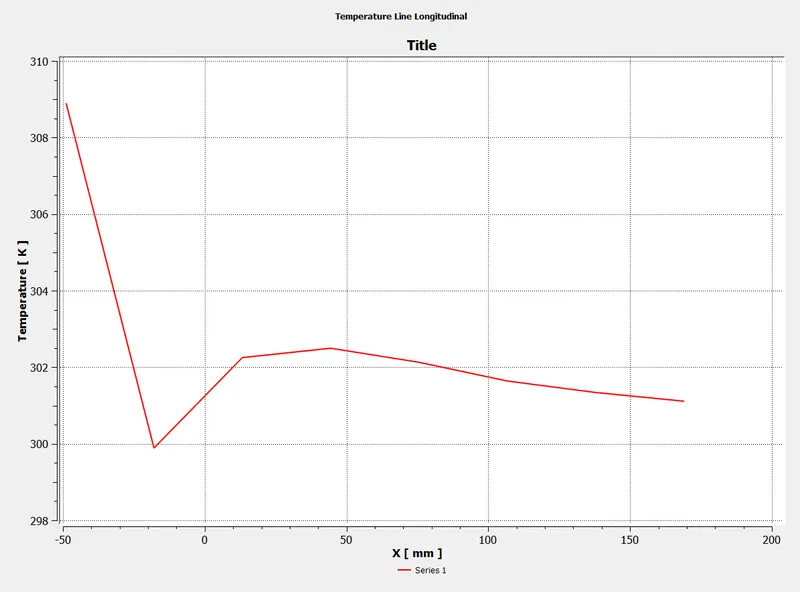
- Transverse Line:
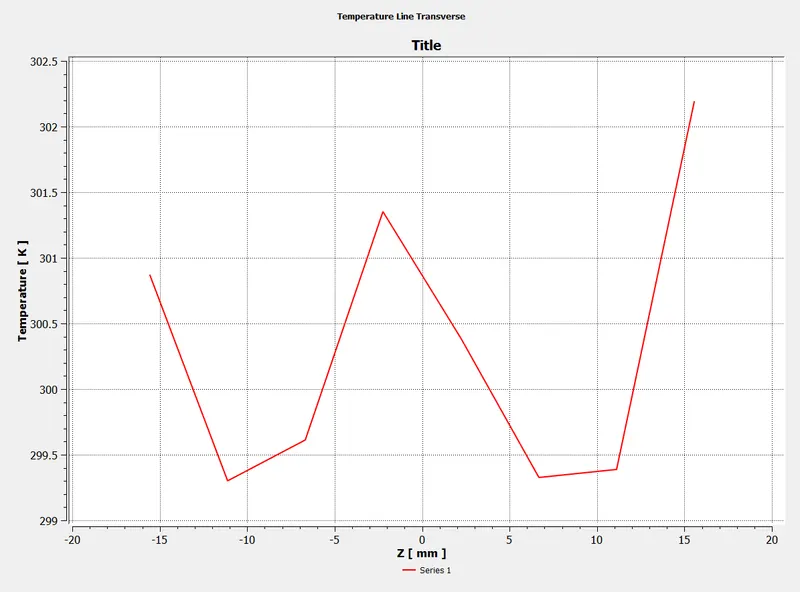
- Longitudinal Line:
- Velocity
- Longitudinal Line:
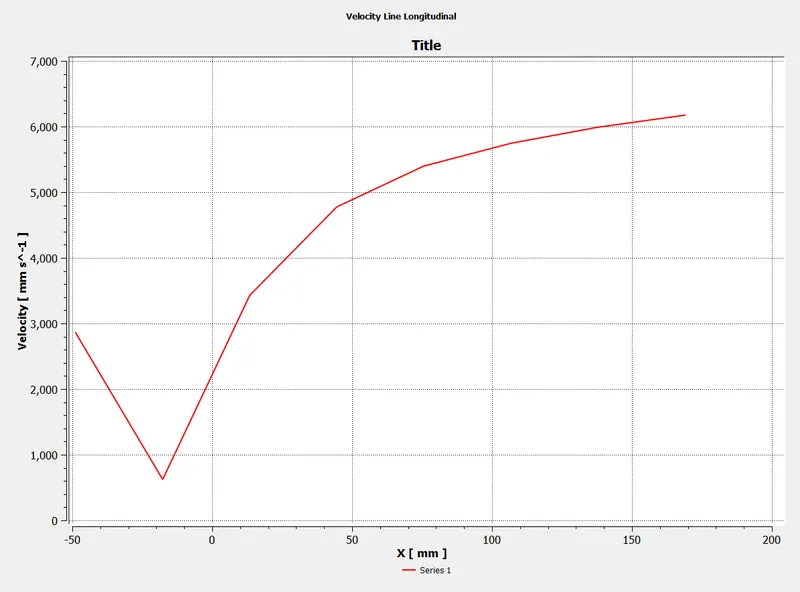
- Transverse Line:
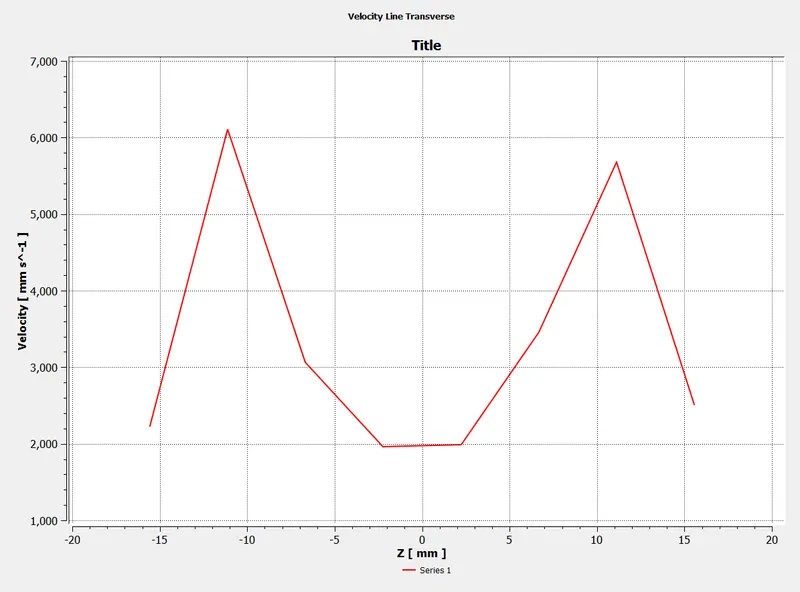
- Longitudinal Line:
- Temperature
- Convergence plot:
- Momentum ratio `2`
- Model `k-epsilon`
Tabular Comparison:
| Tee | Turbulence model | Momentum ratio | Cell count | Average outlet temperature (°C) | Number of iterations for convergence |
| Short | `k-epsilon` | `2` | `12780` | `approx30.25` | `approx400` |
| `4` | `12780` | `approx27.5` | `approx140` | ||
| `k-omega` | `2` | `12780` | `approx30.25` | `approx325` | |
| `4` | `12780` | `approx27.5` | `approx150` | ||
| Long | `k-epsilon` | `2` | `15727` | `approx30.25` | `approx400` |
| `4` | `15727` | `approx27.5` | `approx275` | ||
| `k-omega` | `2` | `15727` | `approx30.25` | `approx400` | |
| `4` | `15727` | `approx27.5` | `approx120` |
Grid Dependency Test:
Tee: Short
Turbulence model: `k-epsilon`
Momentum ratio: `2`
- Element size `10.219` mm (`12780` elements)
- Convergence plot:
- Contours
- Temperature
- Longitudinal Plane:
- Transverse Plane:
- Longitudinal Plane:
- Velocity
- Longitudinal Plane:
- Transverse Plane:
- Longitudinal Plane:
- Temperature
- Line plots
- Temperature
- Longitudinal Line:
- Transverse Line:
- Longitudinal Line:
- Velocity
- Longitudinal Line:
- Transverse Line:
- Longitudinal Line:
- Temperature
- Convergence plot:
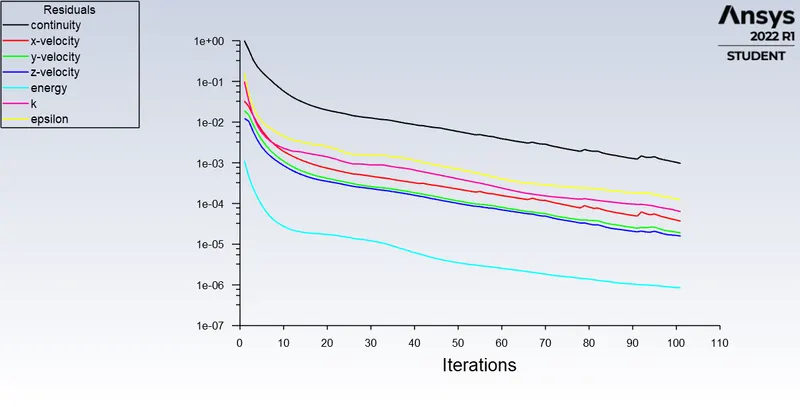
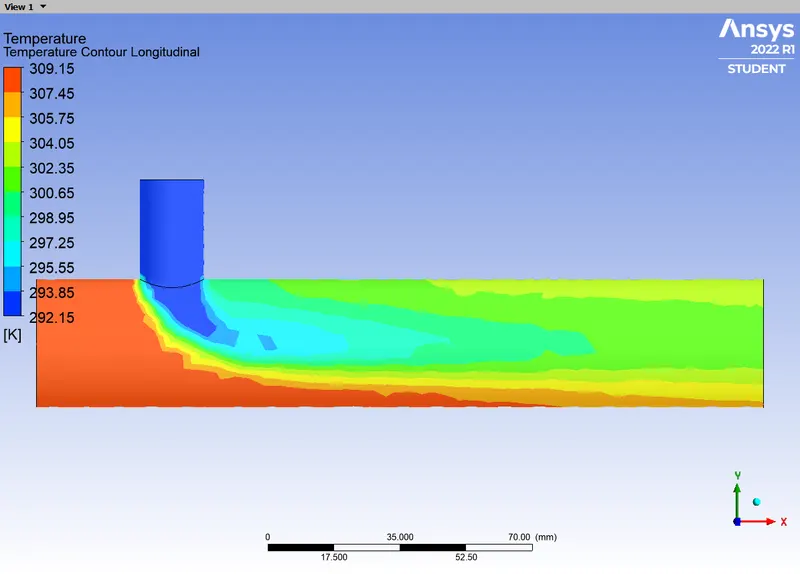
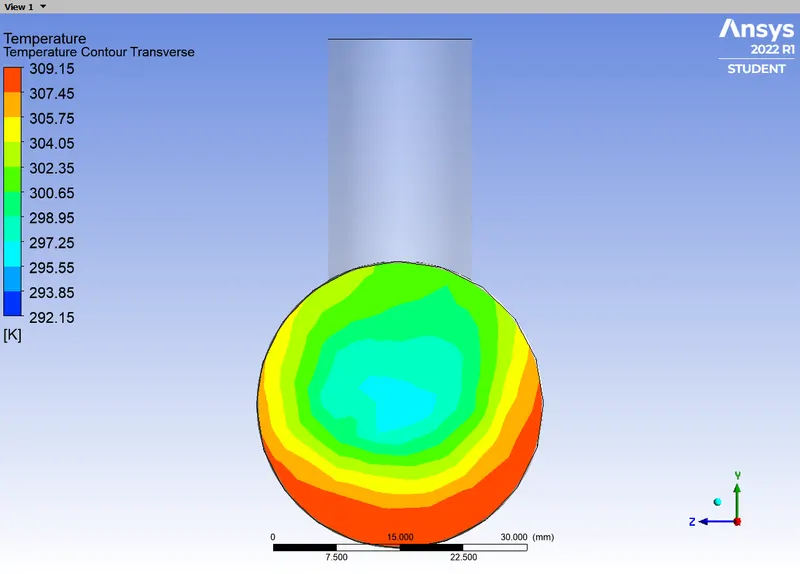
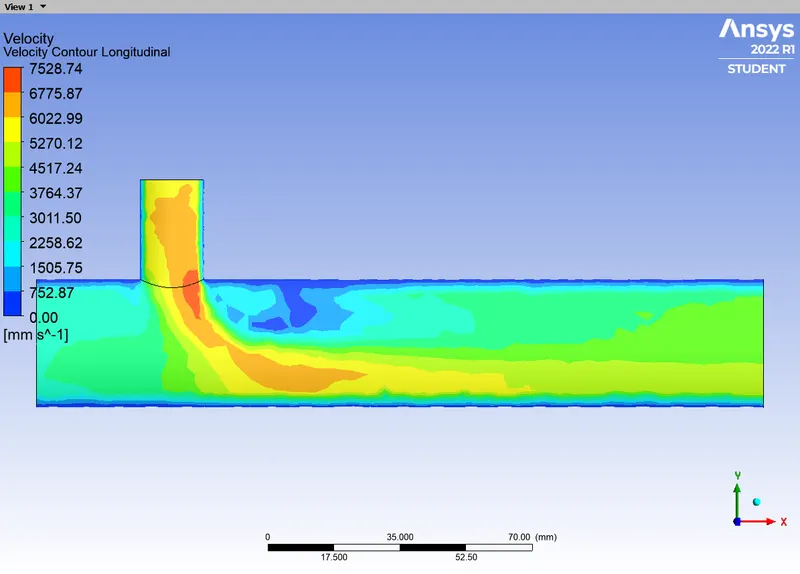
- Element size `6` mm (`12830` elements)
- Convergence plot:
- Contours
- Temperature
- Longitudinal Plane:
- Transverse Plane:
- Longitudinal Plane:
- Velocity
- Longitudinal Plane:
- Transverse Plane:
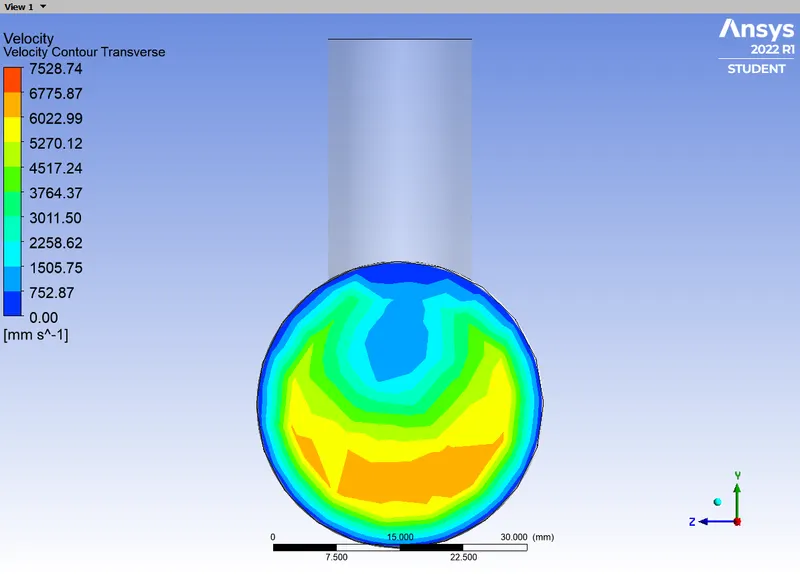
- Longitudinal Plane:
- Temperature
- Line plots
- Temperature
- Longitudinal Line:
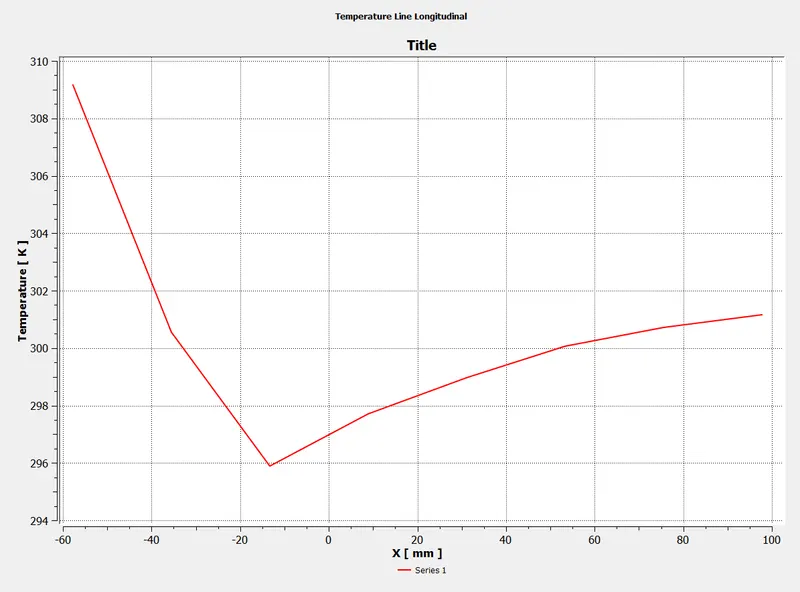
- Transverse Line:
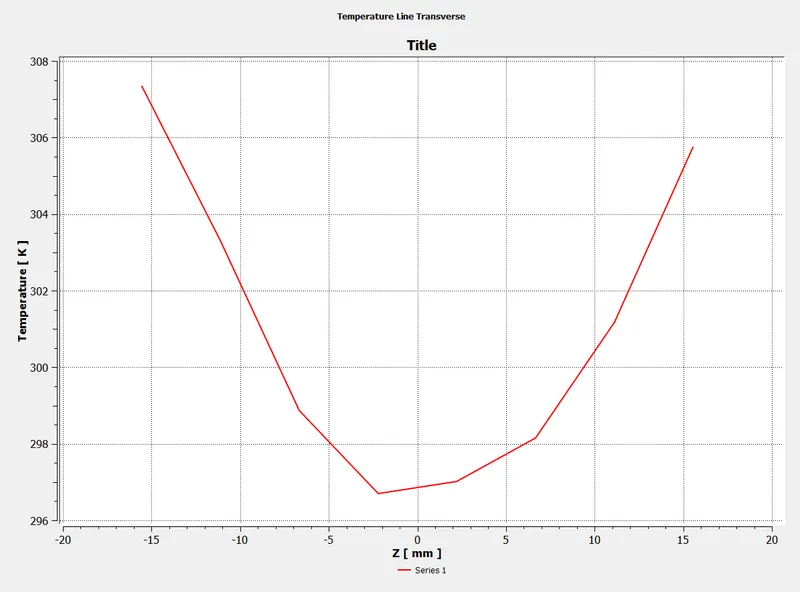
- Longitudinal Line:
- Velocity
- Longitudinal Line:
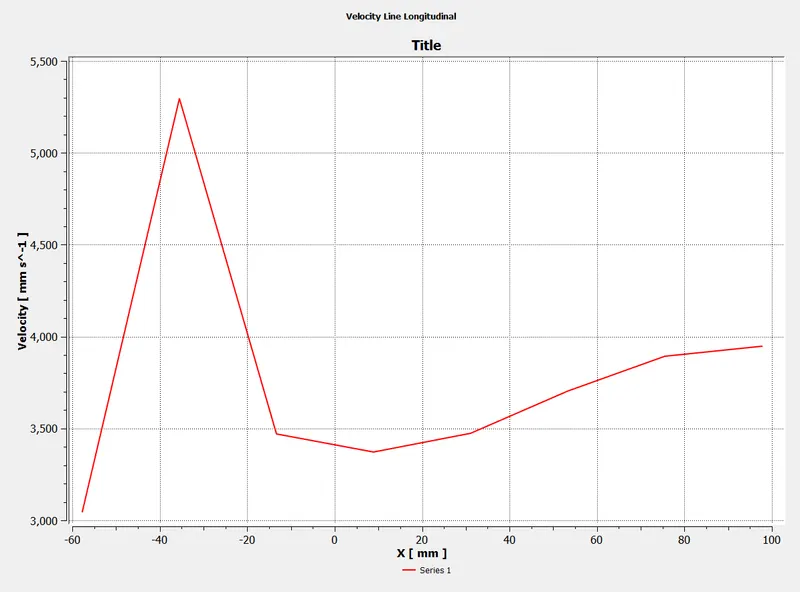
- Transverse Line:
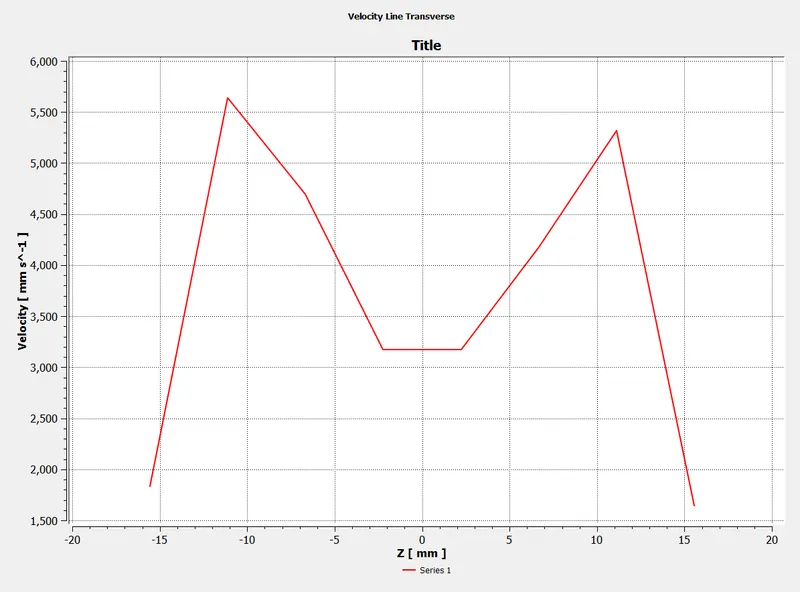
- Longitudinal Line:
- Temperature
- Convergence plot:
- Element size `5` mm (`14400` elements)
- Convergence plot:
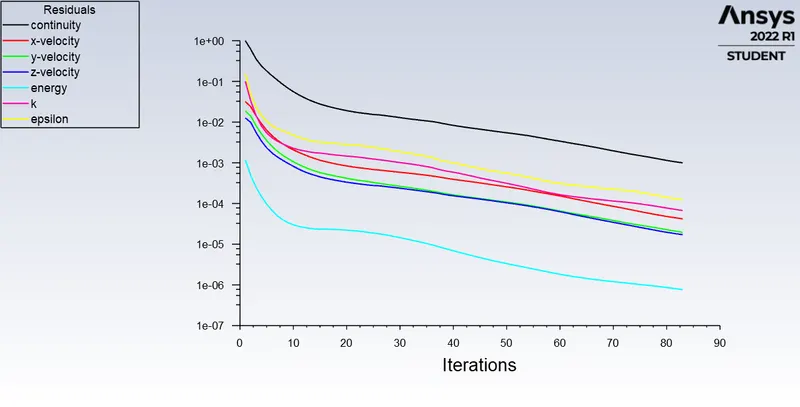
- Contours
- Temperature
- Longitudinal Plane:
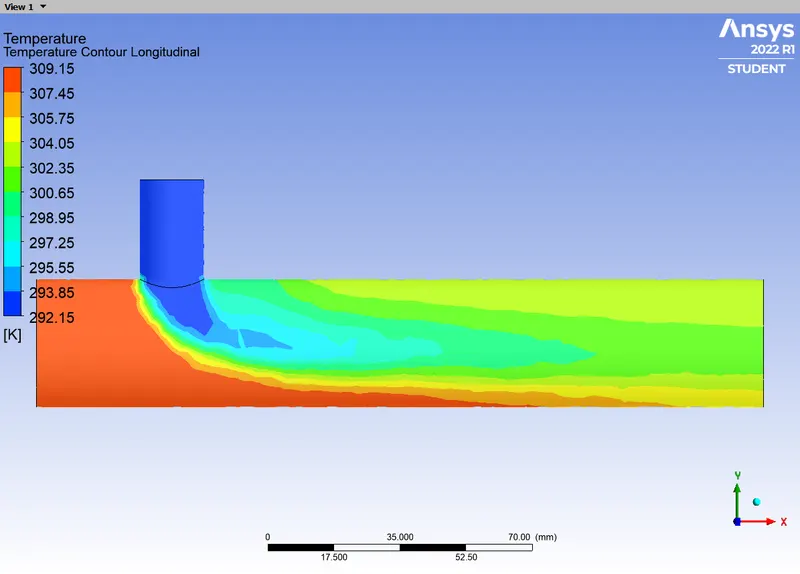
- Transverse Plane:
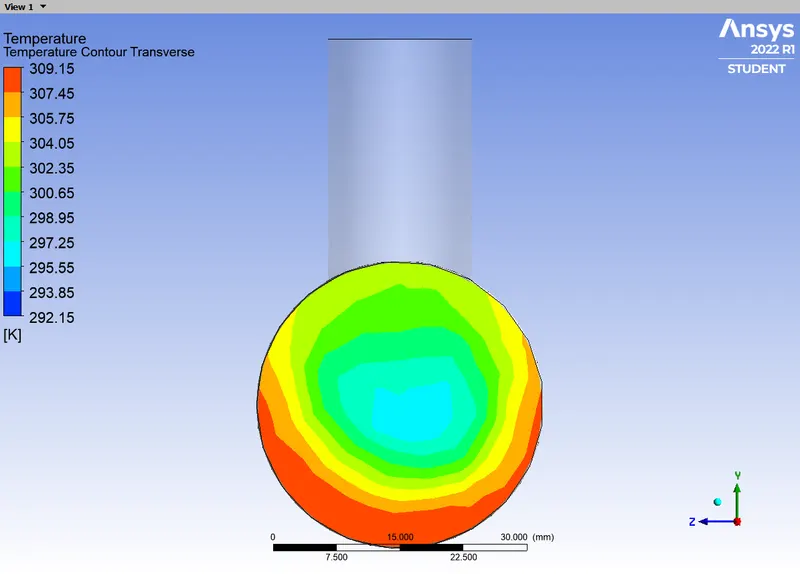
- Longitudinal Plane:
- Velocity
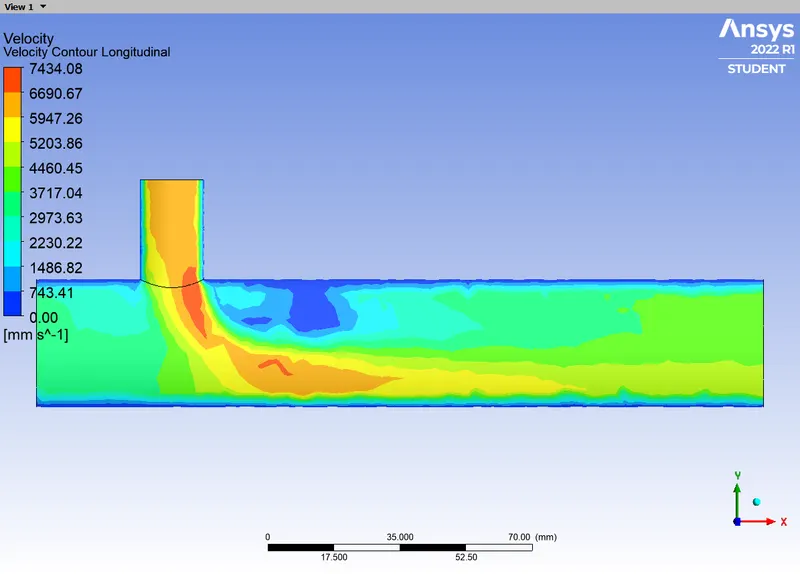
- Longitudinal Plane:
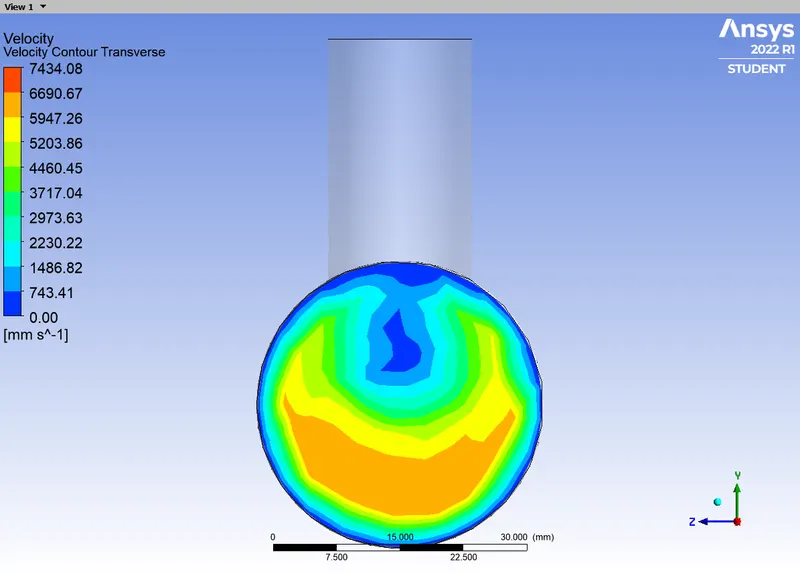
- Transverse Plane:
- Longitudinal Plane:
- Temperature
- Line plots
- Temperature
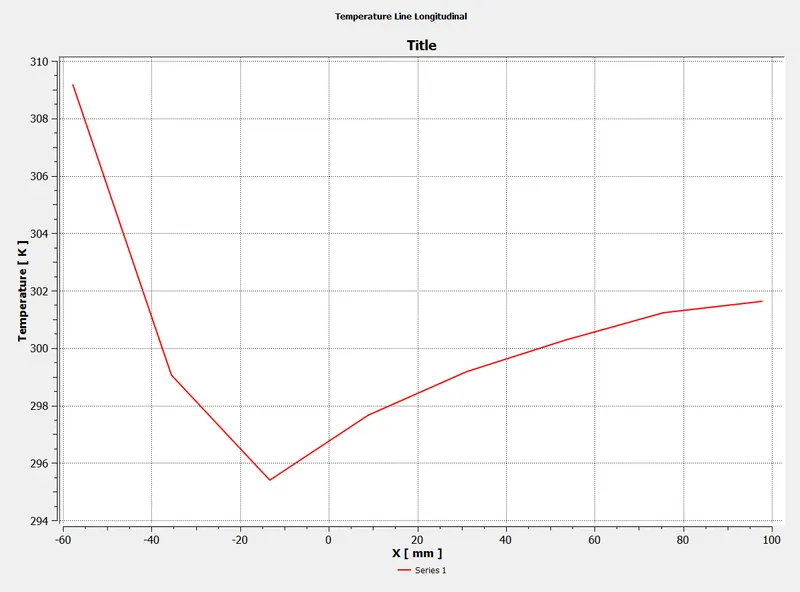
- Longitudinal Line:
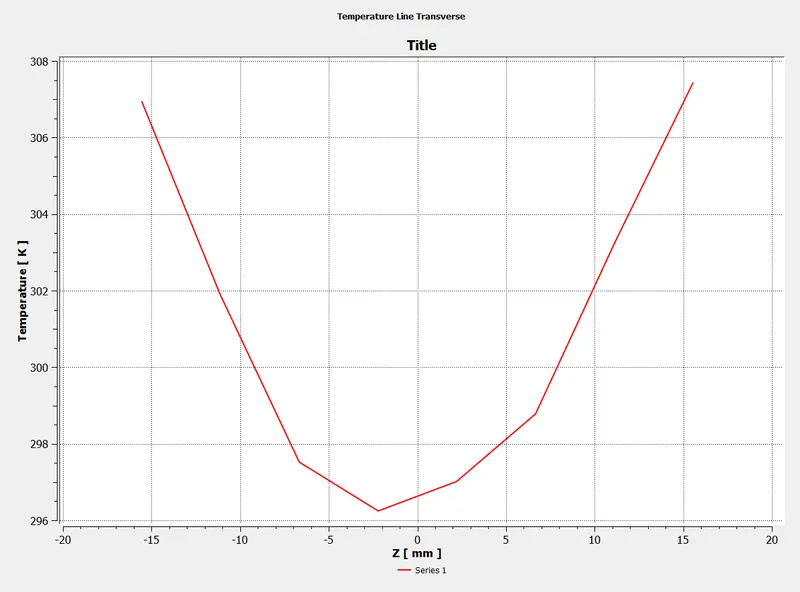
- Transverse Line:
- Longitudinal Line:
- Velocity
- Longitudinal Line:
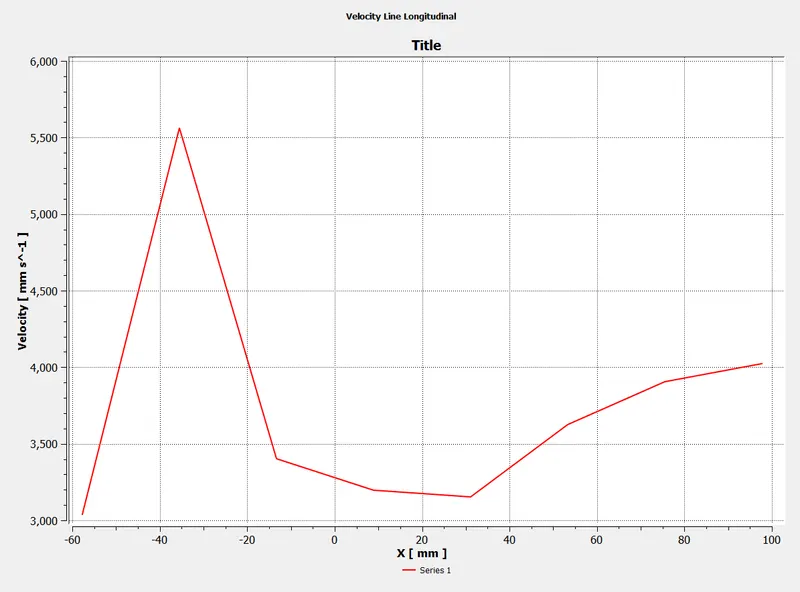
- Transverse Line:
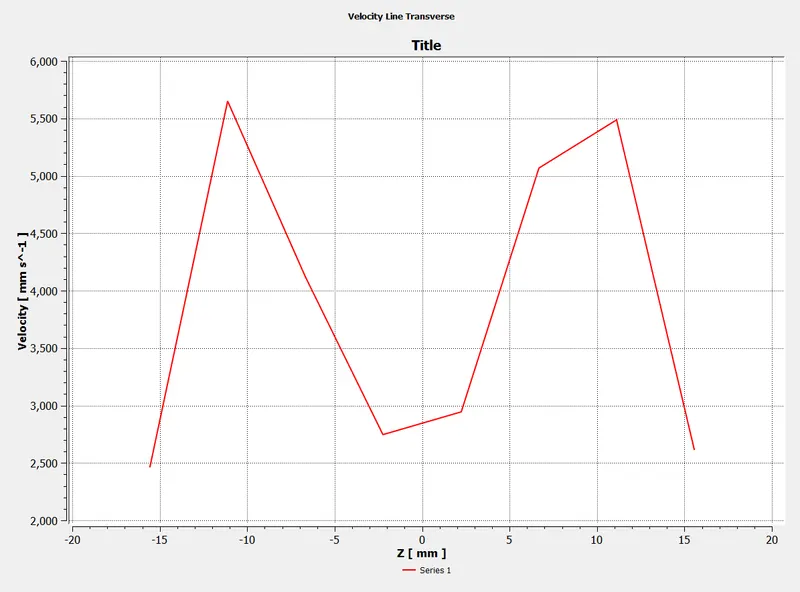
- Longitudinal Line:
- Temperature
- Convergence plot:
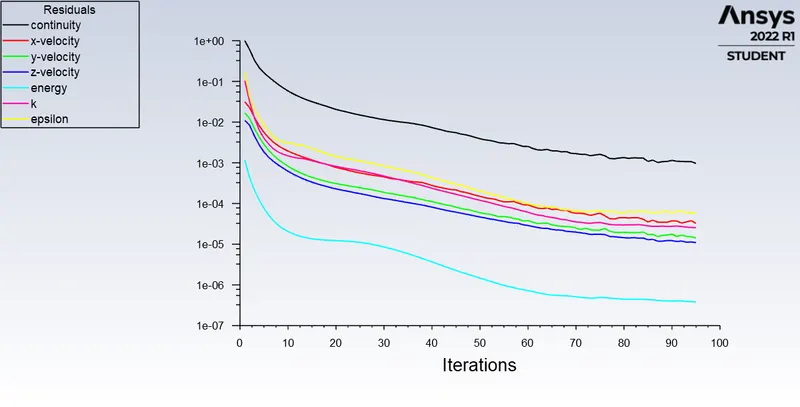
- Element size `4` mm (`22167` elements)
- Convergence plot:
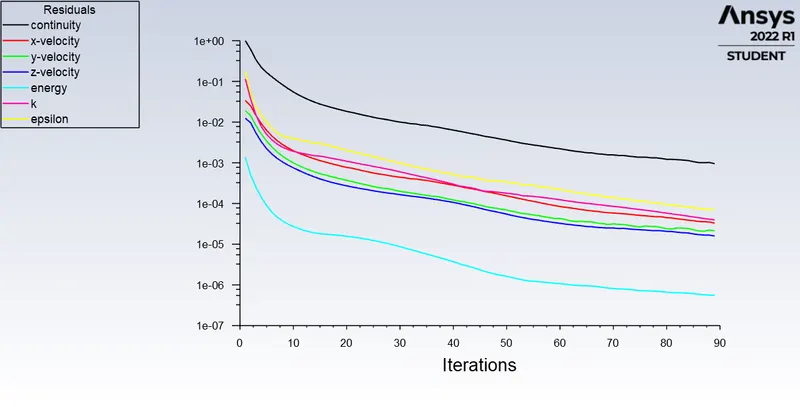
- Contours
- Temperature
- Longitudinal Plane:
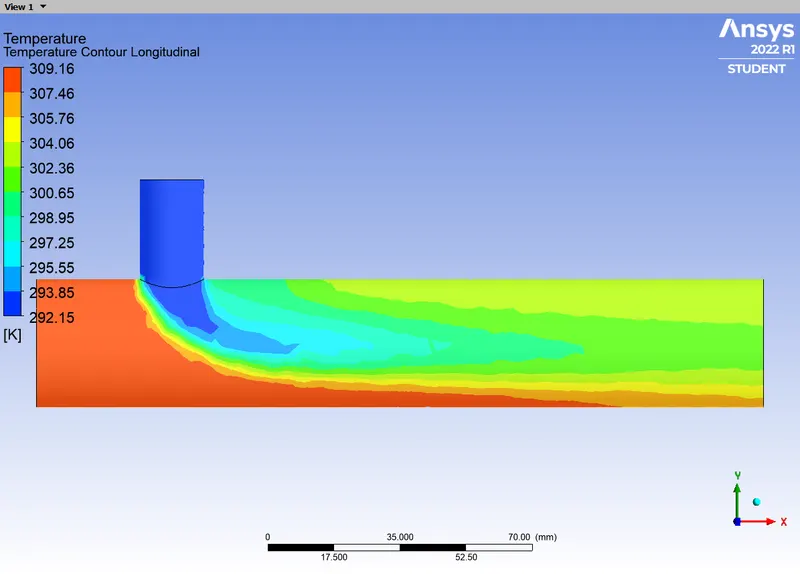
- Transverse Plane:
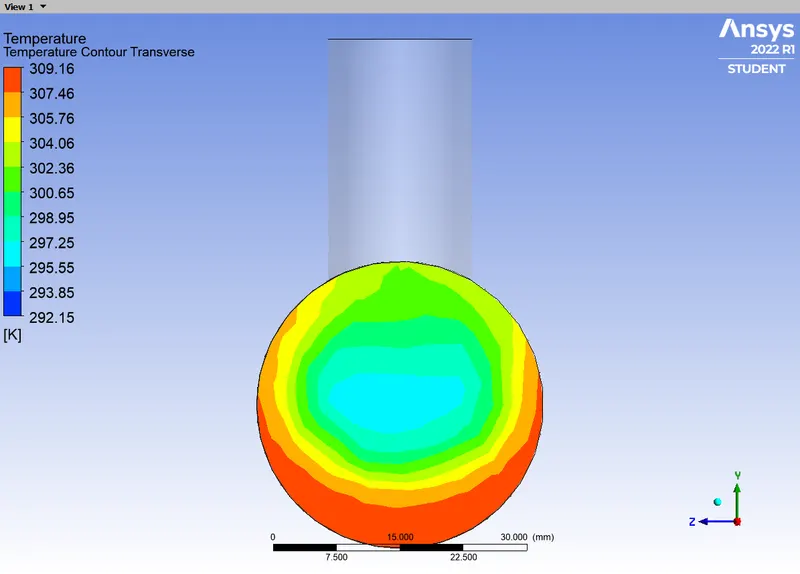
- Longitudinal Plane:
- Velocity
- Longitudinal Plane:
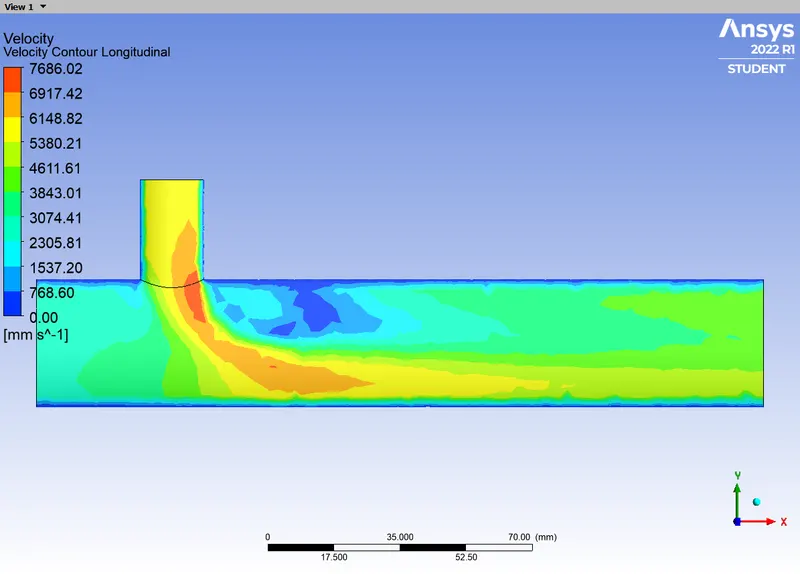
- Transverse Plane:
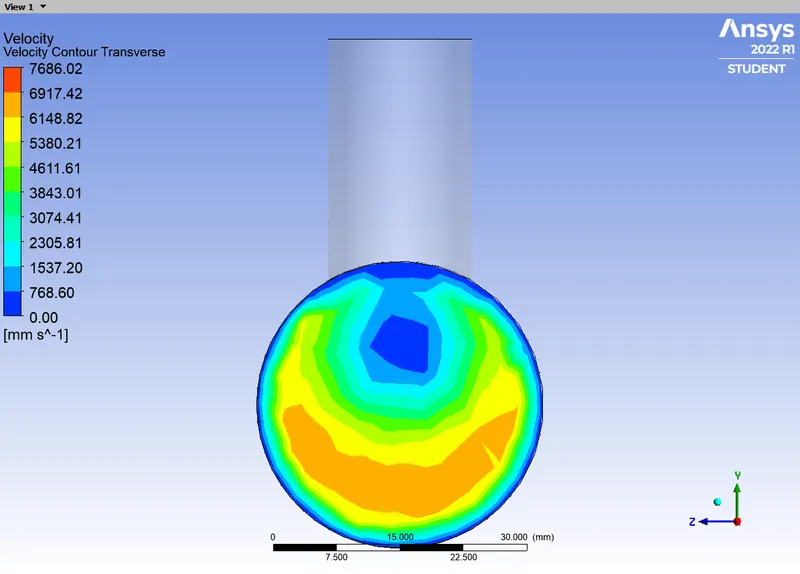
- Longitudinal Plane:
- Temperature
- Line plots
- Temperature
- Longitudinal Line:
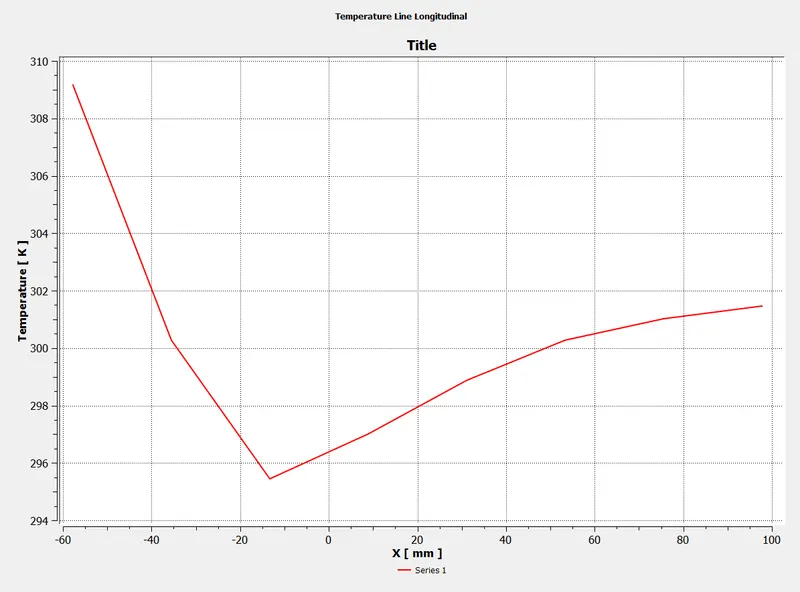
- Transverse Line:
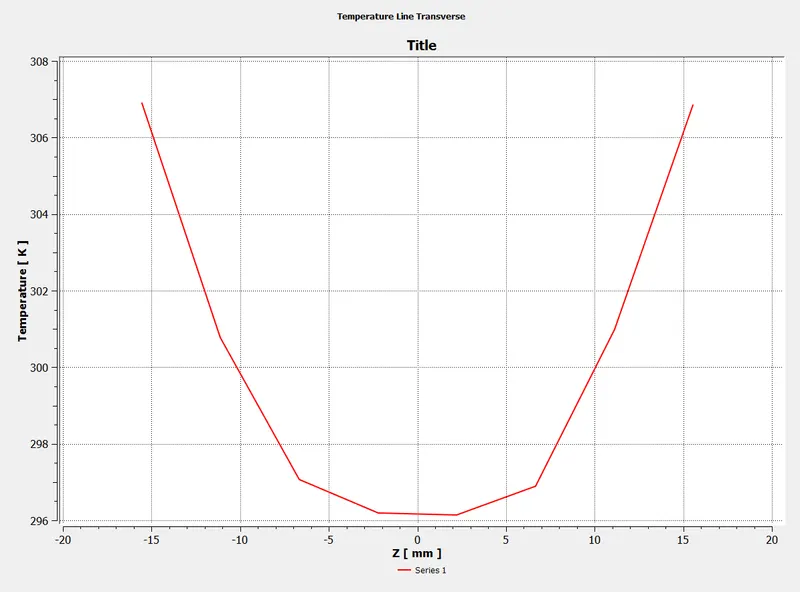
- Longitudinal Line:
- Velocity
- Longitudinal Line:
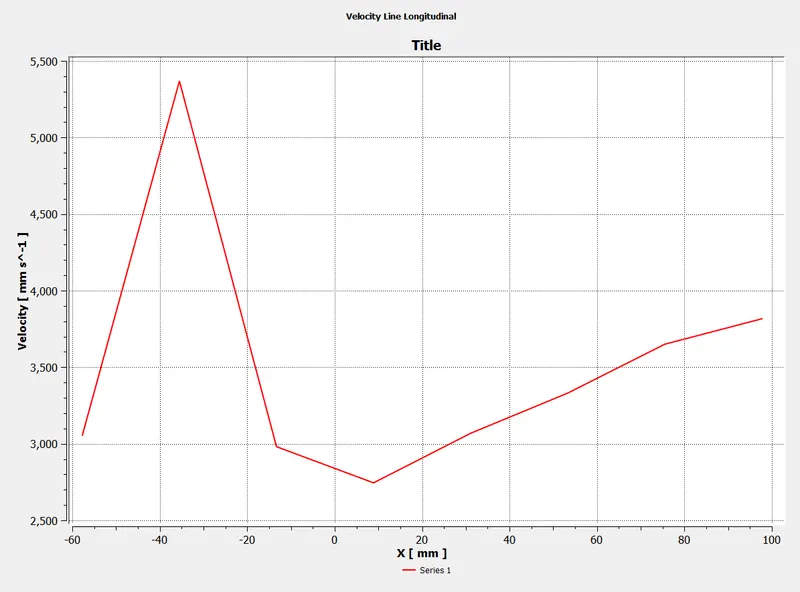
- Transverse Line:
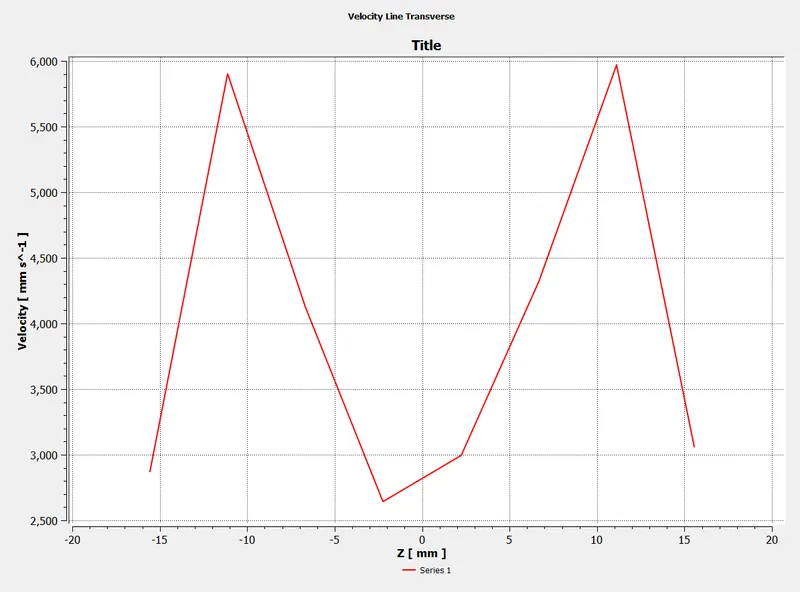
- Longitudinal Line:
- Temperature
- Convergence plot:
- Element size `3` mm (`39725` elements)
- Convergence plot:
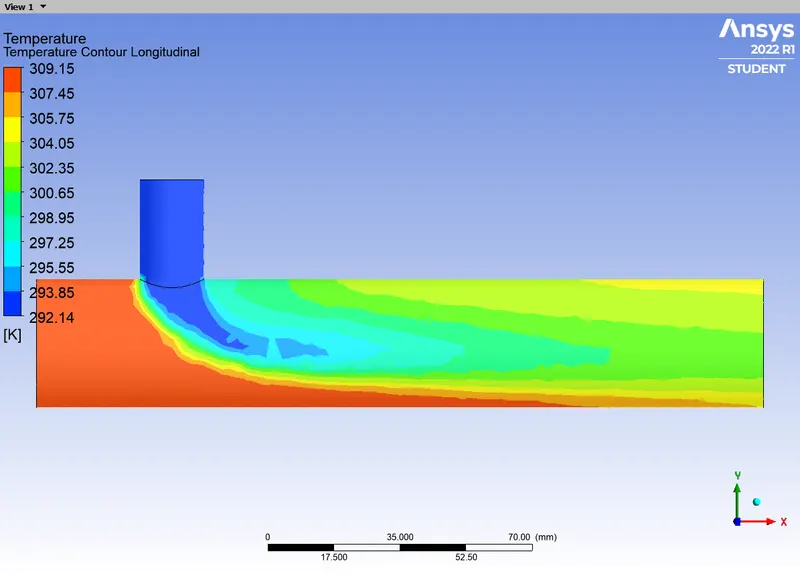
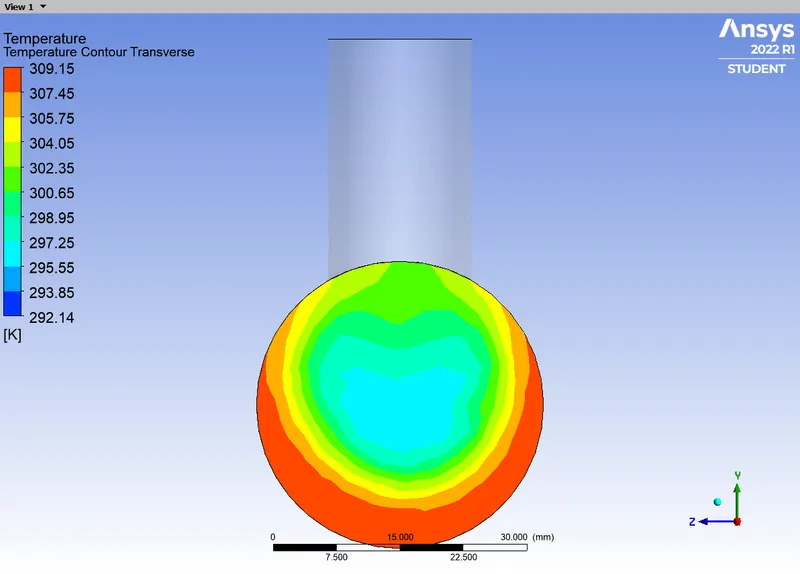
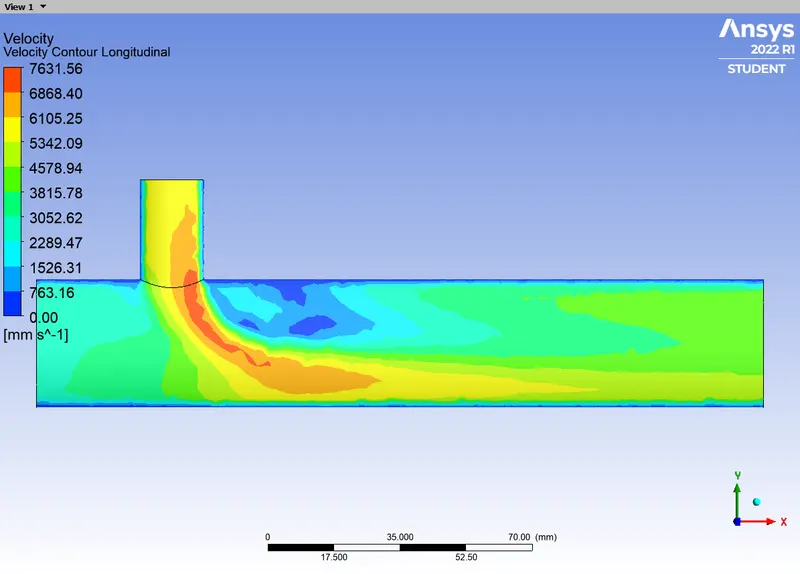
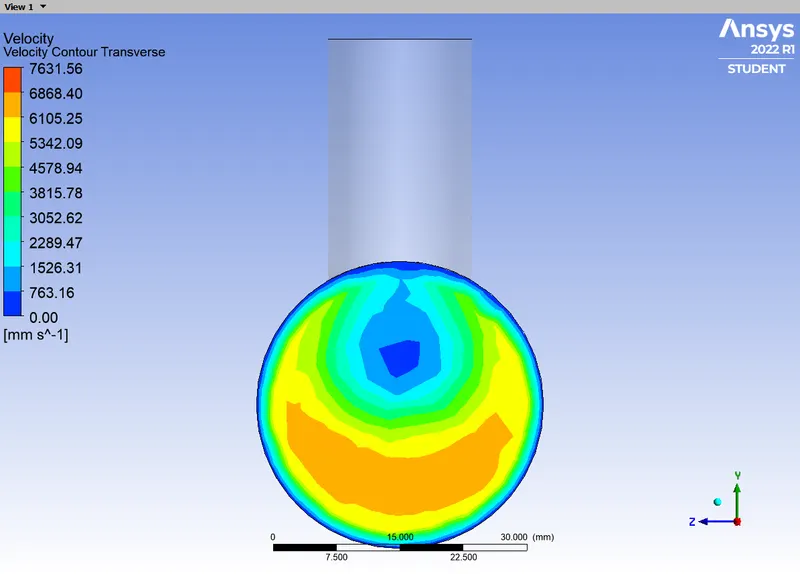
- Contours
- Temperature
- Longitudinal Plane:
- Transverse Plane:
- Longitudinal Plane:
- Velocity
- Longitudinal Plane:
- Transverse Plane:
- Longitudinal Plane:
- Temperature
- Line plots
- Temperature
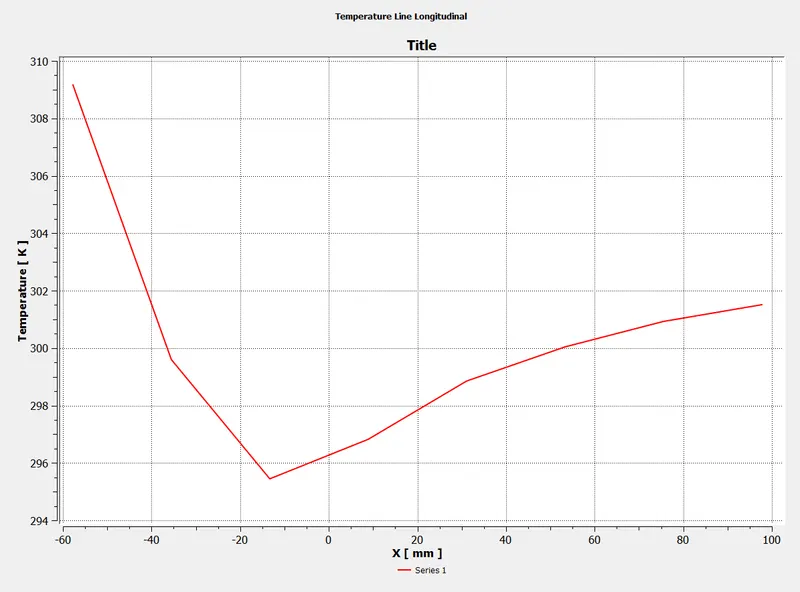
- Longitudinal Line:
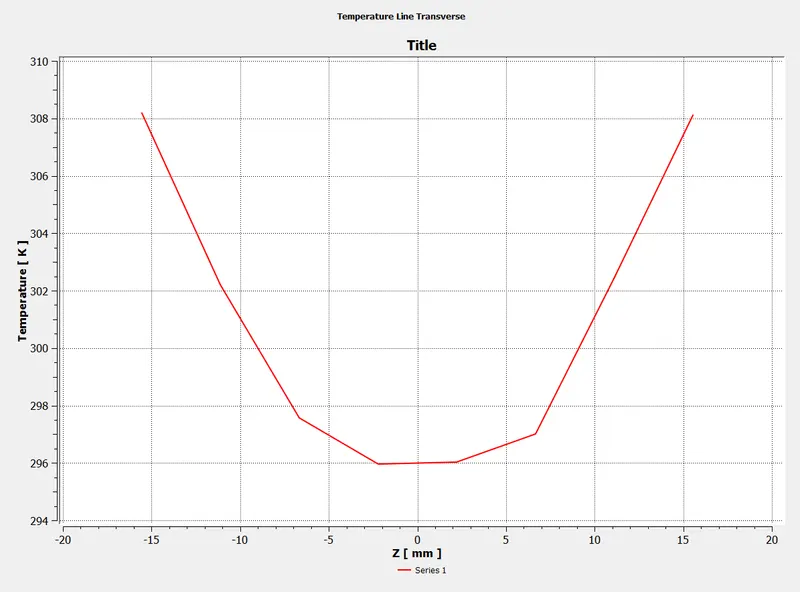
- Transverse Line:
- Longitudinal Line:
- Velocity
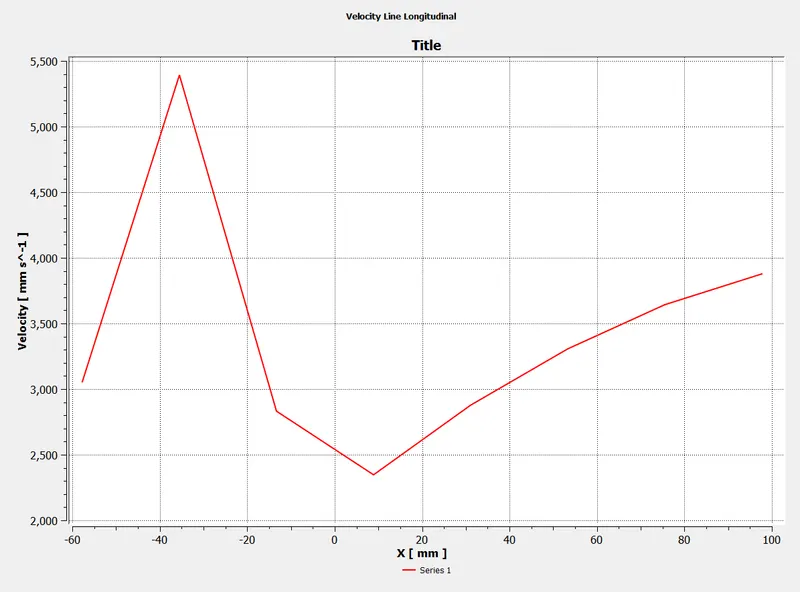
- Longitudinal Line:
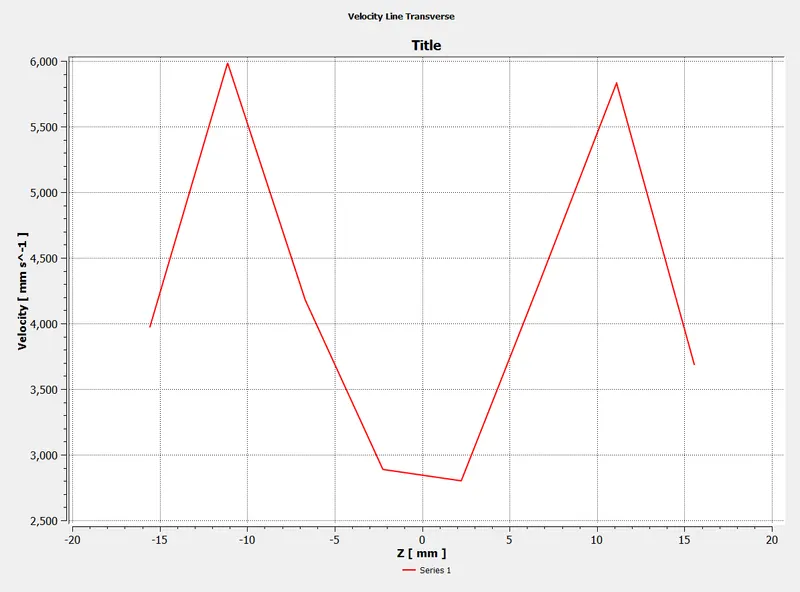
- Transverse Line:
- Longitudinal Line:
- Temperature
- Convergence plot:
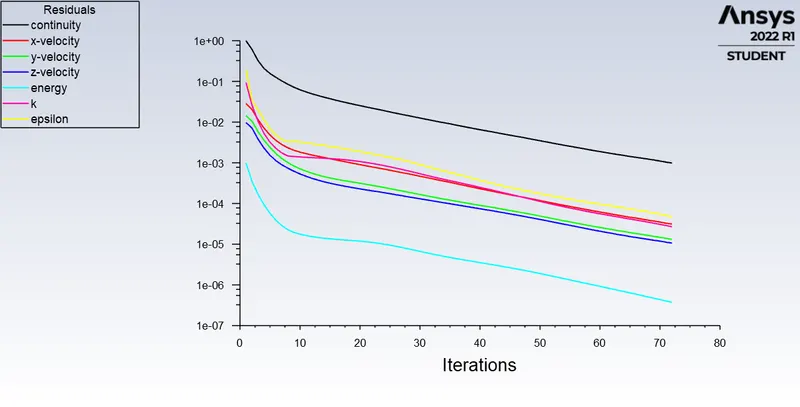
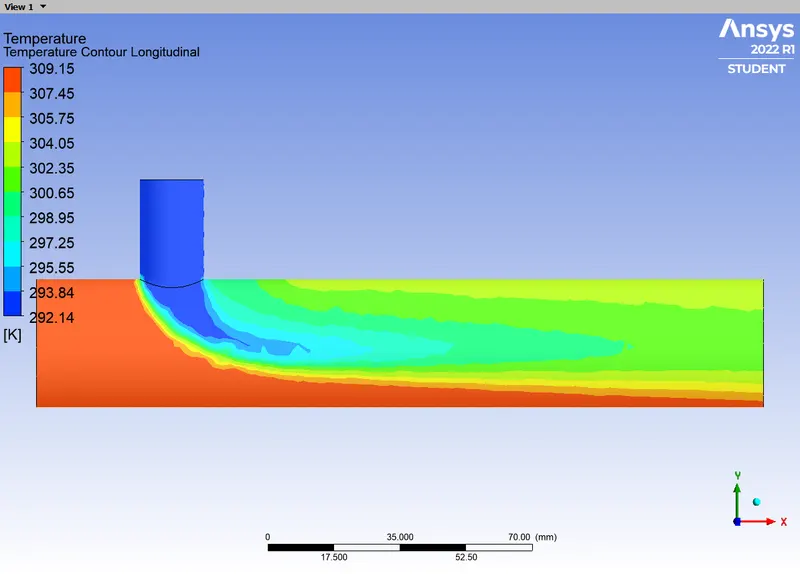
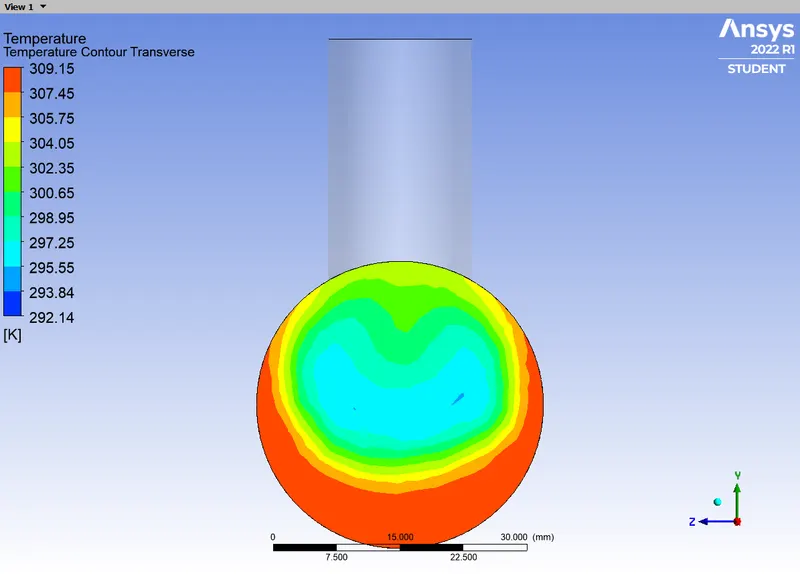
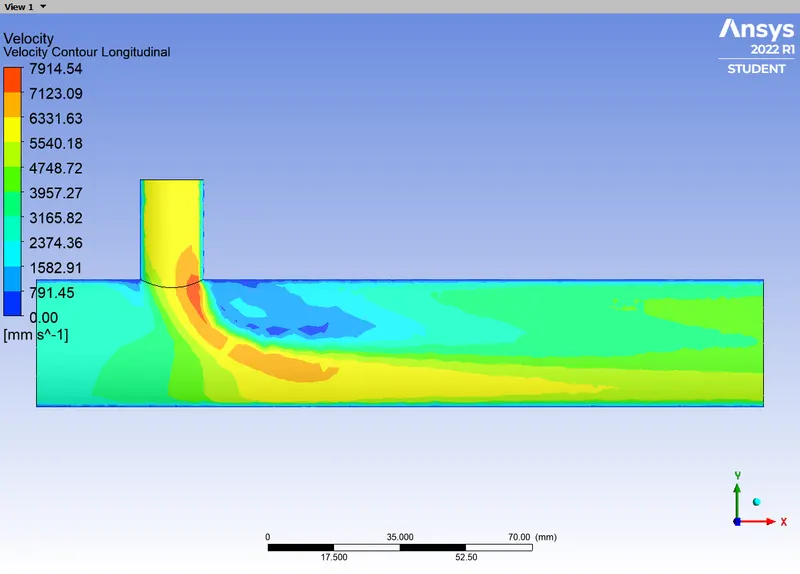
- Element size `2` mm (`106587` elements)
- Convergence plot:
- Contours
- Temperature
- Longitudinal Plane:
- Transverse Plane:
- Longitudinal Plane:
- Velocity
- Longitudinal Plane:
- Transverse Plane:
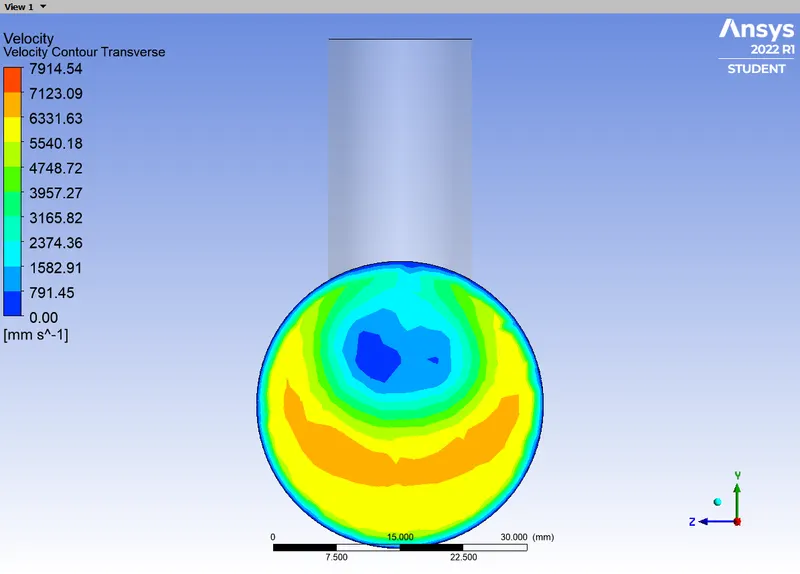
- Longitudinal Plane:
- Temperature
- Line plots
- Temperature
- Longitudinal Line:
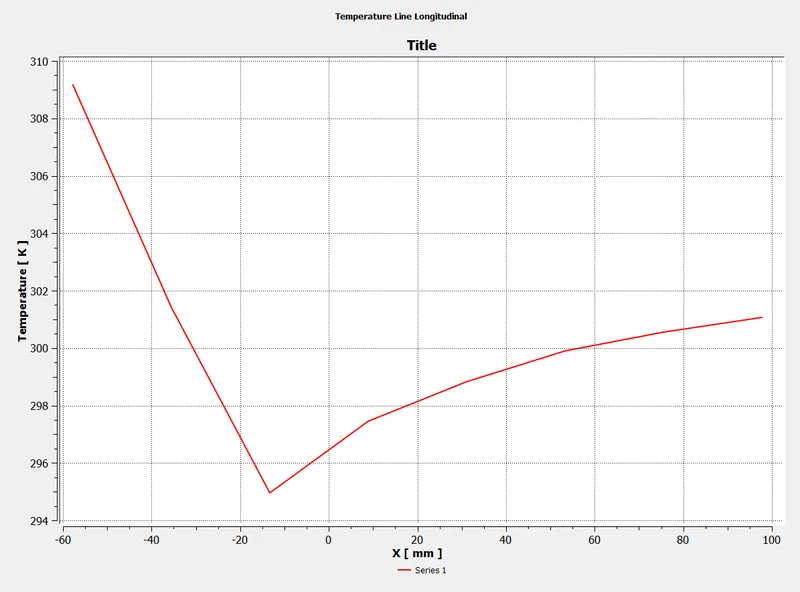
- Transverse Line:
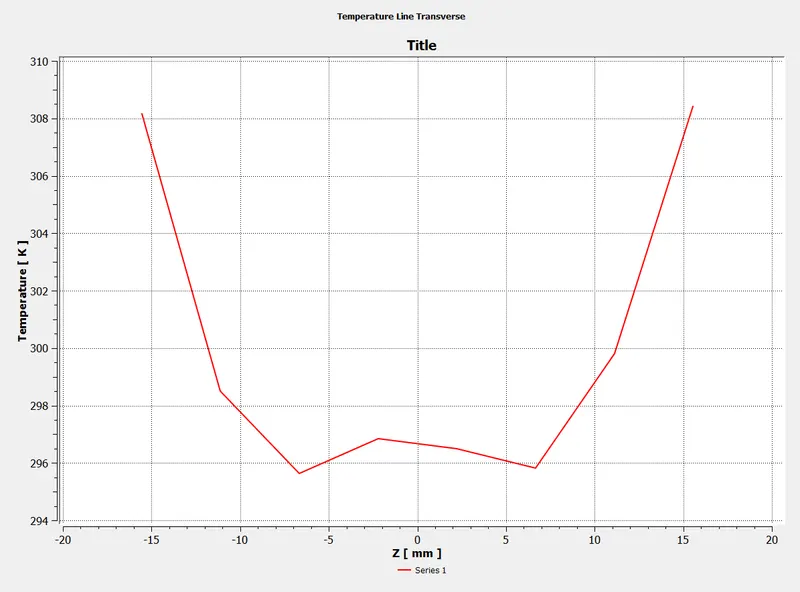
- Longitudinal Line:
- Velocity
- Longitudinal Line:
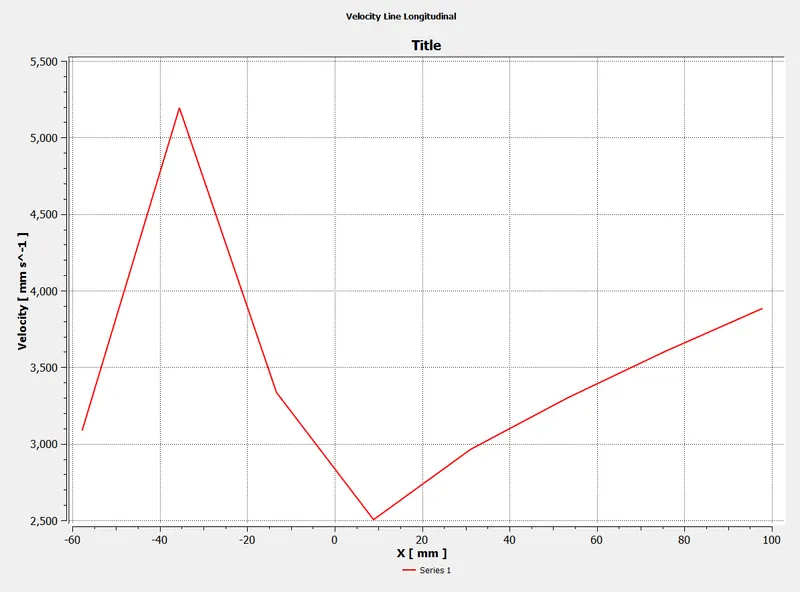
- Transverse Line:
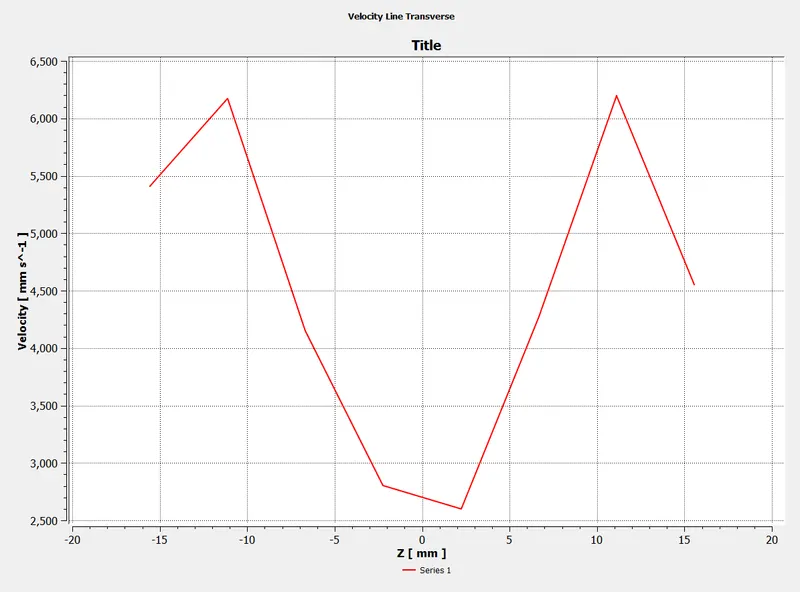
- Longitudinal Line:
- Temperature
- Convergence plot:
Conclusion:
The grid dependency test reveals that the solution is fairly independent of the mesh size for element sizes of `2` mm and lower. For the same momentum ratio, the average outlet temperature is fairly constant for both short and long tees. The average outlet temperature is nearly `30.25` (°C) and `27.5` (°C) respectively for momentum ratios `2` and `4`. Also, all these results are fairly independent of the turbulence model used in the analysis. For more focus on fluid behavior near the wall, the `k-omega` model is preferred whereas for more focus on fluid behavior away from the wall, the `k-epsilon` model is preferred. The `k-omega` SST model uses `k-omega` model near the wall and `k-epsilon` model away from the wall. Thus, the turbulence models and the tee lengths do not create much difference in this case. The outlet temperature drops with increase in the momentum ratio.