Week 1- Mixing Tee
Problem Statement:
Campare the mixing effectiveness for:
a) For different velocity inlets and short mixing tee configuration.
b) For different velocity inlets and long mixing tee configuration.
Challenge:
- Comapre which turbulence model is better in agreement with the analytical results with reason.
- Case 1
- Short mixing tee with a hot inlet velocity of 3m/s.
- Momentum ratio of 2, 4.
- Case 2
- Long mixing tee with a hot inlet velocity of 3m/s.
- Momentum ratio of 2, 4.
Compare the following for the above two cases:
- Cell count
- Average outlet temperature
- Number of iterations for convergence
Expected Results:
- Velocity and temperature contour plots on the cut planes along and across the pipe.
- Velocity and temperature line plots along and across the length of the pipe.
- Perform Mesh independent study for any one case.
- Discuss the effect of length and momentum ratio on results.
=============================================================================
Model:
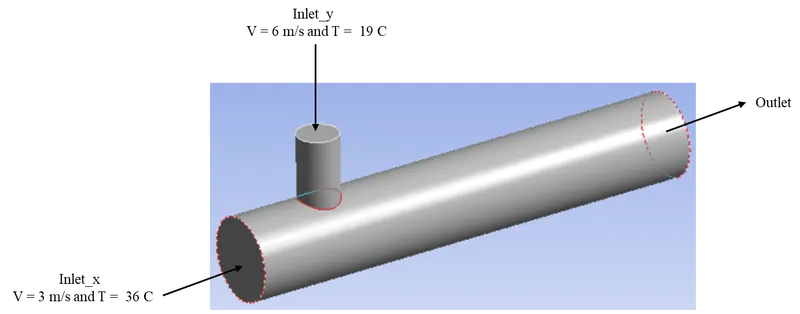
Velocity calculation:
Momentum ratio = velocity at cold inlet / velocity at hot inlet => 2 = velocity at cold inlet / 3m/s => Velocity at cold inlet = 6m/s.
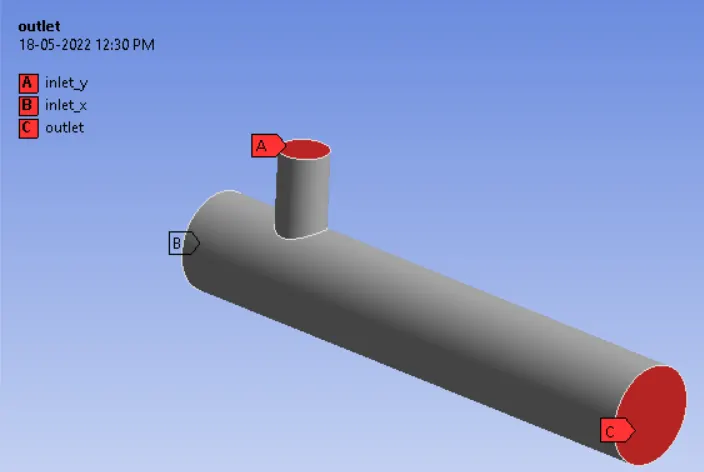
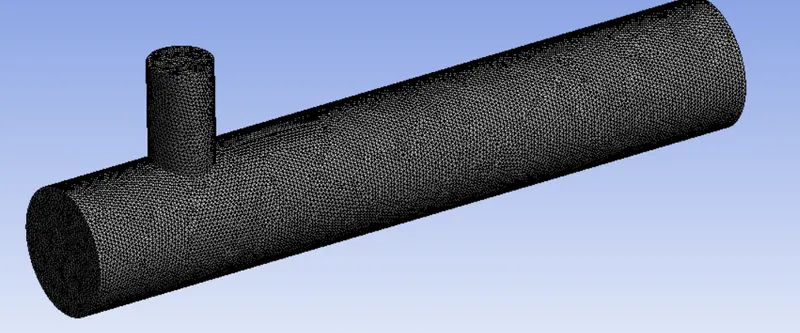
Mesh:
==============================================================================
COMPARISON OF THE TWO TURBULENCE MODEL
The Mixing Tee model was simulated using Ansys Fluent.
Following test parameters were considered for the selection of the turbulence model.
- Mesh element size: 1.1 mm (same for both the cases)
- Number of elements: 4,56,508 (same for both the cases) (Student version = 5,12,000)
- Number og Iterations: k-omega = 190 and k-epsilon = 150
- Average Temperature at the outlet:
| k-omega | k-epsilon | Analytical |
| 30.467 C | 30.382 C | 28.004 C |
k-omega:

k-epsilon:

NOTE: Is shows "outlet_k_omega_short_2" because geometry and mesh information was referenced from k-omega.
Analytical:
`T_(mixture) = (dot(m)_(hot)*T_(hot) + dot(m)_(cold)*T_(cold))/(dot(m)_(hot)+dot(m)_(cold))`
`T_(mixture) = 28.004 C`
NOTE: The error can be reduced by increasing the number of mesh elements or decreasing the size of mesh element.
Therefore, from above statistics we consider k-epsilon model for further investigation for other cases.
Reasons:
a) It took less iterations to converge when compared to k-omega model and did not have much difference in the value of average temperature at the outlet.
==============================================================================
Mesh Independence Study:
Considering case:
- Short mixing tee with a hot inlet velocity of 3m/s.
- Momentum ration = 2
- Therefore, cold outlet velocity = 6m/s.
- k-epsilon model on above presented stats.
a) Mesh element size: 1.1 mm
Mesh Quality:
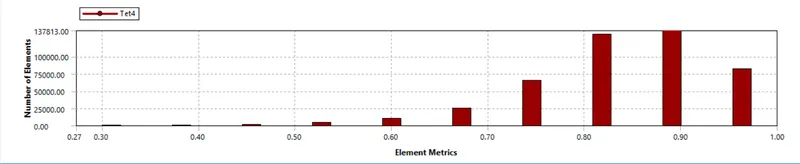
The elements are well above 5% criteria. So we are good to go.

Observation:
- Mesh quality is more than 5%.
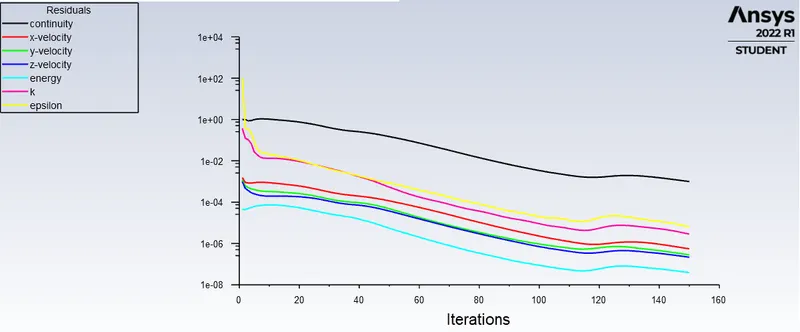
- It took 150 iterations to converge.
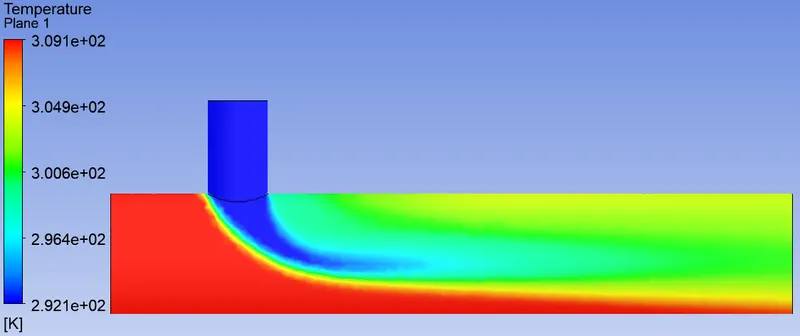
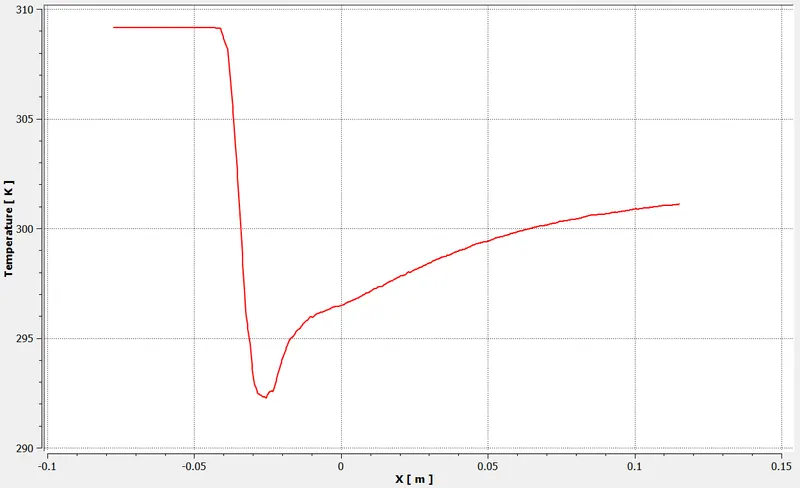
- T_(mixture) = 30.48 C.
Residual Graph:
XY Plane Temperature data:
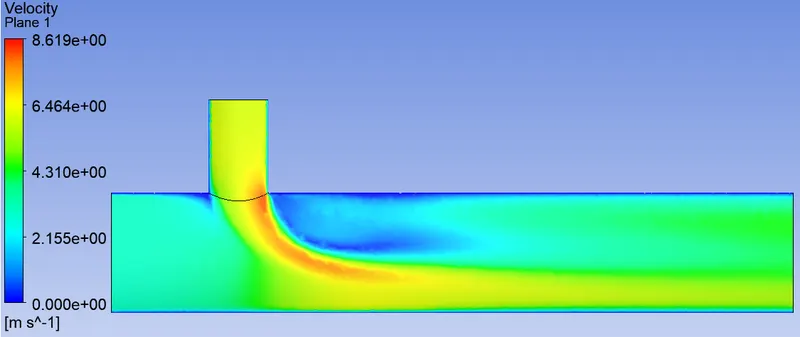
XY Plane Velocity data:
Temperature graph along the centerline:
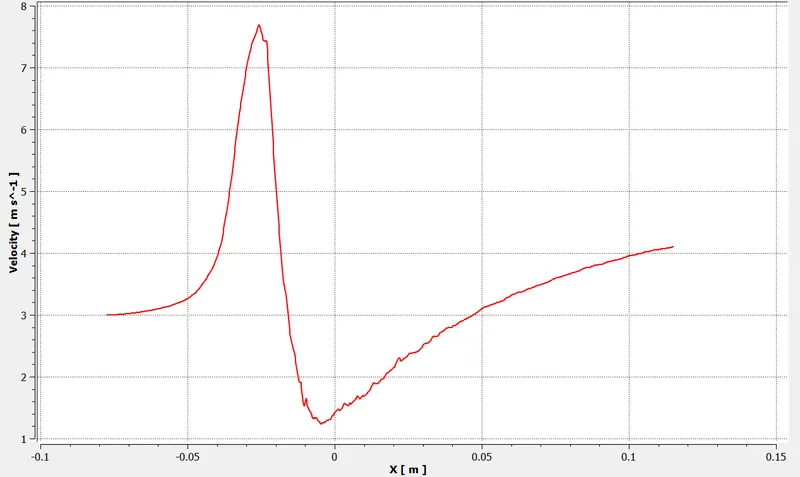
Velocity graph along the centerline:
b) Mesh element size: 5 mm
Mesh Quality:
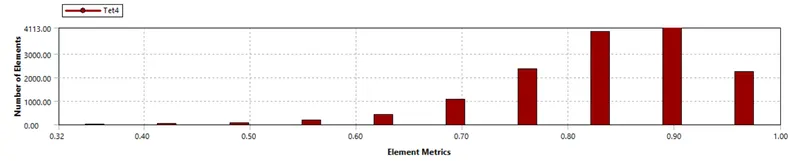
The elements are well above 5% criteria. So we are good to go.

Observation:
- Mesh quality is more than 5%.
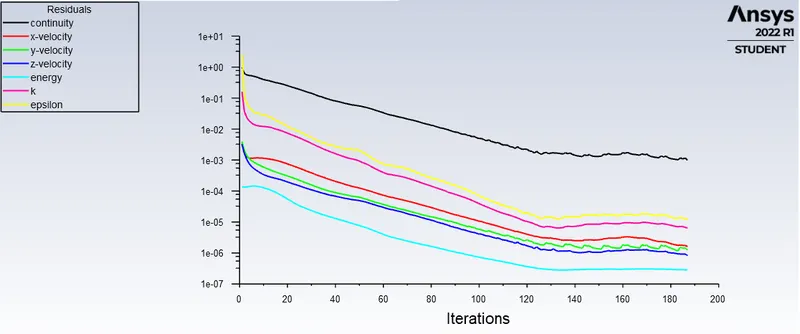
- It took 187 iterations to converge.
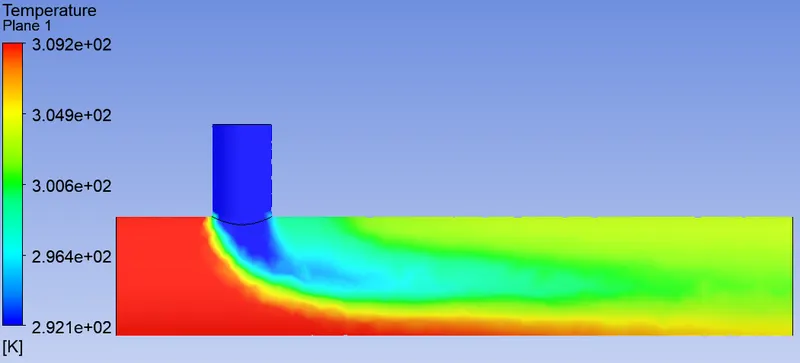
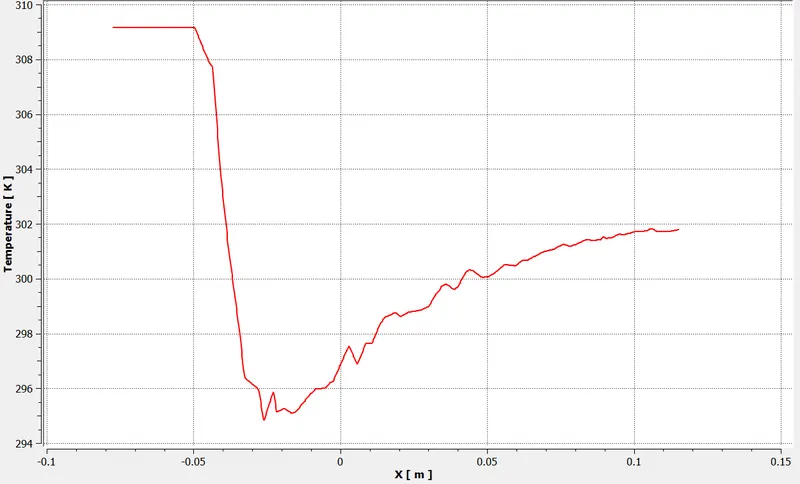
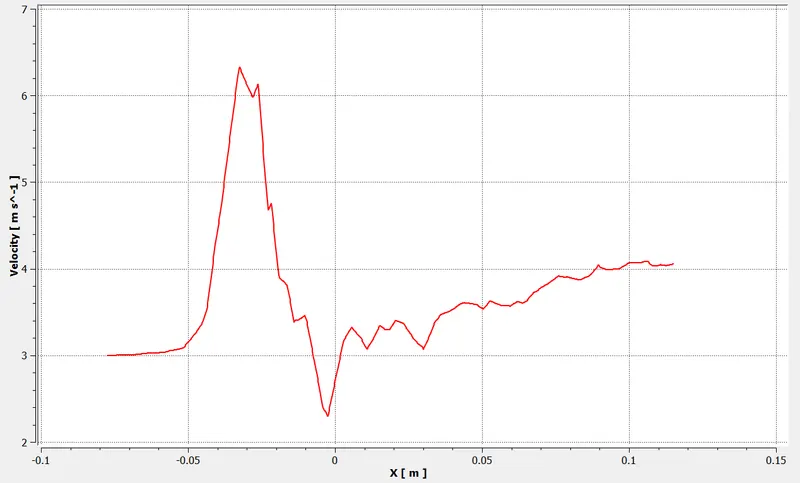
- T_(mixture) = 30.26 C.
Residual Graph:
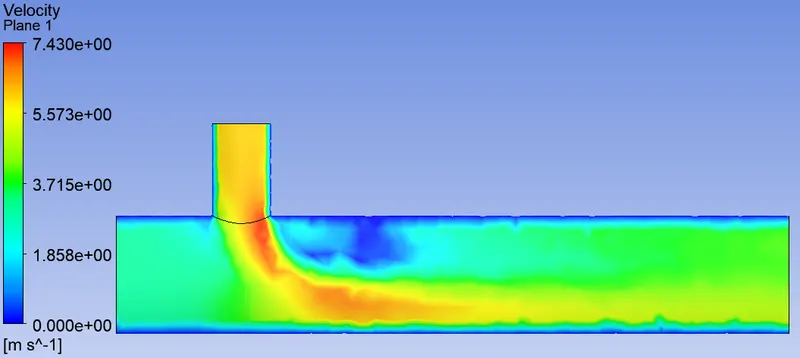
XY Plane Temperature data:
XY Plane Velocity data:
Temperature graph along the centerline:
Velocity graph along the centerline:
c) Mesh element size: 10 mm
Mesh Quality:
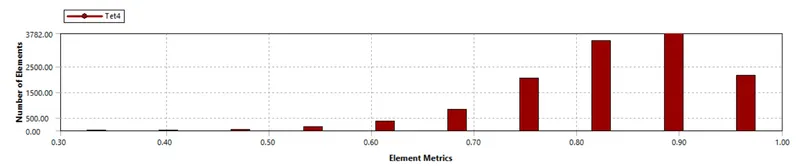
The elements are well above 5% criteria. So we are good to go.

Observation:
- Mesh quality is more than 5%.
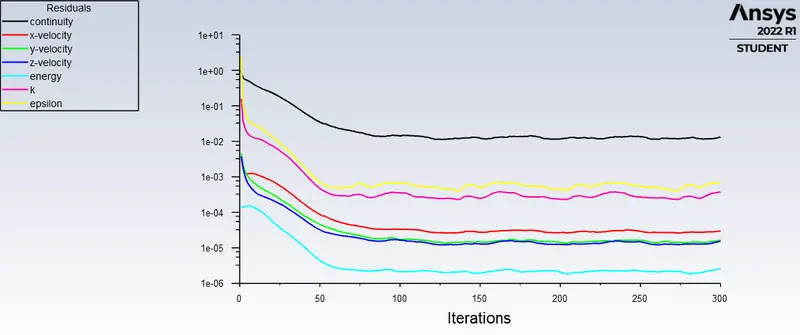
- It took 300 iterations to converge.
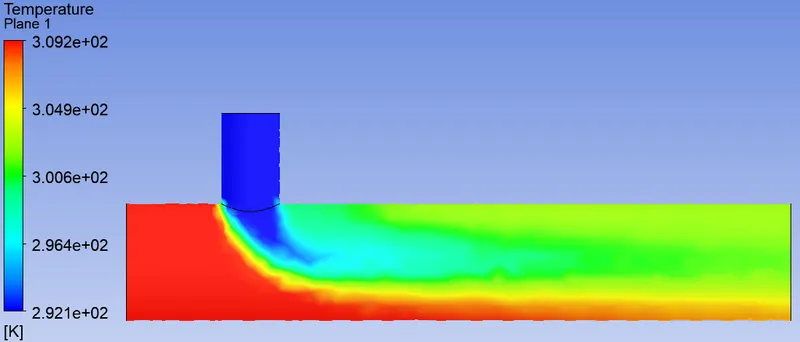
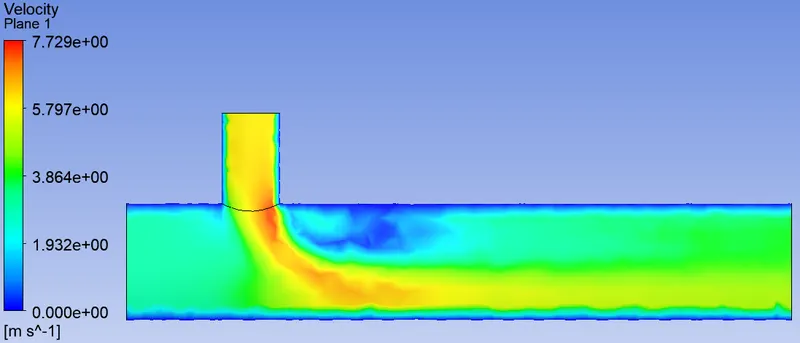
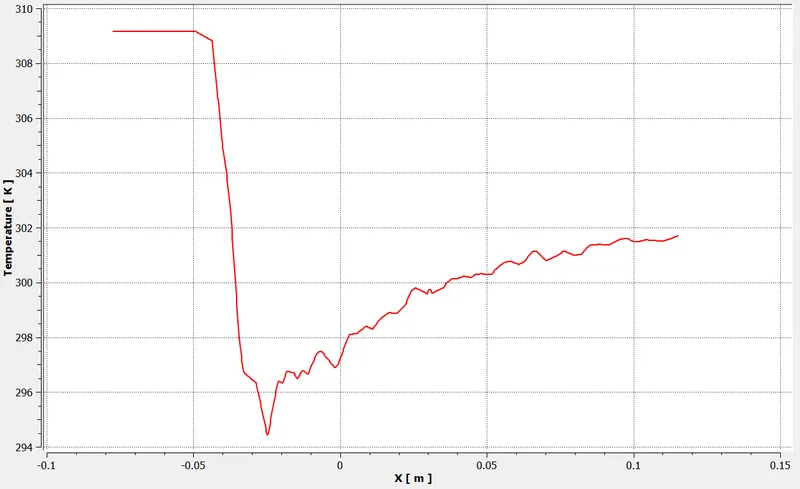
- T_(mixture) = 30.21 C.
Residual Graph:
XY Plane Temperature data:
XY Plane Velocity data:
Temperature graph along the centerline:
Velocity graph along the centerline:
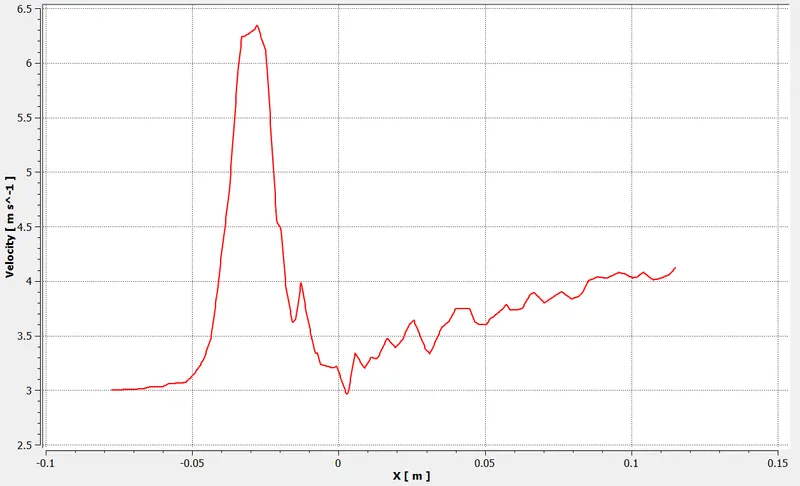
Conclusion from above analysis:
- From above data we conclude that for bigger element size, it takes more number of iterations to converge.
- With finner mesh quality, we get more accurate results throught the domain; this is quite evident from the graph and contours.
==============================================================================
Comparing Case 1 (a) and Case 1 (b):
Case 1:
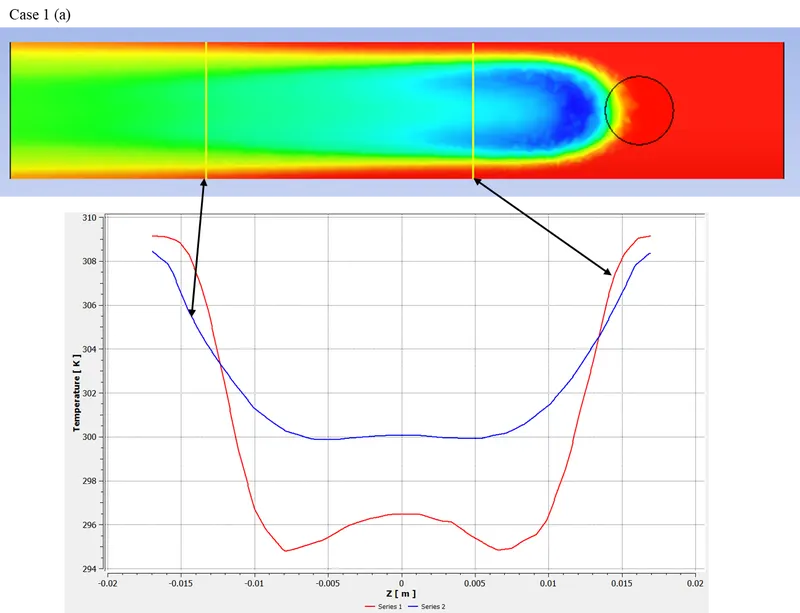
a) Short mixing tee with a hot inlet velocity of 3m/s and momentum ratio of 2.
Momentum ratio = velocity at cold inlet / velocity at hot inlet
v_hot = 3m/s, Therefore, v_cold = 6m/s
Considering mesh element size as 1.1 mm.
Case 1:
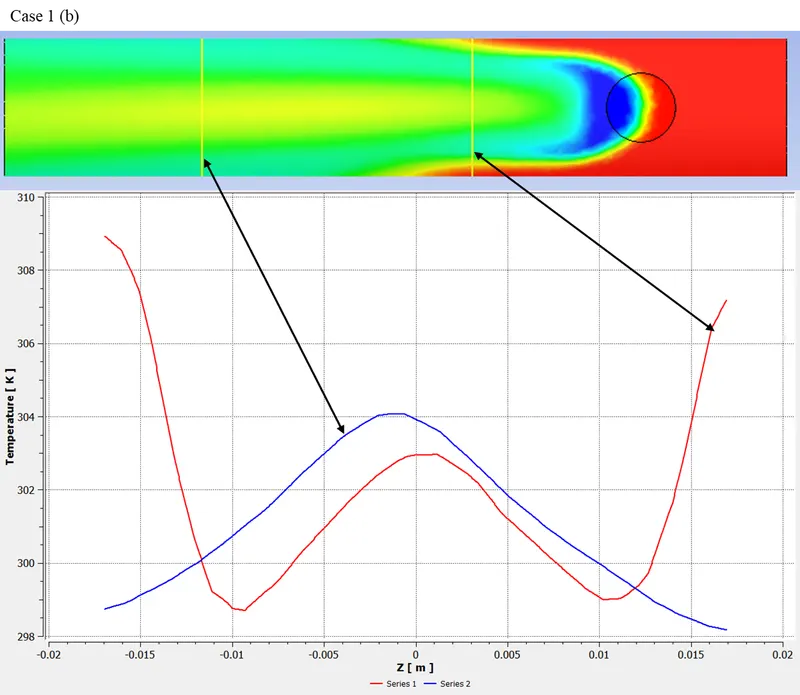
b) Short mixing tee with a hot inlet velocity of 3m/s and momentum ratio of 4.
Momentum ratio = velocity at cold inlet / velocity at hot inlet
v_hot = 3m/s, Therefore, v_cold = 12m/s
Considering mesh element size as 1.1 mm.
Observation:
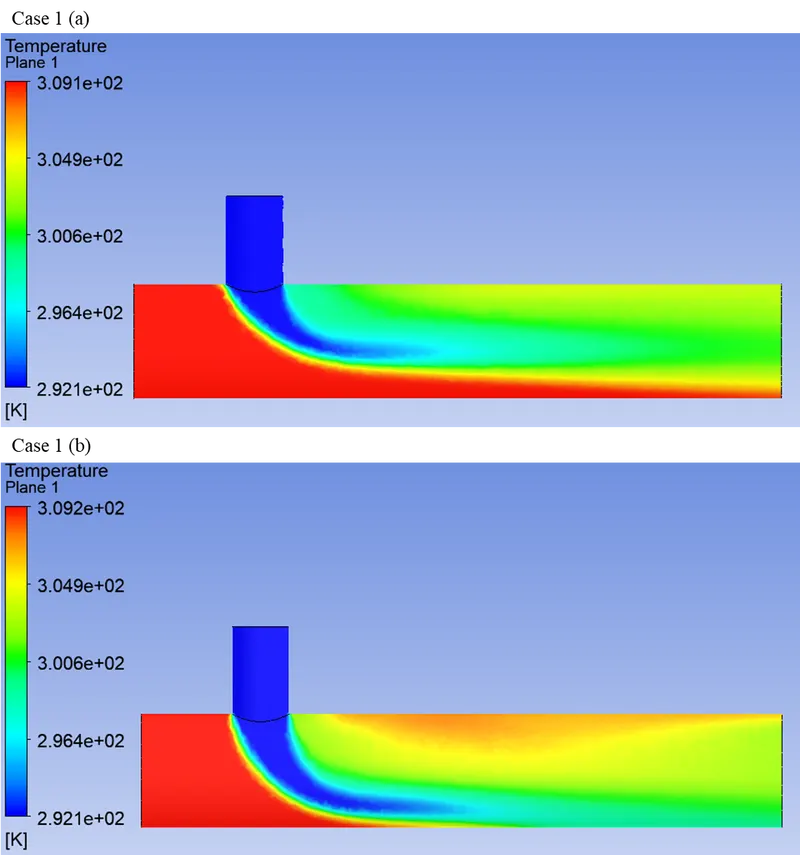
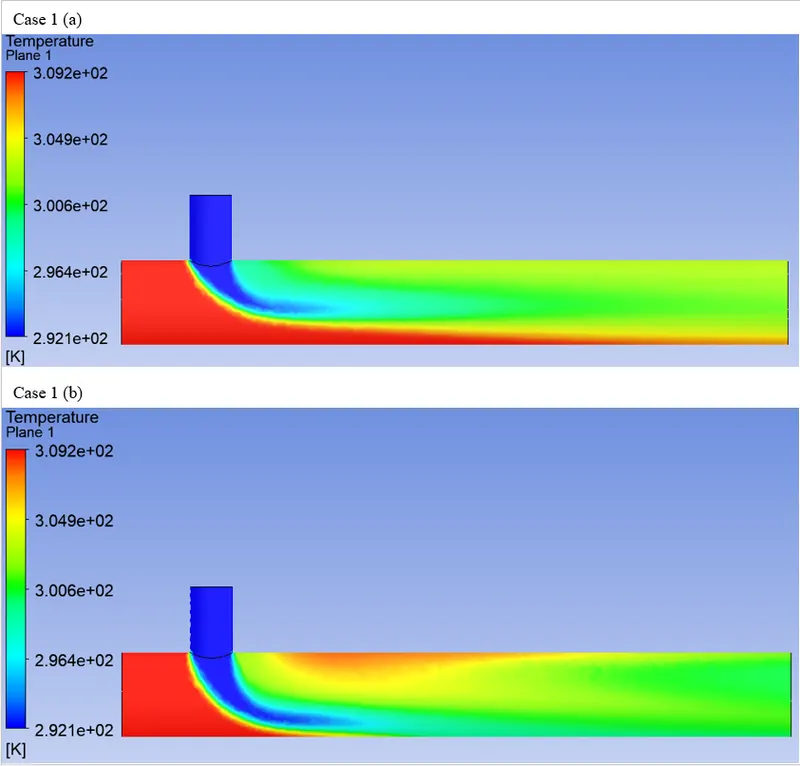
1) Temperature Contour XY Plane:
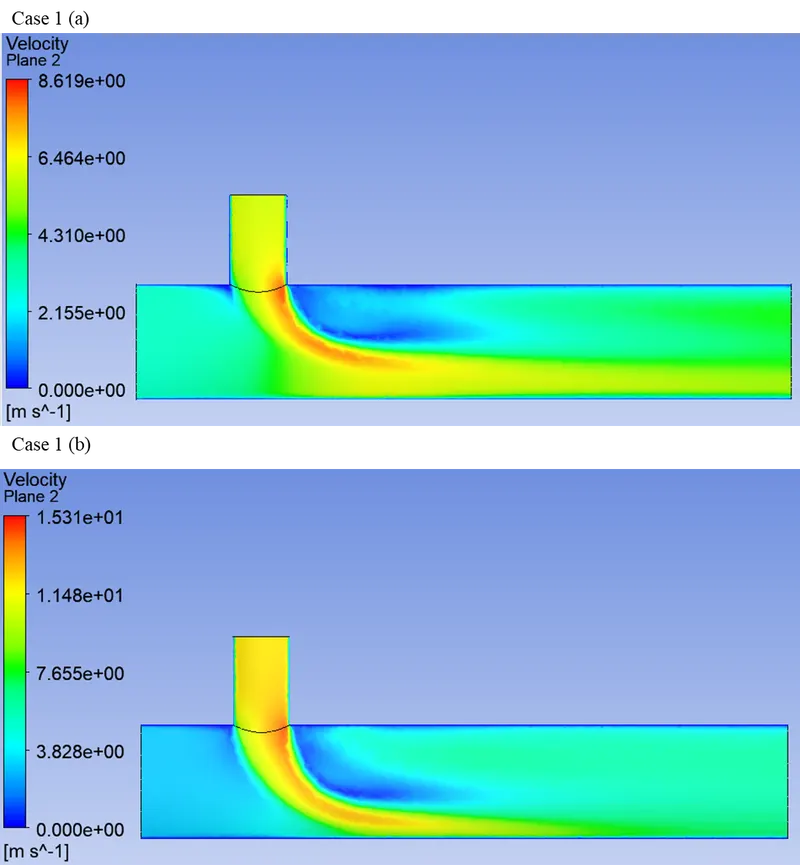
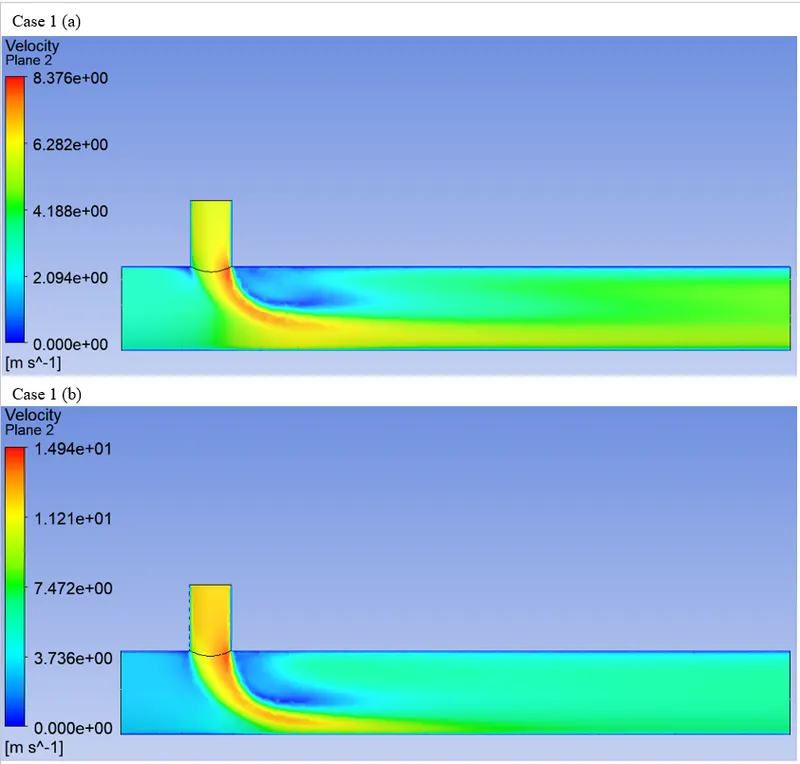
2) Velocity Contour XY Plane:
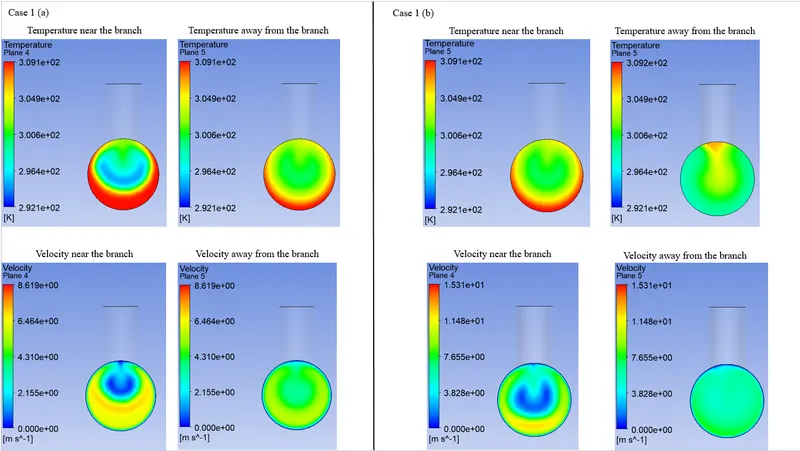
3) Temperature and Velocity in YZ Plane:
Graph from simulation:
Conclusion from the graphs and contours:
- From above analysis we can say that, the mixing effectiveness is better for the case 1 (b) ie with momentum ratio = 4.
- In case 1 (a) we still have high temperature near the wall along the length of pipe. But for second case the walls have less temperature compared to hot inlet temperature.
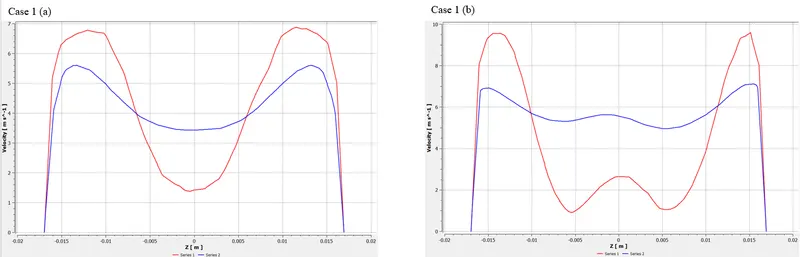
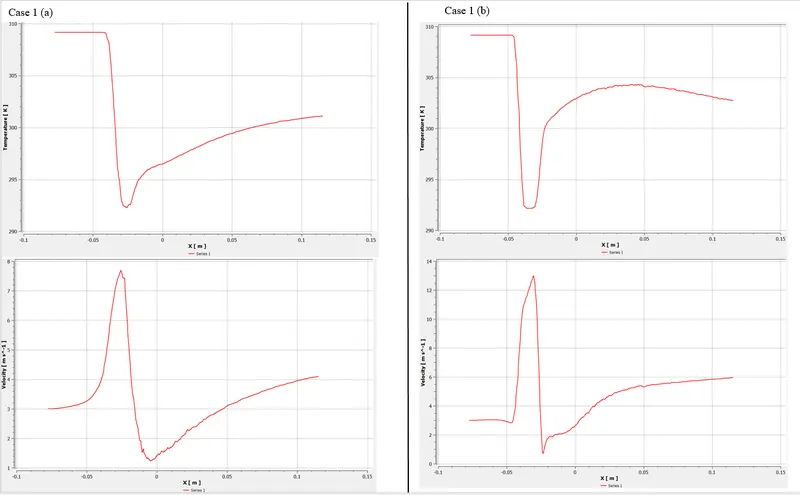
- Case 1(b) has better velocity and temperature distribution along the length of pipe. Therefore, increasing mixing effectiveness.
- This concludes that mixing is better in case 1(b).
Additional graphs:
Veloicty distribution along z axis:
Temperature and Velocity along the length of the pipe:
==============================================================================
Comparing Case 2 (a) and Case 2 (b):
Case 2:
a) Long mixing tee with a hot inlet velocity of 3m/s and momentum ratio of 2.
Momentum ratio = velocity at cold inlet / velocity at hot inlet
v_hot = 3m/s, Therefore, v_cold = 6m/s
Considering mesh element size as 1.3 mm.
Case 2:
a) Long mixing tee with a hot inlet velocity of 3m/s and momentum ratio of 4.
Momentum ratio = velocity at cold inlet / velocity at hot inlet
v_hot = 3m/s, Therefore, v_cold = 12m/s
Considering mesh element size as 1.3 mm.
Observation:
1) Temperature Contour XY Plane:
Correction*: Case 2 (a and b)
2) Velocity Contour XY Plane:
Correction*: Case 2 (a and b)
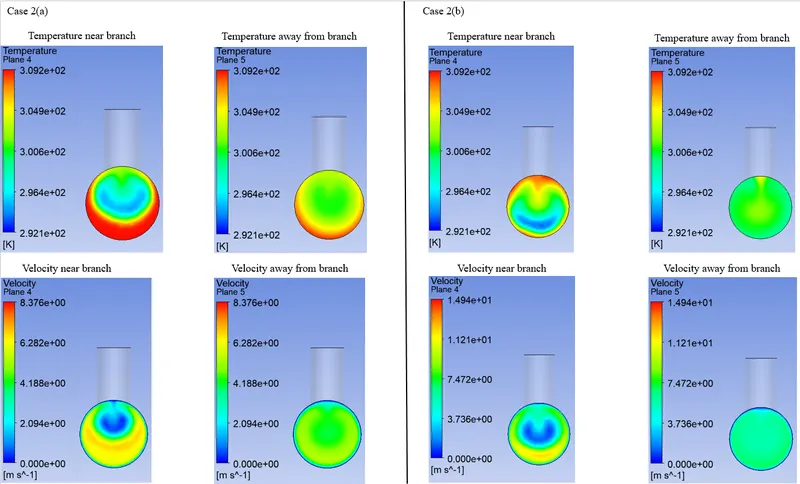
3) Temperature and Velocity in YZ Plane:
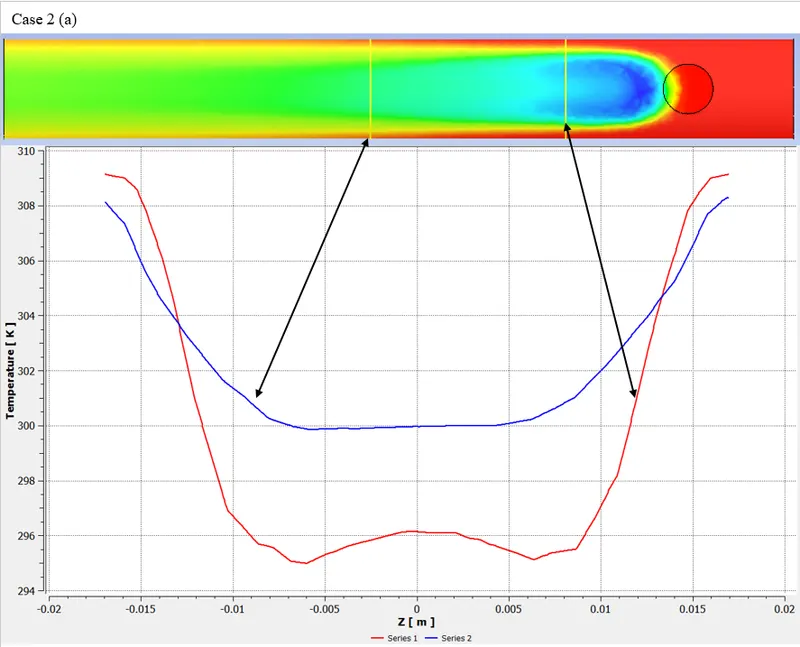
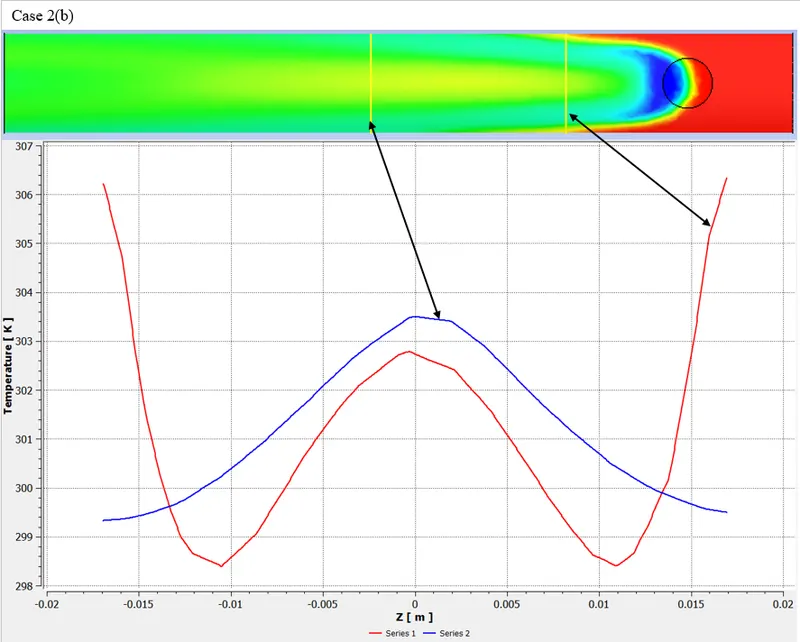
Graph from simulation:
Conclusion from the graphs and contours:
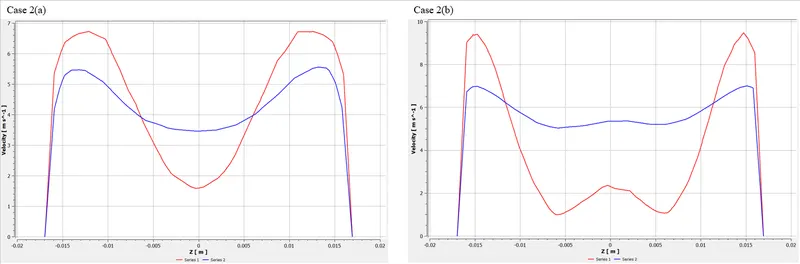
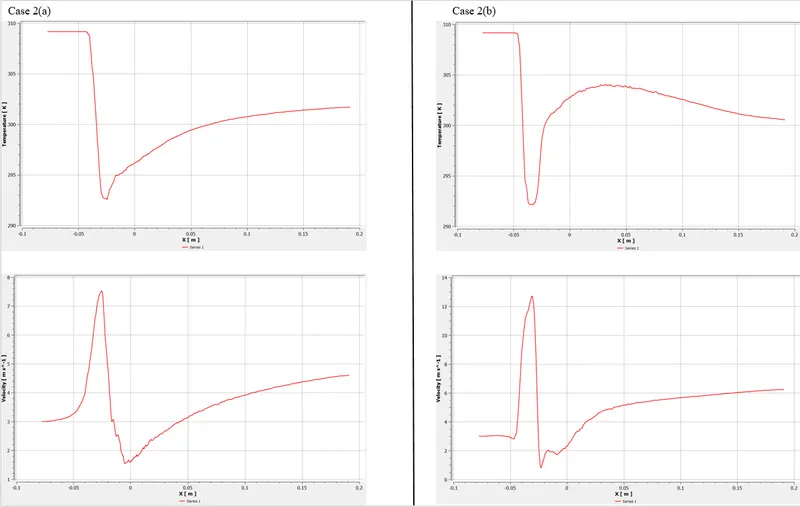
- From above graphs and contours we can conclude that mixing effectiveness is better for case 2(b).
- In fact it seems to be the best case among all the four cases.
- Near the walls, the temperature is less than hot inlet temperature.
- Values for T_(mixture) is pretty close to the analytical solution.
- The mixing close to branch is much better in case 2(b). Therefore, as we go further away from the pipe, the temperature is greater than the cold inlet and less than the hot inlet, which is a good indication of proper mixing.
Additional graphs:
Veloicty distribution along z axis:
Temperature and Velocity along the length of the pipe:
==============================================================================
EFFECT OF LENGTH AND MOMENTUM RATIO:
- Increasing the velocity, the flow tends to rush near the walls of the pipe. It is evident in case 1(b) that temperature near the wall along the pipe tends to decrease, this is true for case 2(b).
- Case 2 (a) is more effective than case 1(a) when it comes to mixing.
- Overall when cosidering length and momentum ratio, it should have longer length and high momentum ratio for better mixing and for better temperature of mixed fluid.
==============================================================================
SUMMARY TABLE:
| CELL COUNT | AVG OUTLET TEMPERATURE | NO. OF ITERATION | |
| CASE 1 (A) | 4,56,508 | 30.38 C | 150 |
| CASE 1 (B) | 4,56,508 | 27.54 C | 222 |
| CASE 2 (A) | 4,12,743 | 30.43 C | 155 |
| CASE 2 (B) | 4,12,743 | 27.47 C | 300 |
==============================================================================