Week 1: Channel flow simulation using CONVERGE CFD
Aim- Channel flow simulation using CONVERGE CFD
Introduction – From this task we will learn the basics to run the simulation and its analysis. we will be runing the cases for three grid szes and compare there contours, mesh and other important parameters.
Steps –
- Geometry
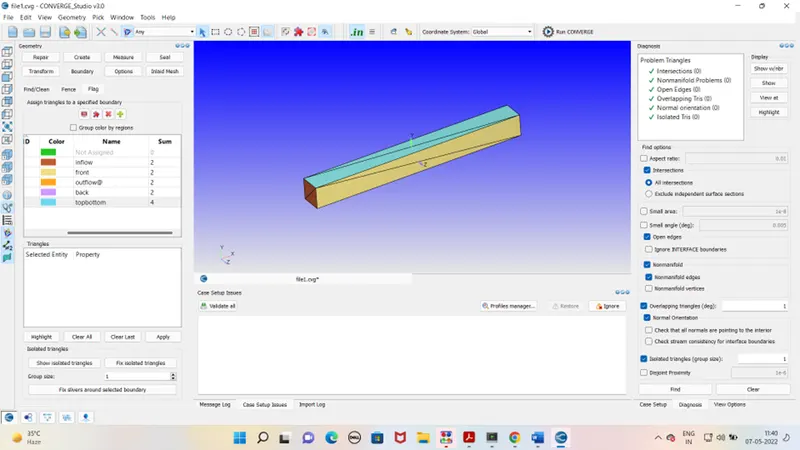
- Define the boundary
- Case setup
- Simulation
- Post processing
- Outputs
- Conclusion
Geometry –
create the box as per mention dimension shown below
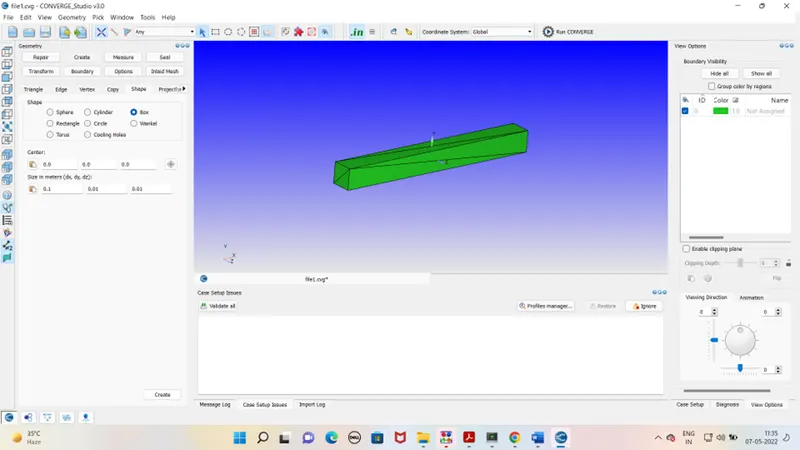
After gemotery completion assign the triangle to the repective boundaries and check th geometry for any problems through diagonisis tab .
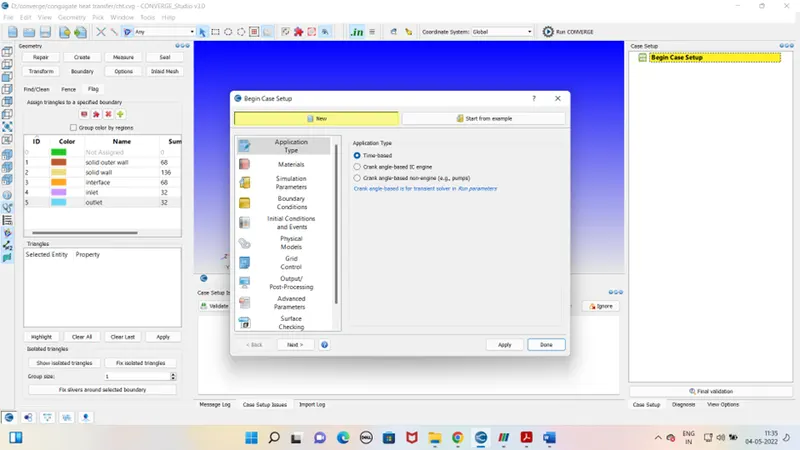
Case setup –
Application type –
Pre defined mixture - Air
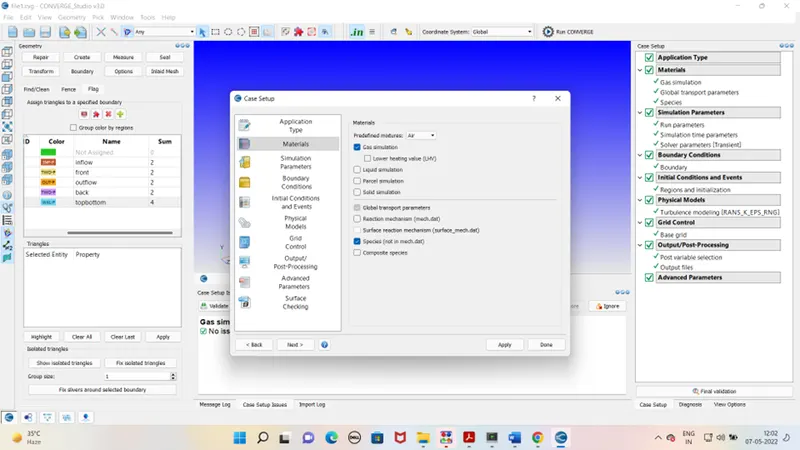
Gas simulation –
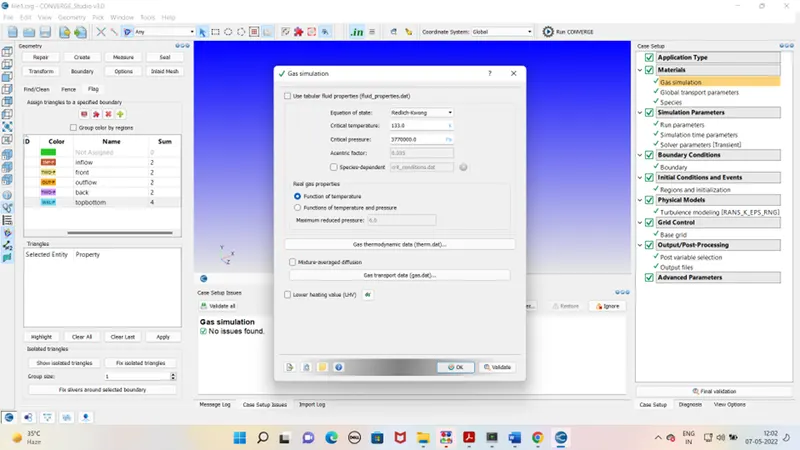
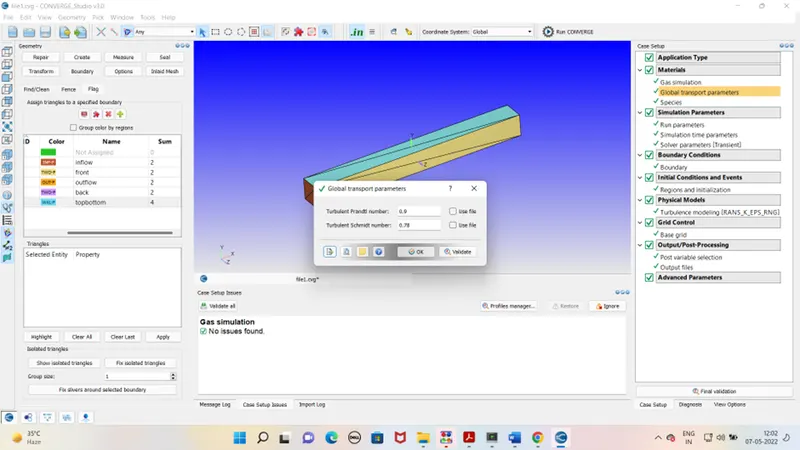
Global transport parameter –
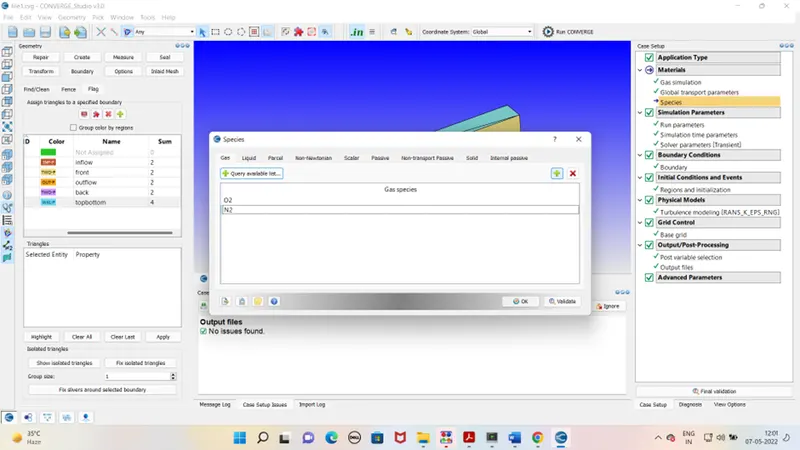
Species –
Simulation Parameter –
Run parameter –
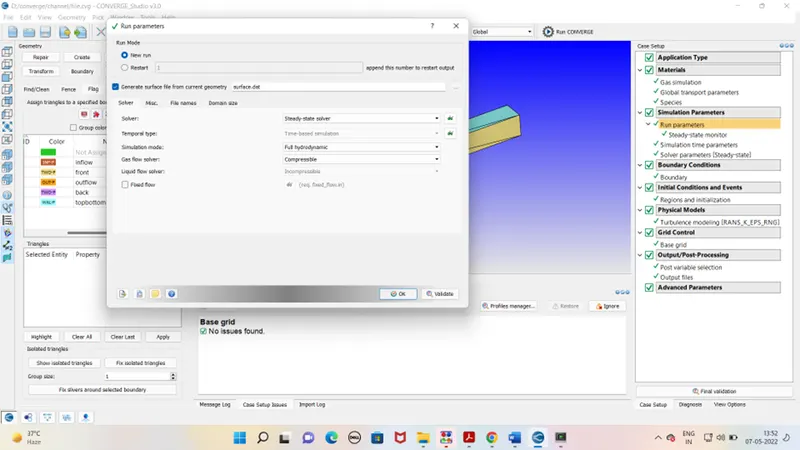
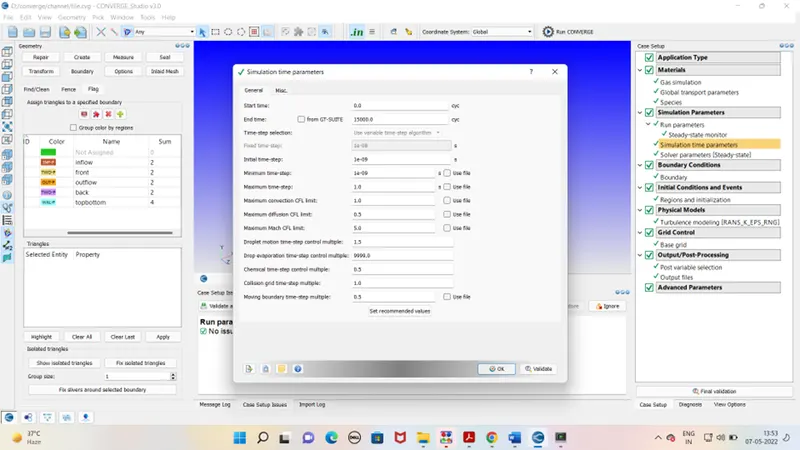
Simulation time parameters-
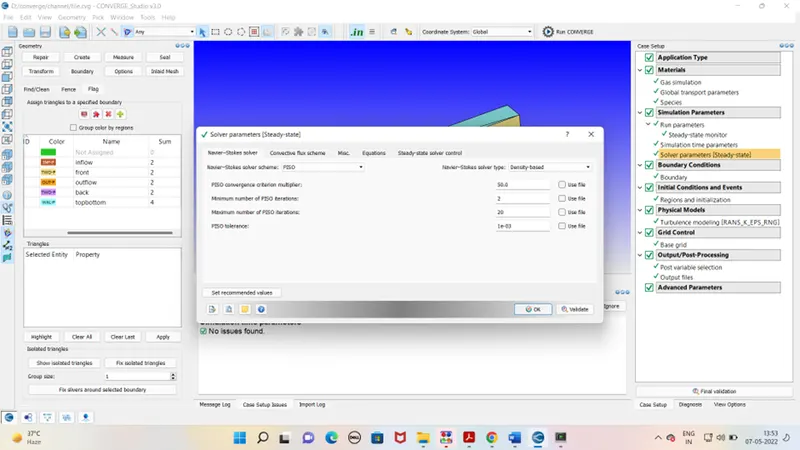
Solver parameters-
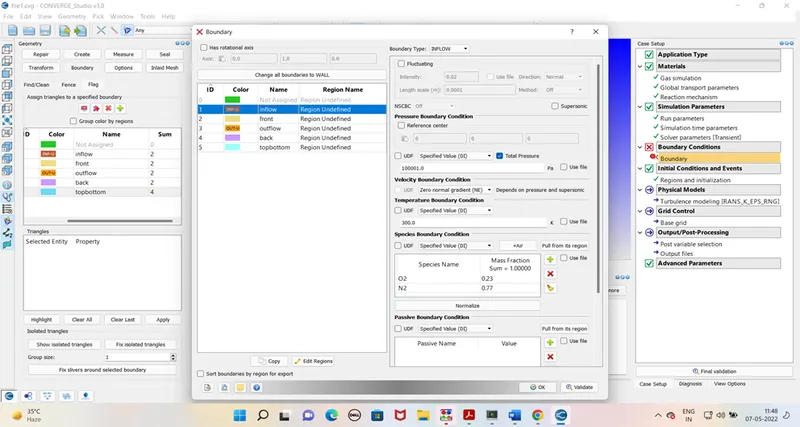
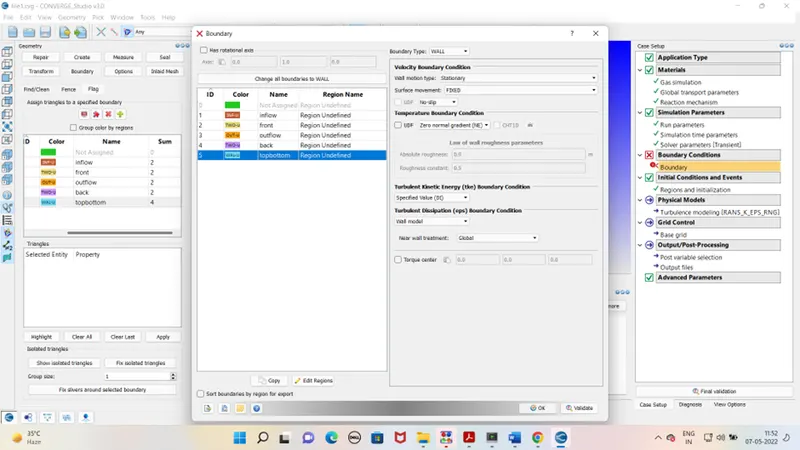
Boundary condition –
Inlet
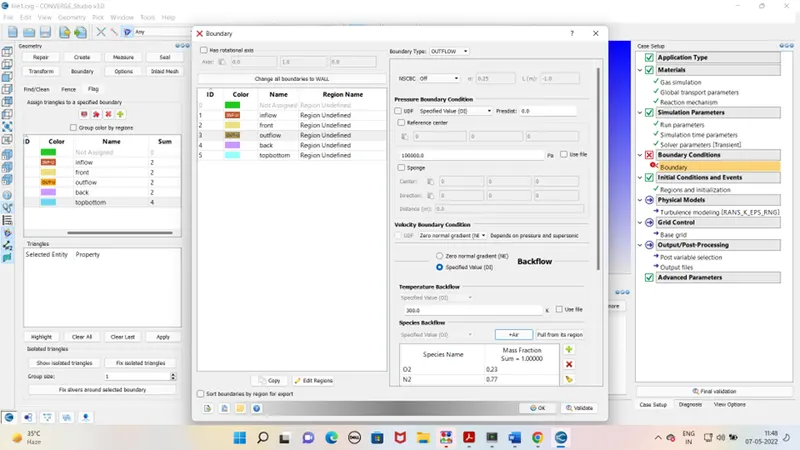
Outlet
Define Front and back side as 2D boundary type –
Top and bottom wall –
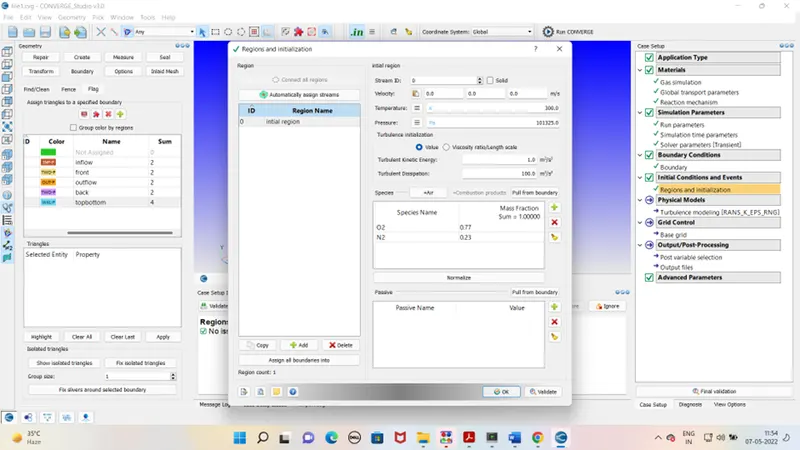
Intial condition and events –
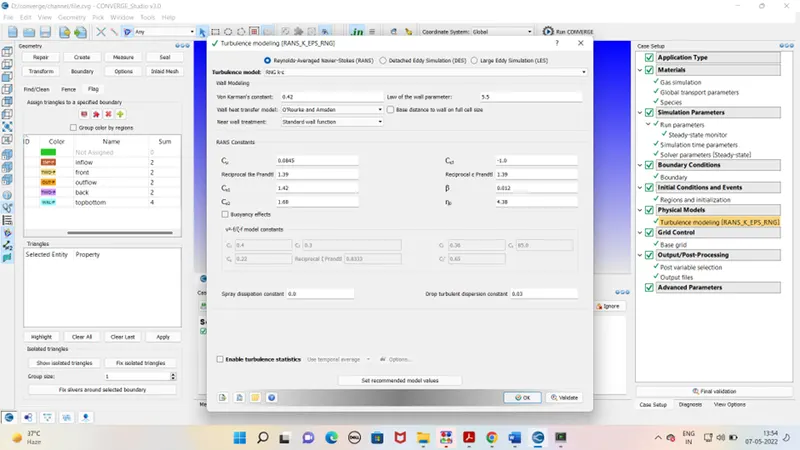
Physical models –
Grid control –
Remarks - As per task we have to run the simulation for thre cases that is 2 e-4 , 1e-4 and 1.5e-4 but in my pc the process was getting slow . so i have run the simulation as mentioned below
Case 1 - Base grid – dx - 0.002 dy –0.002 dz – 0.002
Case 2 - Base grid – dx - 0.0015 dy –0.0015 dz – 0.0015
Case 3 - Base grid – dx - 0.001 dy –0.001 dz – 0.001
Output processing Advanced parameter – Default
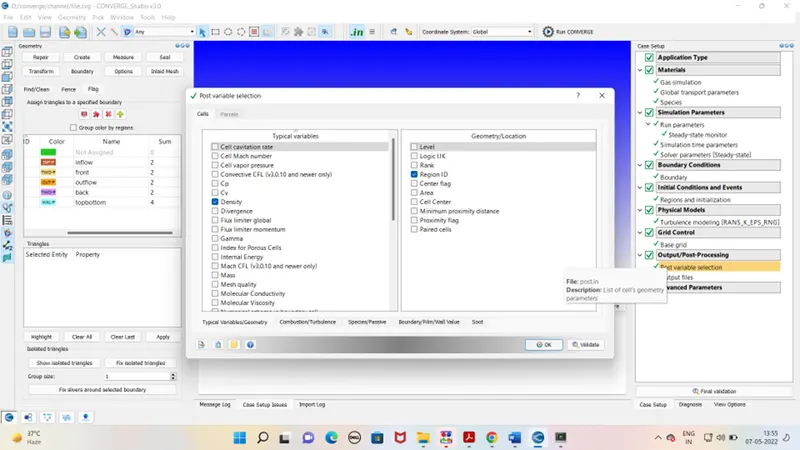
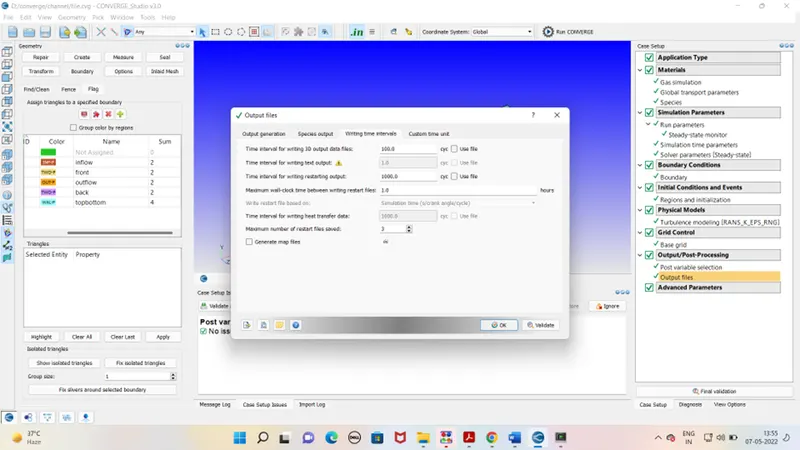
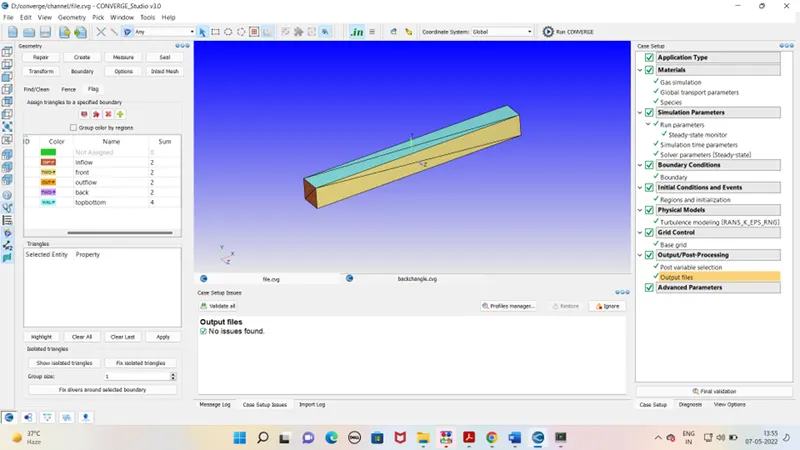
After case set up exports the file to defined folder. Run the simulation in the Cygwin. Generate the output files. As output file is generated run the post processing in Cygwin again. Open the output file in paraview for the mesh view and contours. For excessing pressure , velocity and mass flow rate use line plotting tab.
Outputs –
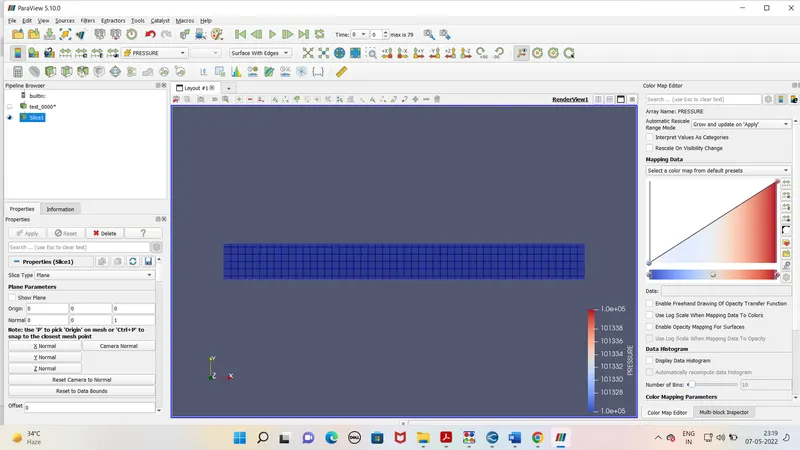
For grid size – 0.002
Mesh -
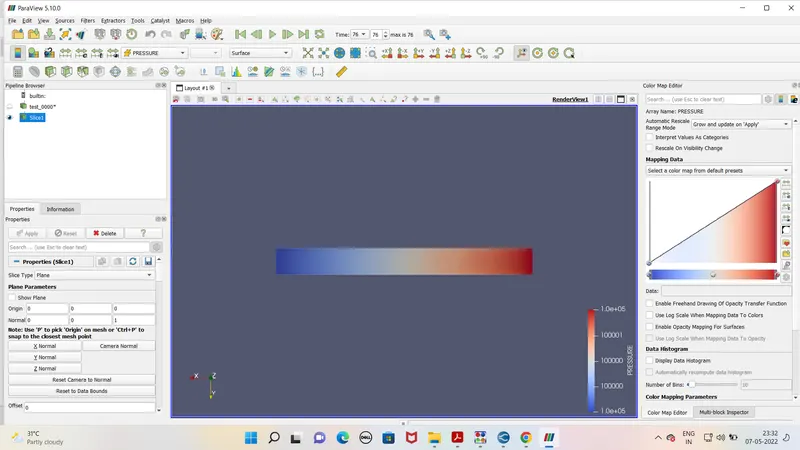
Pressure contour -
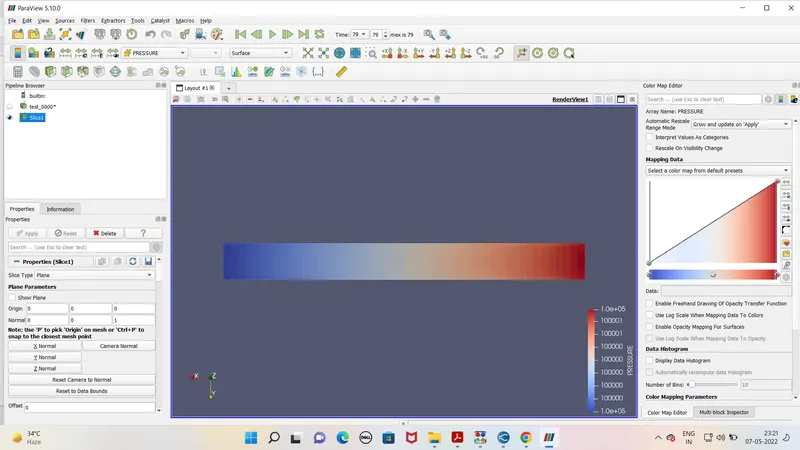
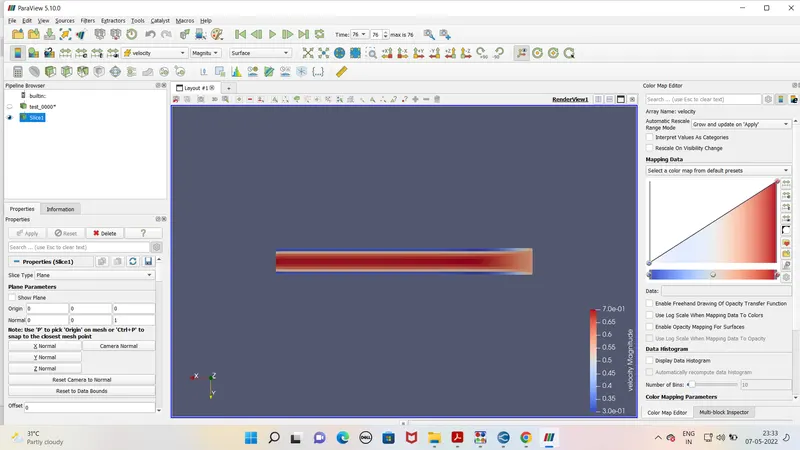
Velocity contour-
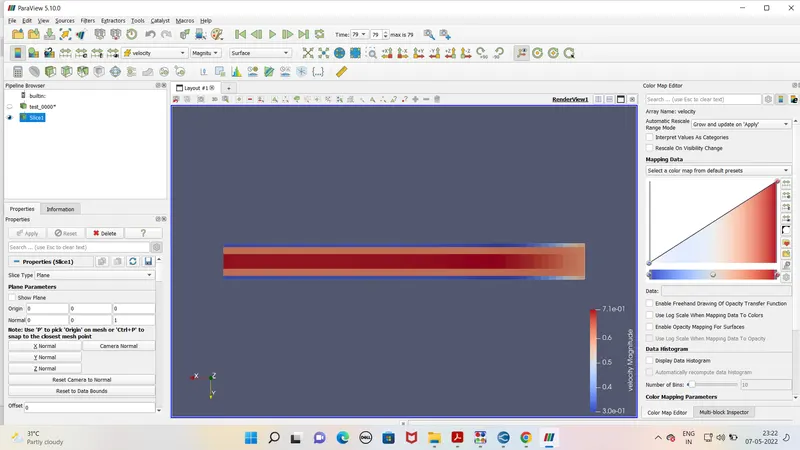
For grid size - .0015
Mesh
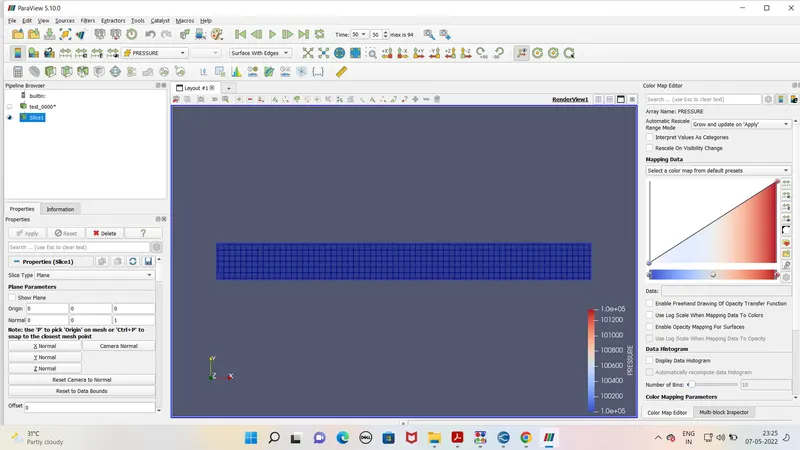
Pressure contour -
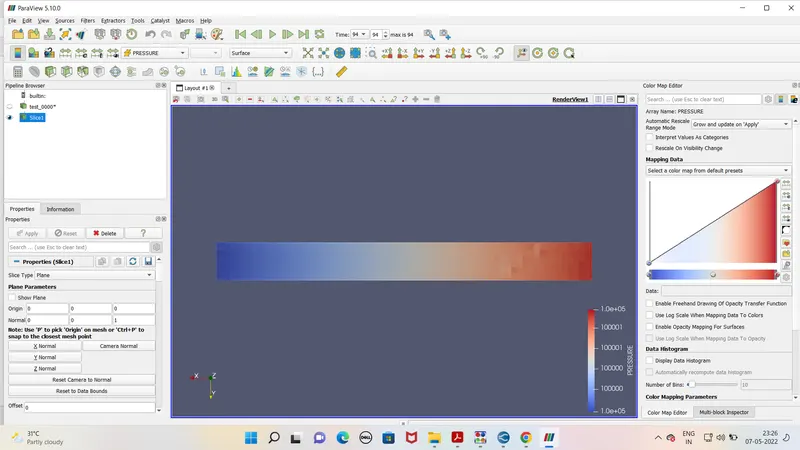
Velocity contour -
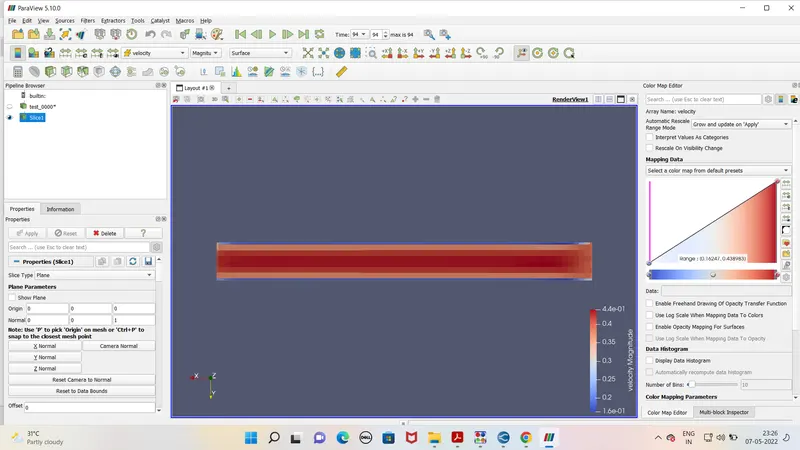
For grid size – 0.001
Mesh
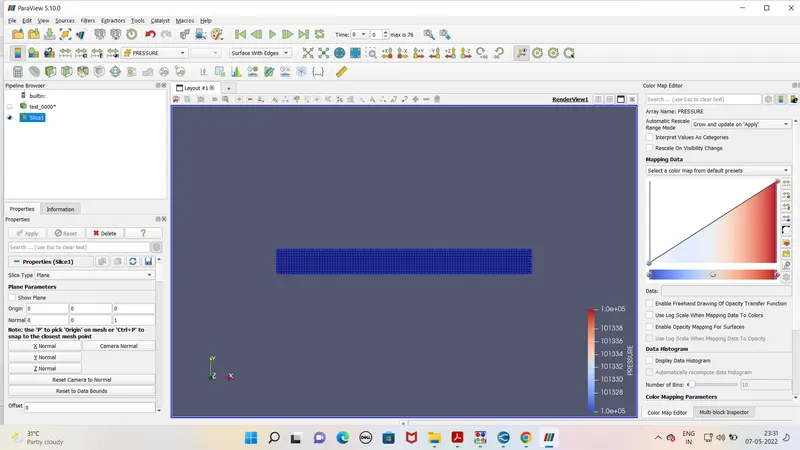
Pressure contour -
Velocity contour -
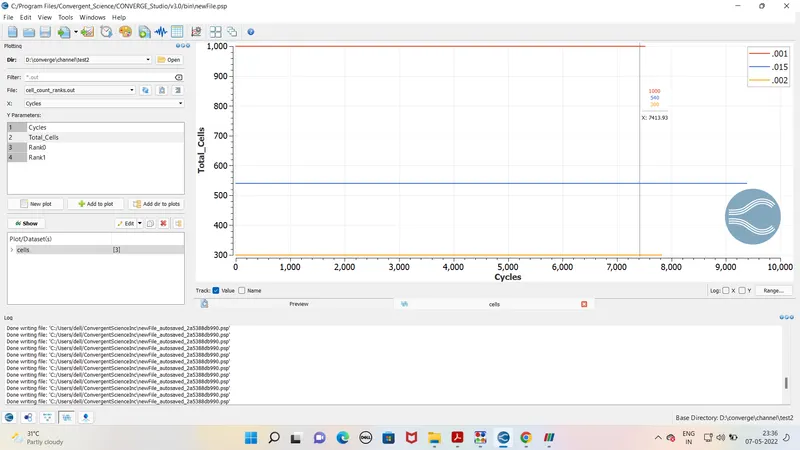
Total cells -
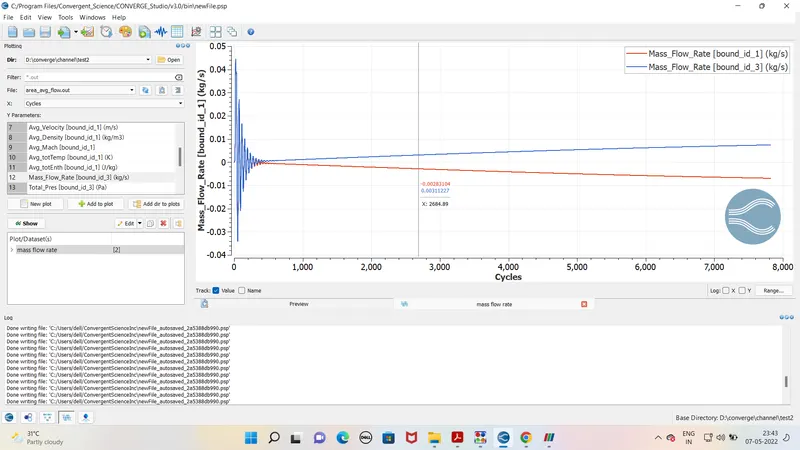
Mass flow rate for mesh size .002
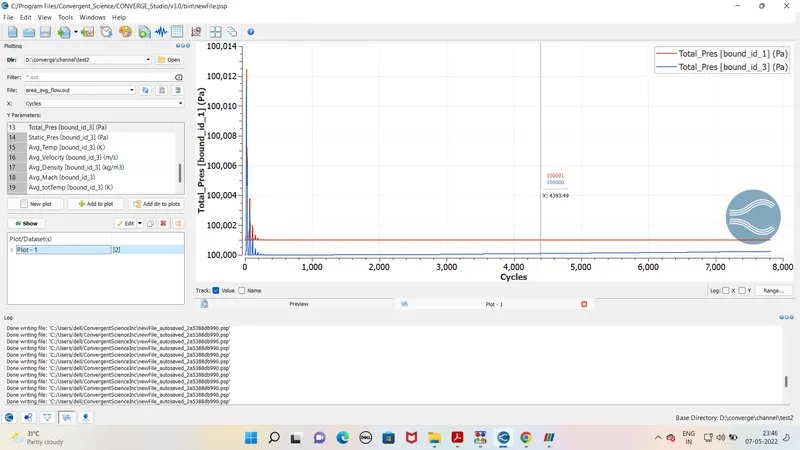
Pressure plot for mesh size .002
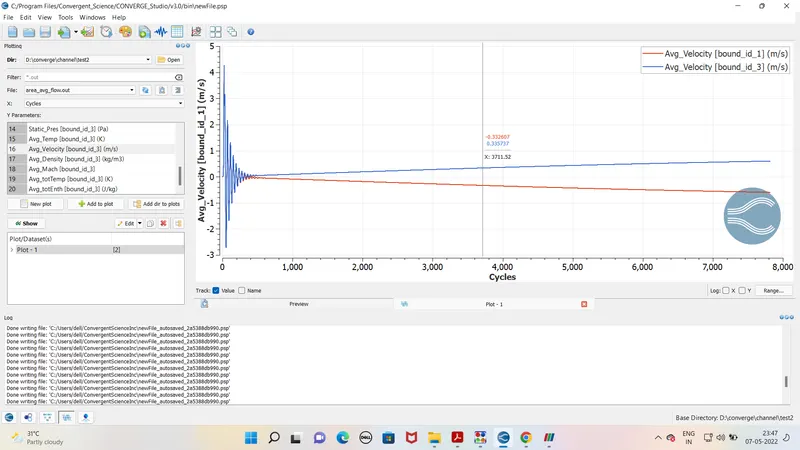
Velocity plot for mesh size .002
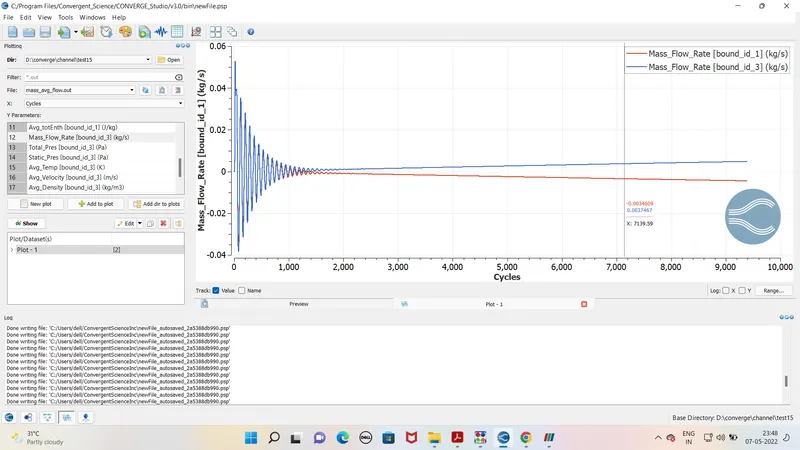
Mass flow rate for mesh size .0015
Pressure plot for mesh size .0015
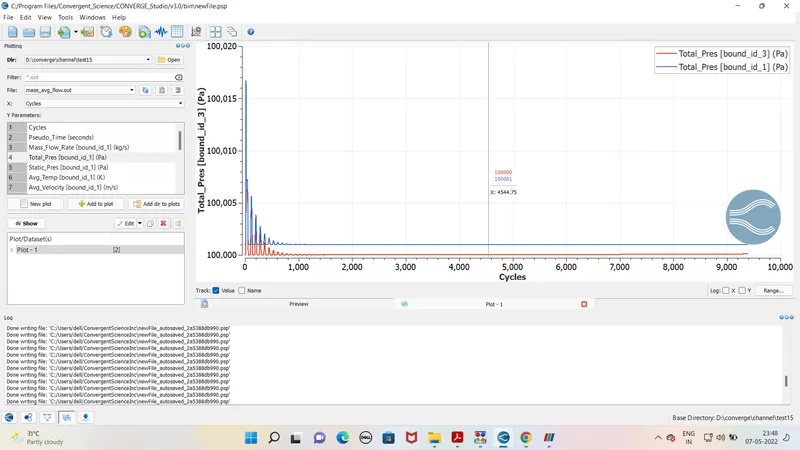
Velocity plot for mesh size .0015
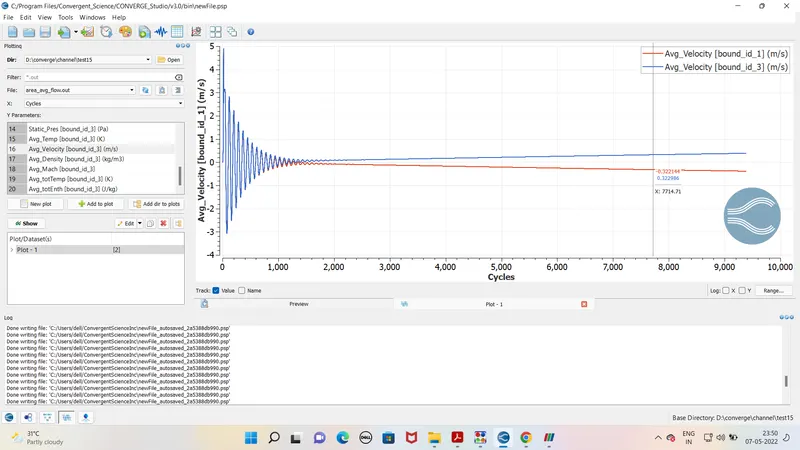
Mass flow rate for mesh size .001
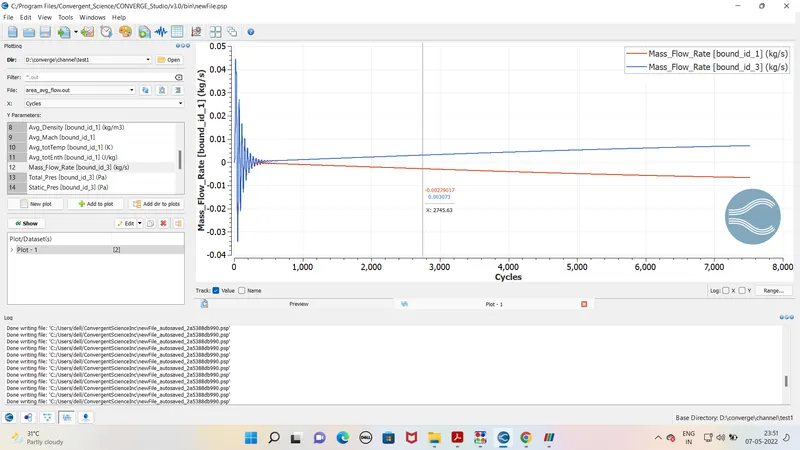
Pressure plot for mesh size .001
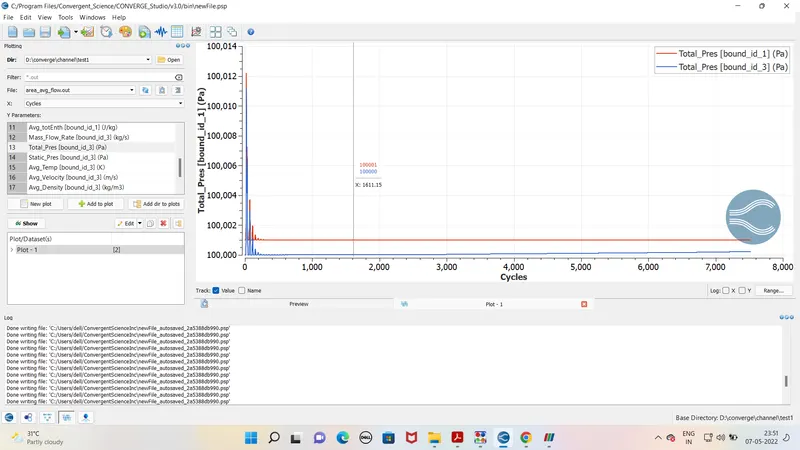
Velocity plot for mesh size .001
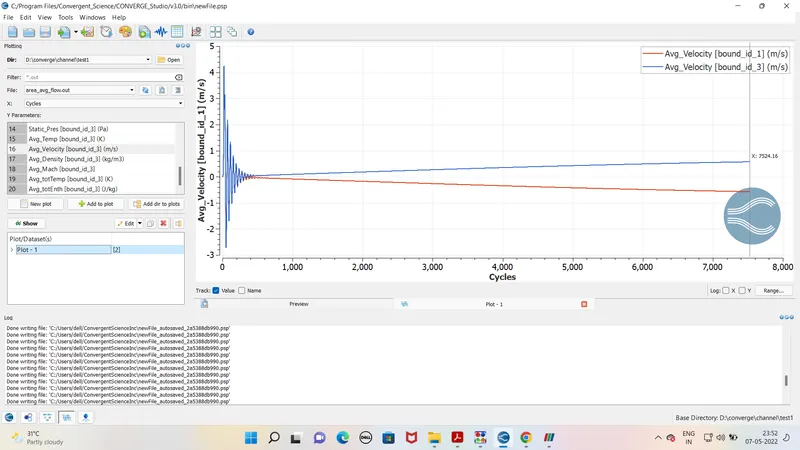
Conclusion –
From above results it is noticed that as we reduce the mesh size the plots become more clear. and same time the simulation also take longer time to converge the parameters.
but results visble more clear and smooth .
In velcovity conotur it is noticed that boundary layer is created near the boundary wall and at boundary wall velocity is zero . so it is always desraible to choose correct grid size for study .