To Study the State of Charge Estimation.
AIM : To Study the State of Charge Estimation.
State of Charge Estimating :
An overview of new and current developments in state of charge (SOC) estimating methods for battery is given where the focus lies upon mathematical principles and practical implementations. As the battery SOC is an important parameter, which reflects the battery performance, so accurate estimation of SOC cannot only protect battery, prevent overcharge or discharge, and improve the battery life, but also let the application make rationally control strategies to achieve the purpose of saving energy. This paper gives a literature survey on the categories and mathematical methods of SOC estimation. Based on the assessment of SOC estimation methods, the future development direction of SOC estimation is proposed.
Introduction -
Rising crude oil prices and worldwide awareness of environmental issues have resulted in the increased development of energy storage systems. The battery is one of the most attractive energy storage systems because of its high efficiency and low pollution. There are several kinds of batteries currently being used in the industry: lead-acid battery, Ni-MH battery, Ni-Cd battery, and Li-ion battery. The battery has the advantages of high working cell voltage, low pollution, low self-discharge rate, and high power density. Batteries are used commonly for portable utilities, hybrid electric vehicles, and industrial applications.
SOC estimation is a fundamental challenge for battery use. The SOC of a battery, which is used to describe its remaining capacity, is a very important parameter for a control strategy. As the SOC is an important parameter, which reflects the battery performance, so accurate estimation of the SOC can not only protect the battery, prevent over-discharge, and improve the battery life but also allow the application to make rational control strategies to save energy. However, a battery is a chemical energy storage source, and this chemical energy cannot be directly accessed. This issue makes the estimation of the SOC of a battery difficult. Accurate estimation of the SOC remains very complex and is difficult to implement because battery models are limited and there are parametric uncertainties. Many examples of poor accuracy and reliability of the estimation of the SOC are found in practice.
Definition and Classification of SOC Estimation -
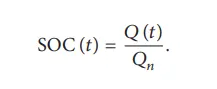
The SOC is one of the most important parameters for batteries, but its definition presents many different issues. In general, the SOC of a battery is defined as the ratio of its current capacity (𝑄(𝑡)) to the nominal capacity (𝑄𝑛). The nominal capacity is given by the manufacturer and represents the maximum amount of charge that can be stored in the battery. The SOC can be defined as follows:
The various mathematical methods of estimation are classified according to methodology. The classification of these SOC estimation methods is different in the various literature. However, some literature allows a division into the following four categories.
- Direct measurement: This method uses physical battery properties, such as the voltage and impedance of the battery.
- Book-keeping estimation: This method uses discharging current as of the input and integrates the discharging current over time to calculate the SOC.
- Adaptive systems: The adaptive systems are self-designing and can automatically adjust the SOC for different discharging conditions. Various new adaptive systems for SOC estimation have been developed.
- Hybrid methods: The hybrid models benefit from the advantages of each SOC estimation method and allow a globally optimal estimation performance. The literature shows that the hybrid methods generally produce a good estimation of SOC, compared to individual methods.
OBJECTIVES :
-
Simulate the 3 test cases from harness dashboard and write a detailed report on the results.
-
What is coulomb counting? Refer to the above model and explain how BMS implements coulomb counting for SOC estimation ?
Hint : (Download the file from the link and go to SOC estimation model-ECU block)
STUDY - 1 :
Simulating the 3 test cases from Harness Dashboard and Writing a detailed Report on the Results :
Closed Loop Harness Dashboard Model by Mathworks is as Shown Below -
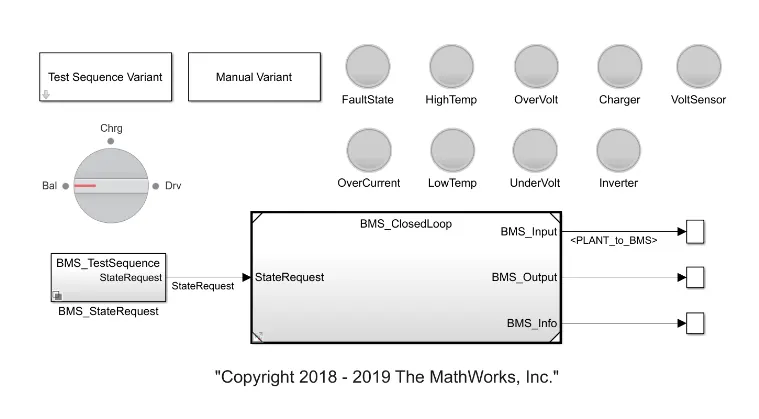
- The harness dashboard is shown above. It consists of the test sequence variant subsystem which holds three different test cases.
- This dashboard also helps in determining the fault states and other parameters as shown in the diagram below.
- The green color indicates that the system is working without any errors while the red signal will indicate that there is a fault in the system.
Test Case 1 :
Test Sequence Variant block -
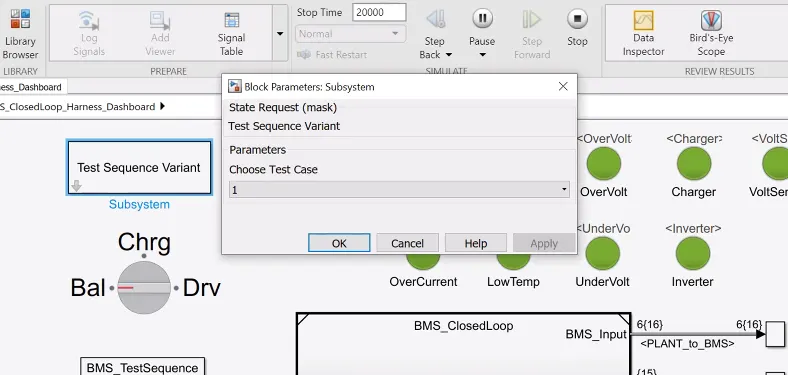
- Here is a selection of the 3 test conditions, we can be selected via the Test Sequence Variant block which allows us to select which test needs to be simulated.
- The first variant was selected initially for the simulation which can be seen above.
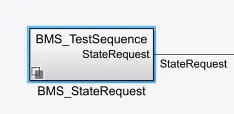
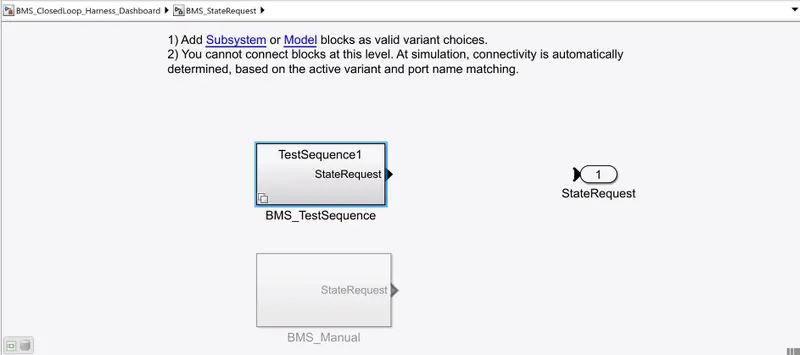
- After the selection of the test sequence variant, Above we see it in the BMS_Test Sequence Block.
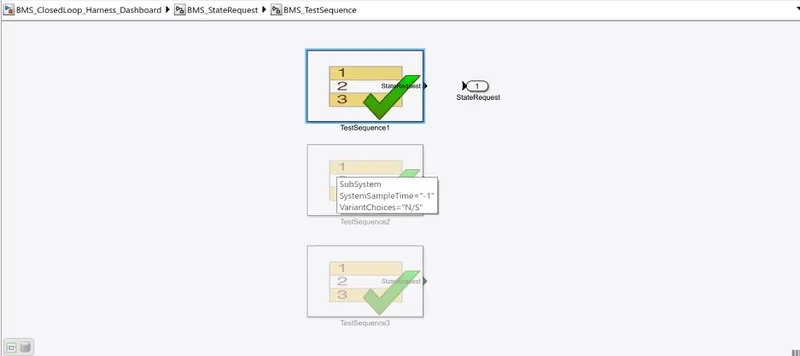
- Here inside the BMS test Sequence, we observe 1 Test Sequence is selected automatically when we select the test case as 1.
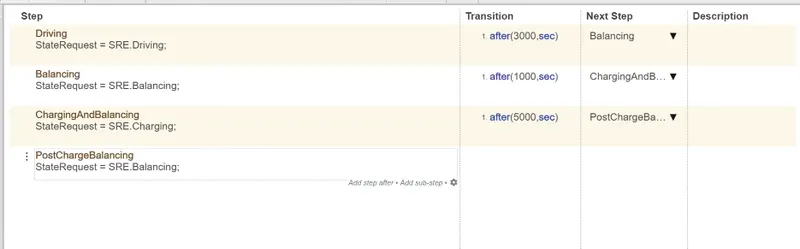
- As we look at the test variant, as shown above, it states that at the start of the simulation the model will be in the driving condition, thereafter 3000 seconds it will be in balancing mode, after 1000 seconds it will be in charging and balancing mode and after 5000 seconds it will be in post-charge balancing mode.
Closed Loop Harness Dashboard Model After the Simulation -
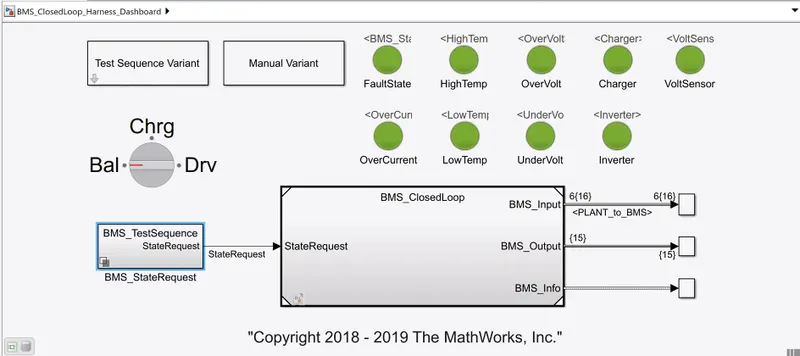
- Here we can see all the lights have turned green as there is no fault or errors in the model.
Output Result -
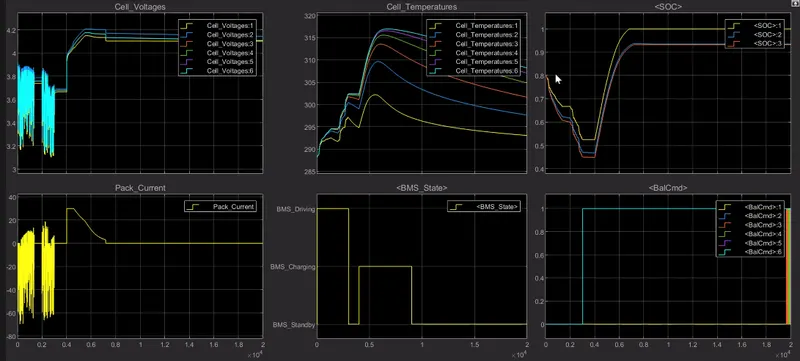
- It can be observed from the plot that the vehicle is initially in the driving state and charging was done till 90%.
- After the charging mode, it reaches standby mode which can be seen from the BMS state plot. From the Cell temperatures plot, it is observed that the battery temperature rises in driving and charging. The battery voltage was increased to 4.2 V while charging.
- The current plot shows the current value supplied to the vehicle while driving. The SOC was observed to be decreased around 50% in driving conditions, which increased while charging
Test Case 2 :
Test Sequence Variant block -
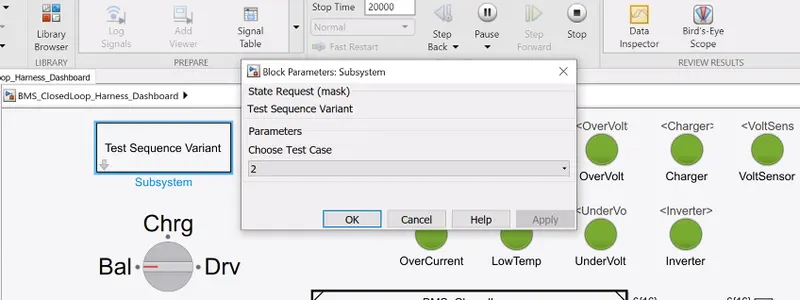
- The second variant was selected initially for the next simulation which can be seen above.
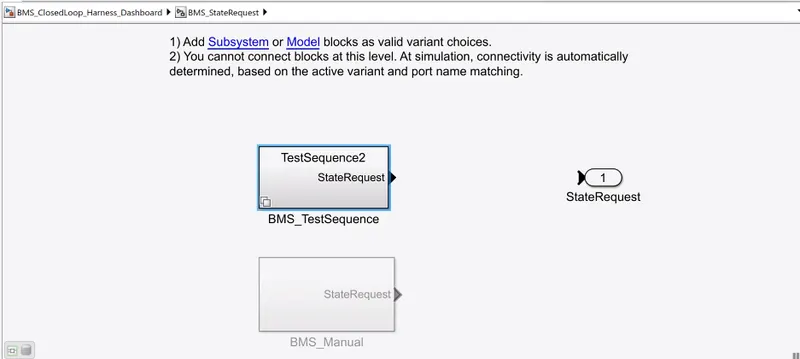
- After the selection of the test sequence variant, Above we see it in the BMS_Test Sequence Block.
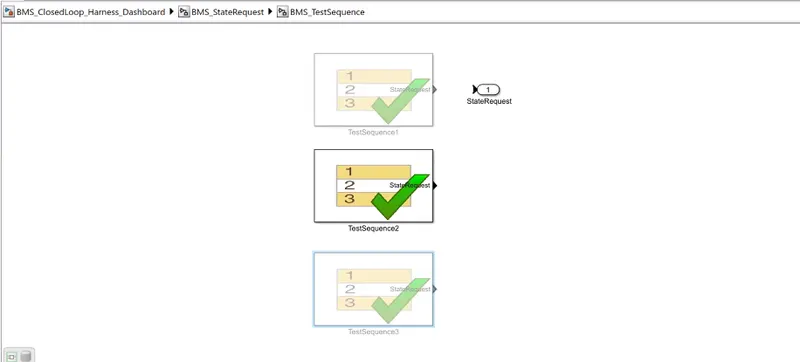
- Here inside the BMS test Sequence, we observe 2 Test Sequence is selected automatically when we select the test case as 2.
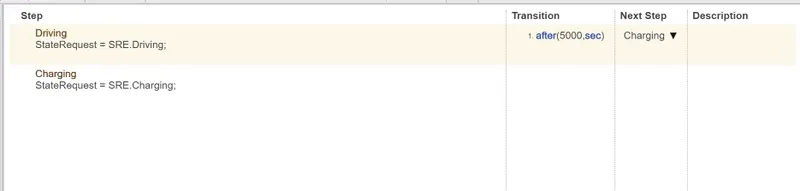
- Initially, it is the driving condition and after 5000 seconds there is a charging condition.
Closed Loop Harness Dashboard Model After the Simulation -
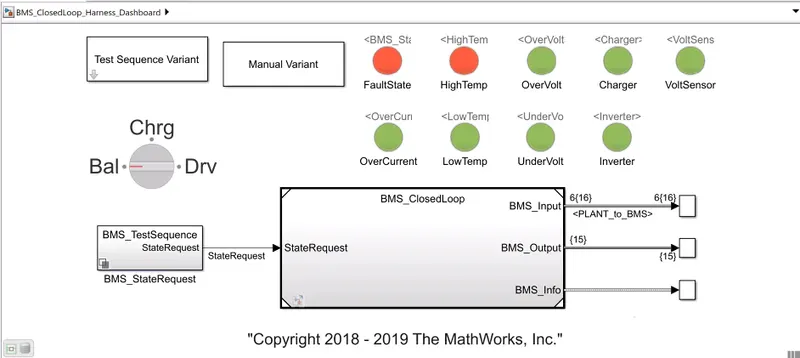
- Here we can see 2 red lights turn on it's a fault state condition Also the High-temperature indicator glow red.
Output Result -
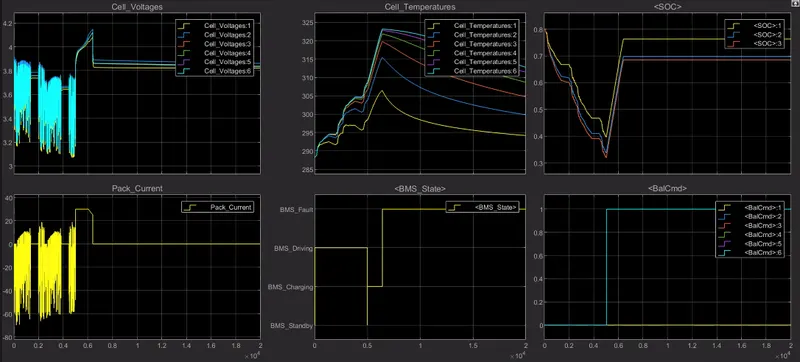
- It was observed from the plot that the battery discharges completely in 5000 seconds.
- Hence the vehicle comes to standby condition and the simulation stops.
Test Case 3 :
Test Sequence Variant block -
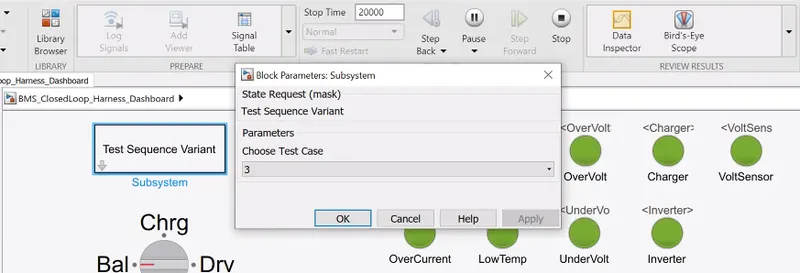
- The third variant was selected initially for the simulation which can be seen above.
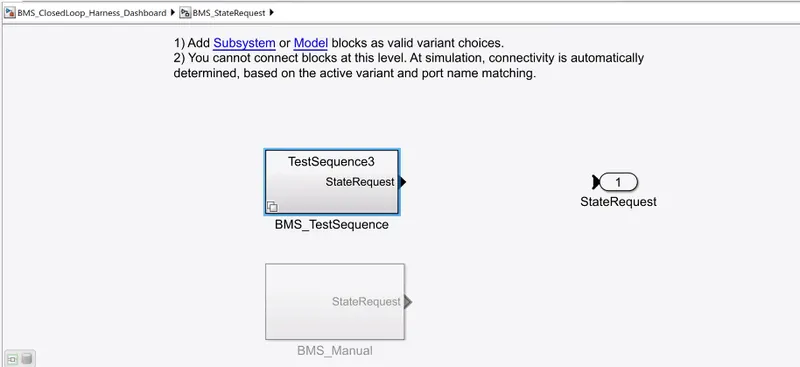
- After the selection of the test sequence variant, Above we see it in the BMS_Test Sequence Block.
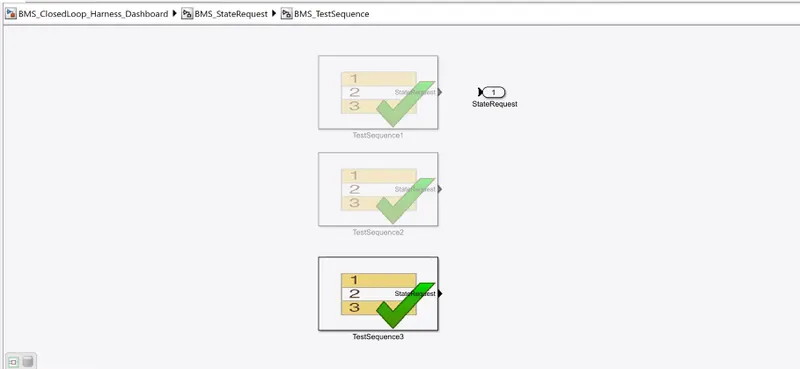
- Here inside the BMS test Sequence, we observe 3 Test Sequence is selected automatically when we select the test case as 3.
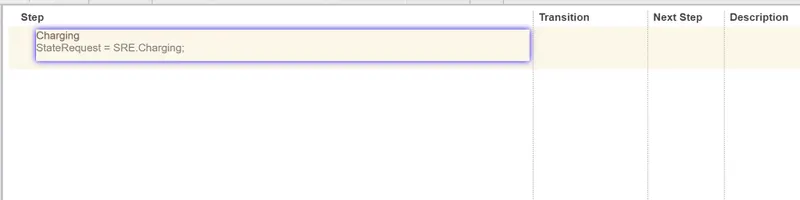
- Looking at the condition above for the third variant of the simulation. It is just the continuous charging condition from the start till the end of 20000 seconds of simulation.
Closed Loop Harness Dashboard Model After the Simulation -
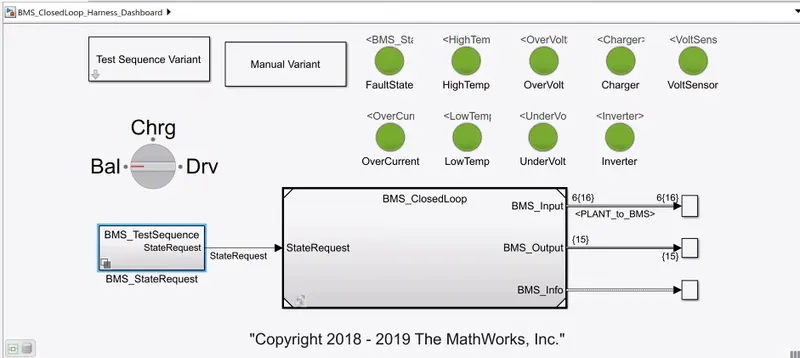
- Here we can see all the lights have turned green as there is no fault or errors in the model.
Output Result -
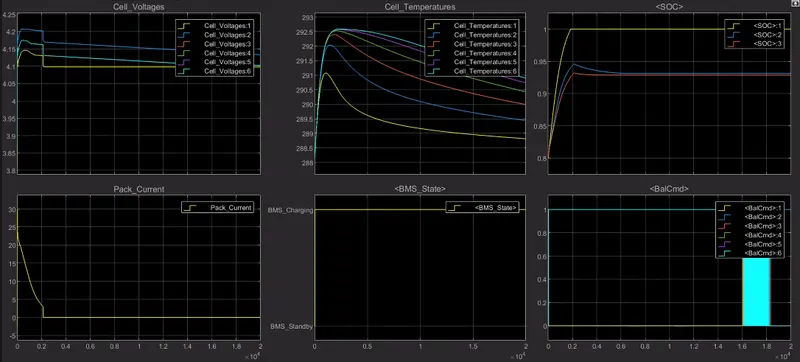
- Looking at the plot it can be seen that the battery starts charging and the SOC starts increasing from beginning to around 2000 seconds and stays stable at 100% continuously from 2000 seconds until 20000 seconds.
- The peak current plot drops from 0 to 2000 seconds and stays constant as the charge is not used anywhere as the driving is not present.
From the above simulated 3 variants of the simulation carried out it was observed that -
- In the first simulation all three conditions were simulated such as driving charging and the stable state hence the charging and discharging were observed and in the end, the constant 100% SOC was observed because of the standby state of the vehicle.
- In the second simulation, it was just the discharging as the SOC dropped to 0% in the driving state within 5000 seconds.
- In the third simulation, only charging was observed for the first 2000 seconds and the SOC remained at 100% constant for the next 18000 seconds.
STUDY - 2 :
What is coulomb counting? Referring to the above model and explaining how BMS implements coulomb counting for SOC estimation :
Book-Keeping Estimation -
Book-Keeping estimation method uses battery discharging current data as input. This method permits to include some internal battery effects as self-discharge, capacity-loss and discharging efficiency. Two kinds of book-keeping estimation methods have been employed :
- Coulomb Counting Method
- Modified Coulomb counting Method
Coulomb Counting Method -
The Coulomb counting method measures the discharging current of a battery and integrates the discharging current over time in order to estimate SOC. Coulomb counting method is done to estimate the SOC(𝑡), which is estimated from the discharging current, 𝐼(𝑡), and previously estimated SOC values, SOC(𝑡 − 1). SOC is calculated by the following equation :
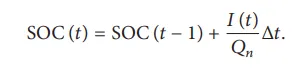
But there are several factors that affect the accuracy of Coulomb counting method including temperature, battery history, discharge current, and cycle life.
Modified Coulomb Counting Method -
To improve the Coulomb counting method, a new technique called modified Coulomb counting method is proposed. The modified Coulomb counting method uses the corrected current to improve the accuracy of estimation.
The corrected current is the function of discharging current. There is a quadratic relationship between the corrected current and discharging current of battery. By practice of experimental data, corrected current is calculated by the following form :
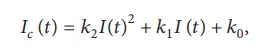
where 𝑘2, 𝑘1 and 𝑘0 are constant values obtained from the practice experimental data.
In the modified Coulomb counting method, SOC is calculated by the following equation :
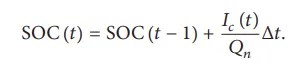
The experimental results show that the accuracy of the modified Coulomb counting method is superior to the conventional Coulomb counting method.
From the given model by Mathworks as shown below of the BMS Closed Loop model, when seen inside the BMS ECU :
BMS_ClosedLoop System Model -
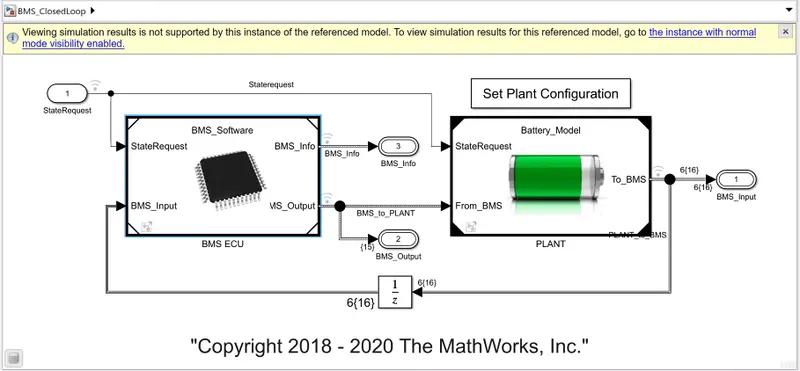
- In the above project upon opening the BMS ECU block, we see the following subsystems.
BMS ECU Subsystem Model -
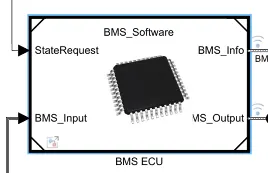
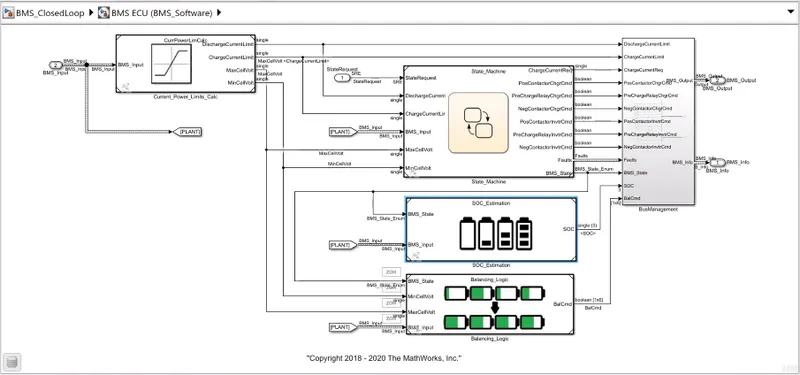
- Here we can see the block "SOC_estimation". Double click to open this subsystem.
SOC_Estimation Subsystem Block -
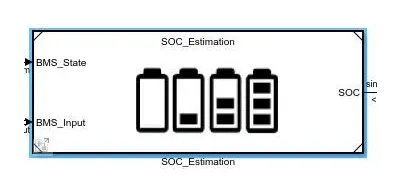
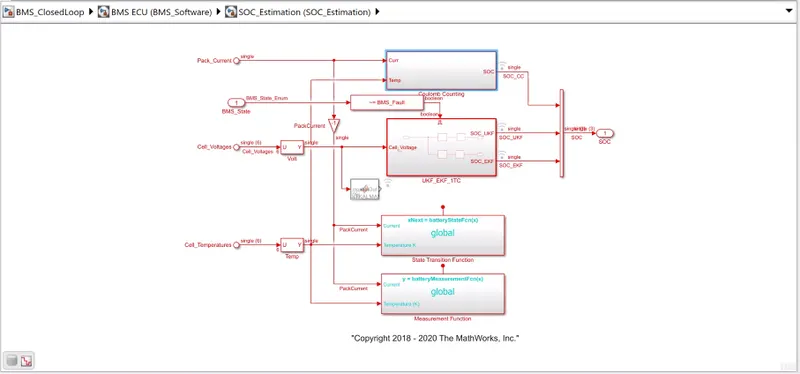
- Upon opening the SOC estimation block we see different blocks like Coulomb counting and Kalman filters for charge estimation. Opening the coulomb counting block we have the following arrangement.
Coulomb Counting subsystem Block -
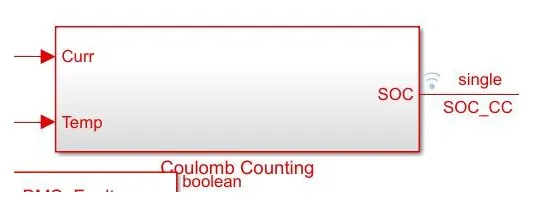
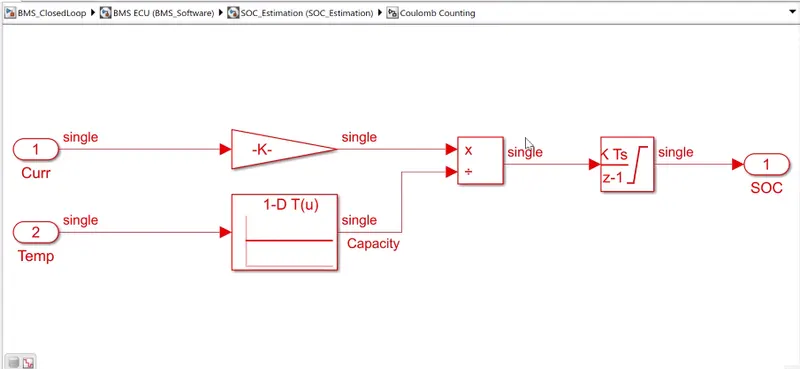
- This system carries out the estimation by coulomb counting equation mentioned earlier. The main advantage of coulomb counting is that of its simplicity and low computational cost.
- Temperature and current are taken as input from the battery. The current signal is given to the gain block and the temperature is given to capacity as it varies according to the temperature.
- These inputs are given to integration where the current will be integrated wrt time. This output is given to another block where it is divided by capacity and henceforth the SOC is estimated.
CONCLUSION :
-
Successfully Simulated the 3 test cases from the harness dashboard and wrote a detailed report on the results.
-
Also, Referred to the above model and explained how BMS implements coulomb counting for SOC estimation.
REFERENCES :