To Study the Modelling of Battery Pack.
AIM : To Study the Modelling of Battery Pack.
Battery :
Generic battery model -
Library : Simscape / Electrical / Specialized Power Systems / Sources
Description :
The Battery block implements a generic dynamic model that represents the most popular types of rechargeable batteries.
This figure shows the equivalent circuit that the block models -
Charge and Discharge characteristics :
The circuit parameters can be modified to represent a specific battery type and its discharge characteristics. A typical discharge curve consists of three sections.
The first section represents the exponential voltage drop when the battery is charged. The width of the drop depends on the battery type. The second section represents the charge that can be extracted from the battery until the voltage drops below the battery nominal voltage. Finally, the third section represents the total discharge of the battery, when the voltage drops rapidly.
When the battery current is negative, the battery recharges, following a charge characteristic.
The model parameters are derived from the discharge characteristics. The discharging and charging characteristics are assumed to be the same.
The Exp(s) transfer function represents the hysteresis phenomenon for the lead-acid, nickel-cadmium (NiCD), and nickel-metal hydride (NiMH) batteries during the charge and discharge cycles. The exponential voltage increases when a battery is charging, regardless of the battery's state of charge. When the battery is discharging, the exponential voltage decreases immediately.
The state of charge (SOC) for a battery is a measure of battery's charge, expressed as a percent of the full charge. The depth of discharge (DOD) is the numerical compliment of the SOC, such that DOD = 100% - SOC.
For example, if the SOC is :
-
100% — The battery is fully charged and the DOD is 0%.
-
75% — The battery is 3/4 charged and the DOD is 25%.
-
50% — The battery is 1/2 charged and the DOD is 50%.
-
0% — The battery has 0 charge and the DOD is 100%.
OBJECTIVES :
Build a Battery Pack with 3S4P Configuration with Generic Battery Block : -
-
Configure the batteries as per a Lithium-ion battery datasheet.
-
Explain your parameters.
-
Simulate the model and comment on the results for SOC, voltage, current in detail.
-
Change the configuration to 4S3P and simulate the model.
- Compare the results for both models and give your explanation for the results.
STUDY - 1 :
Configuring the batteries as per a Lithium-ion Battery Datasheet :
Parameterization :
The below figure shows detailed parameters extracted from the ICR 18650-28C battery datasheet -
Following is the data extracted from the above datasheet -
- Normal Capacity — 2.8 Ah
- Minimum Capacity — 2.7 Ah
- Nominal Voltage — 3.72 V
- Charging Voltage — 4.3 V
- Discharge Cut-off Voltage — 2.75 V
- Internal resistance — 0.10357 ohm
- Standard Charge Current — 1.4 A
- Max. Charge Current — 2.8 A
- Max. Discharge Current — 5.6 A
Battery Configuration :
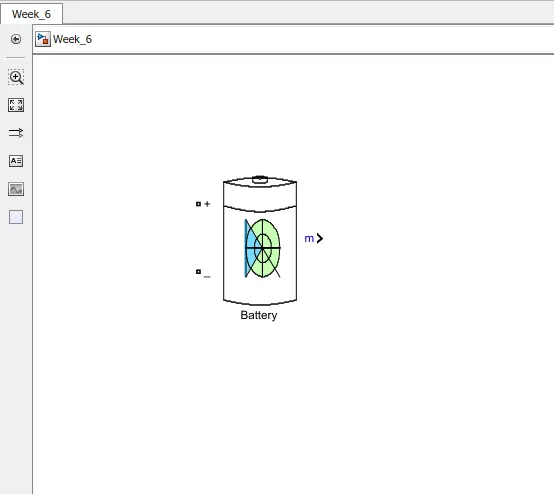
Simulink block representation of generic battery model -
General Parameters :
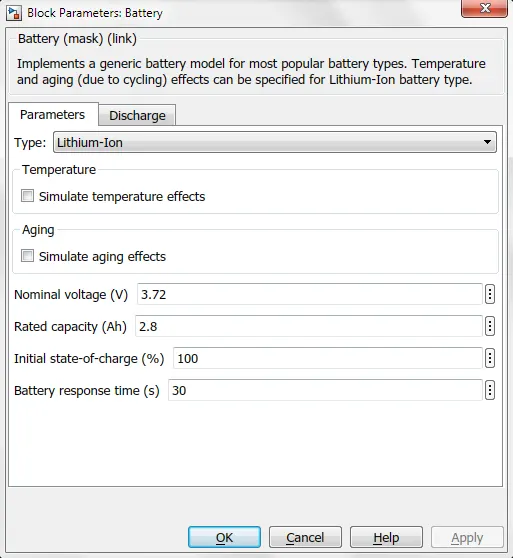
The data extracted from datasheet has been filed in the block for configuration -
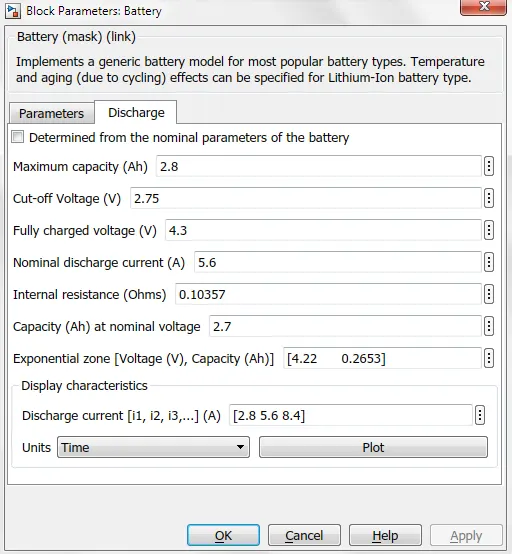
Discharge Parameters :
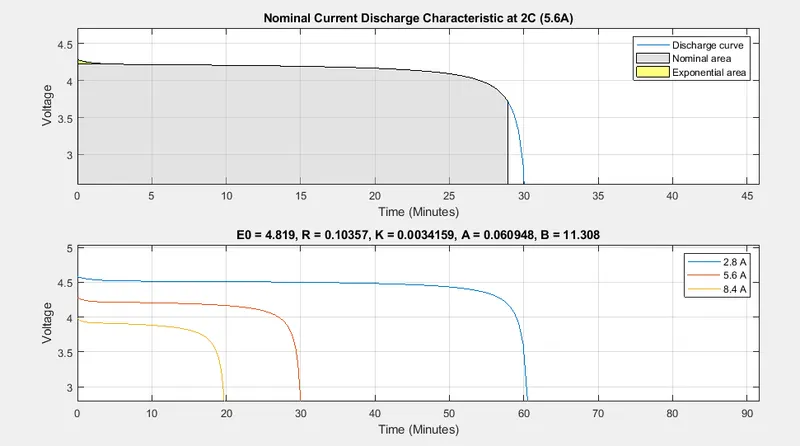
Simulink Discharge Plot :
STUDY - 2 :
Parameters Explanation :
Nominal voltage (V) -
The nominal voltage (Vnom) of the battery in V. The nominal voltage represents the end of the linear zone of the discharge characteristics.
Rated capacity (Ah) -
The rated capacity of the battery in Ah. The rated capacity is the minimum effective capacity of the battery.
Initial state-of-charge (%) -
The initial state-of-charge (SOC) of the battery. A SOC of 100% indicates a fully charged battery and 0% indicates an empty battery. This parameter is used as an initial condition for the simulation and does not affect the discharge curve (when the option Plot Discharge Characteristics is used).
Battery response time (s) -
The response time of the battery (at 95% of the final value). This value represents the voltage dynamics and can be observed when a current step is applied.
Maximum capacity (Ah) -
The maximum theoretical capacity (Q) when a discontinuity occurs in the battery voltage in Ah. This value is generally equal to 105% of the rated capacity.
Cut-off voltage (V) -
The minimum allowable battery voltage in V. This voltage represents the end of the discharge characteristics. At the cut-off voltage, the battery is fully discharged.
Fully charged voltage (V) -
The fully charged voltage (Vfull) for a given discharge current. The fully charged voltage is not the no-load voltage.
Nominal discharge current (A) -
The nominal discharge current, for which the discharge curve has been measured, in A. For example, a typical discharge current for a 1.5-Ah NiMH battery is 20% of the rated capacity: (0.2 * 1.5 Ah / 1 h = 0.3 A).
Internal resistance (Ohms) -
The internal resistance of the battery in ohms. When a preset model is used, a generic value is loaded, corresponding to 1% of the nominal power (nominal voltage multiplied by the battery rated capacity). The resistance is supposed to be constant during the charge and the discharge cycles and does not vary with the amplitude of the current.
Capacity (Ah) at nominal voltage -
The capacity (Qnom) is extracted from the battery until the voltage drops under the nominal voltage. This value should be between Qexp and Qmax.
Exponential zone [Voltage (V), Capacity (Ah)] -
The voltage, Vexp, and the capacity, Qexp, correspond to the end of the exponential zone. The voltage should be between Vnom and Vfull. The capacity should be between 0 and Qnom.
Discharge current [i1, i2, i3,...] (A) -
Allows specifying different values of discharge current. The discharge characteristics for these currents are presented in the second part of the graph.
Units -
Choose either Time (default) or Ampere-hour as the x-axis for the plot.
Plot -
Plots a figure containing two graphs. The first graph represents the nominal discharge curve (at the Nominal Discharge Current) and the second graph represents the discharge curves at the specified discharge currents.
STUDY - 3 :
Simulating the Model and Commenting on the results for SOC, Voltage, Current in Detail :
Simulink Battery Pack Model with 3S4P Configuration with Generic Battery Block -
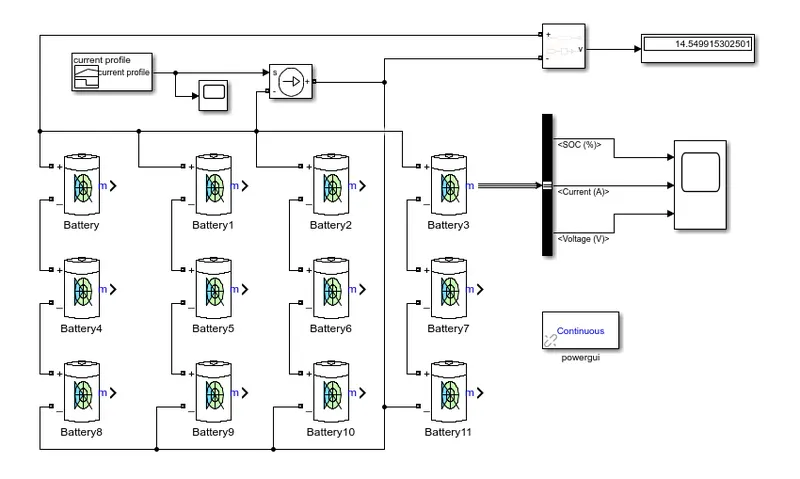
- This model displays the configuration 3S4P where the 3 cells are connected in series +ve terminal of first is to -ve terminals of second and 4 of these series connections are connected in parral with all +ve to +ve and all -ve to -ve terminals.
- The total voltage around the series connection is 3.72 x 3 which is 11.16V as 3.72 is fully charged voltages.
- The total maximum capacity of each cell would be 2.8 x 4 which would be the total capacity of 11.2Ah.
USSD Drive Cycle Plot -
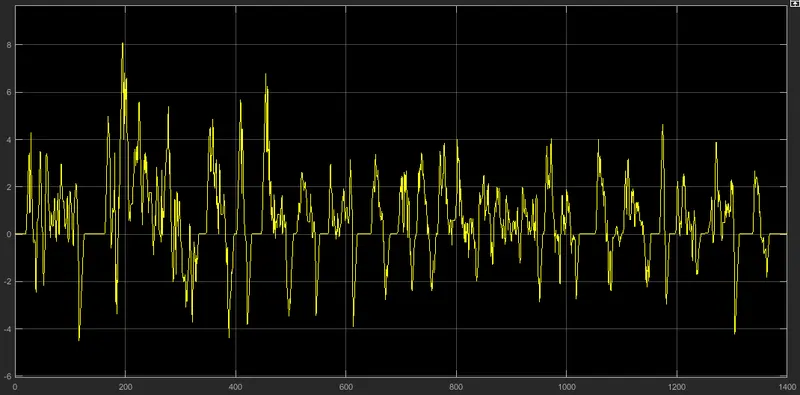
- UDDS drive cycle - UDDS stands for Urban Dynamometer Driving Schedule.
- A driving cycle is a series of data points representing the speed of a vehicle versus time. Driving cycles are produced by different countries and organizations to assess the performance of vehicles in various ways, as for example fuel consumption and polluting emissions.
Battery Parameters Measurement Plot -
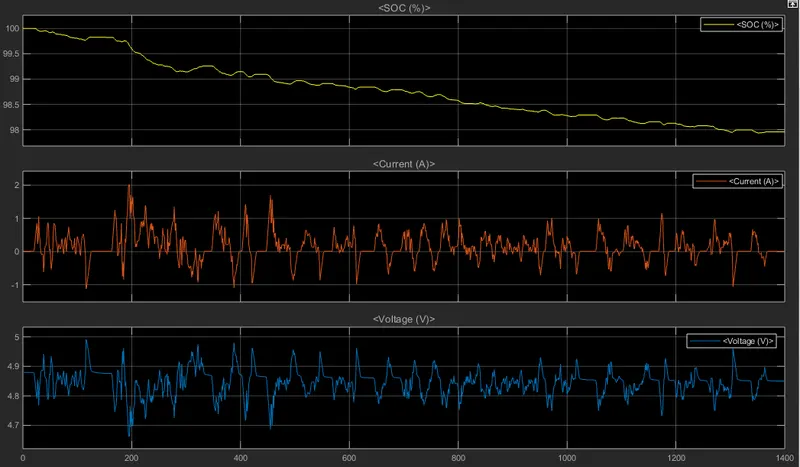
- Here SOC is getting depleted over time and it can be said that pack was designed and simulated correctly over the capacity of 11.2Ah.
- UDDC sometimes demands a higher current at times. The higher current brings in Peukert's effect and the capacity of the battery is reduced.
Voltage Display Block -
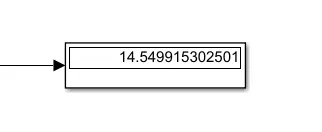
- The above image shows the highest voltage output after simulation.
STUDY - 4 :
Changing the Configuration to 4S3P and Simulating the Model :
Simulink Battery Pack Model with 4S3P Configuration with Generic Battery Block -
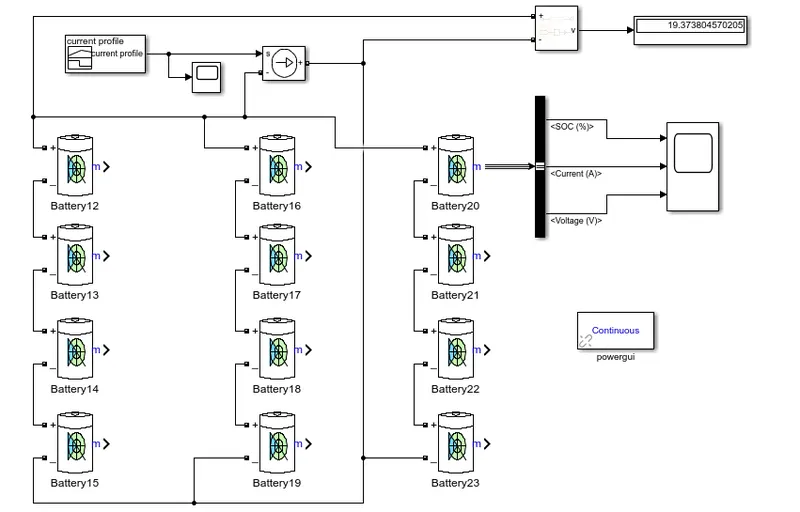
- This model displays the configuration 4S3P where the 4 cells are connected in series +ve terminal of first is to -ve terminals of second and 3 of these series connections are connected in parral with all +ve to +ve and all -ve to -ve terminals.
- The total voltage around the series connection is 3.72 x 4 which is 14.88V as 3.72 is fully charged voltages.
- The total maximum capacity of each cell would be 2.8 x 3 which would be the total capacity of 8.4Ah.
USSD Drive Cycle Plot -
- UDDS drive cycle - UDDS stands for Urban Dynamometer Driving Schedule.
- A driving cycle is a series of data points representing the speed of a vehicle versus time. Driving cycles are produced by different countries and organizations to assess the performance of vehicles in various ways, as for example fuel consumption and polluting emissions.
Battery Parameters Measurement Plot -
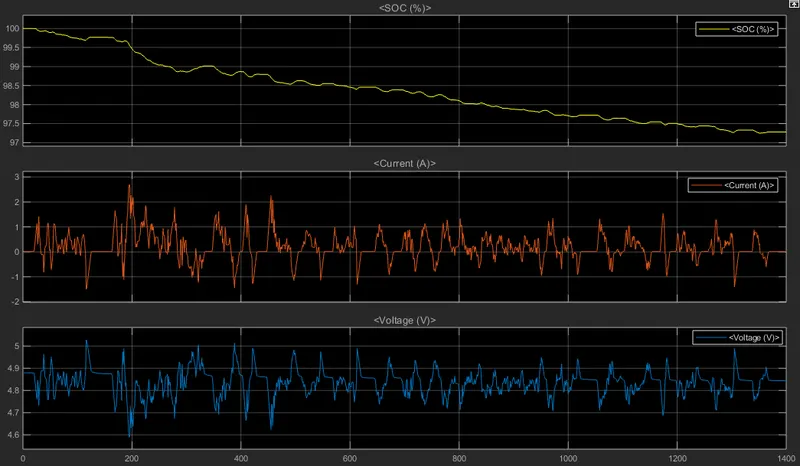
- Here SOC is getting depleted over time and it can be said that pack was designed and simulated correctly over the capacity of 8.4Ah.
- UDDC sometimes demands a higher current at times. The higher current brings in Peukert's effect and the capacity of the battery is reduced.
Voltage Display Block -
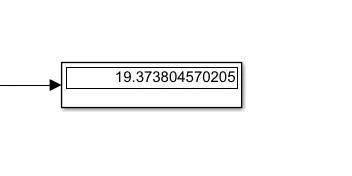
- The above image shows the highest voltage output after simulation.
STUDY - 5 :
Comparing the Results for both Models and Giving Explanation for the Results :
Battery Parameters Measurement Plot For 3S4P Configuration -
This battery setup has some details that make it a good configuration setup -
- The SOC Decreases to 98.2% and has lower DOD because capacity is higher (11.2Ah).
- Right before 200 sec, the drive cycle demands a current of about 8A, but this configuration can discharge a peak current of 2A.
- The entire current curve follows the drive cycle (which is a current vs time graph). However, from the comparison, it is evident that the drive cycle requirements exceed what the battery pack can provide.
- Lower voltage due to only 3 cells connected in series.
- Every time there is an increase in current demand, the voltage decreases as the pack needs to discharge a higher current. Every time the current goes negative i.e. during steep deceleration of the vehicle, it means the battery is being charged and that increases the voltage. Hence, the graphs of current and voltage are totally opposite of each other at all points.
Battery Parameters Measurement Plot For 4S3P Configuration -
The battery configuration here is different from the previous model -
- The SOC Decreases to 97.3% and has higher DOD because capacity is lower (8.4Ah).
- This configuration at the same point can discharge a peak current of about 2.7A.
- The same thing is happening here, except that the battery pack can discharge a little more current due to greater voltage. Hence, current amplitudes are higher than the 3S4P pack.
- Higher voltage due to 4 cells connected in series also Same voltage theory applies as stated in 3S4P.
CONCLUSION :
-
Successfully Configured the generic battery model in MATLAB from the datasheet of a Lithium-ion battery and Explained parameters.
-
Builded a battery pack model with 3S4P and 4S3P configuration with a generic battery block.
-
Also, Simulated the model and commented on the results for SOC, Voltage, Current in detail.
-
Finally, Compared the results for both models and gave an explanation for the results.
REFERENCES :
https://in.mathworks.com/help/physmod/sps/powersys/ref/battery.html