To Study about the Fuel Cell Powered Model.
AIM : To Study about the Fuel Cell Powered Model.
Fuel Cell :
A fuel cell is an electrochemical cell that converts the chemical energy of a fuel (often hydrogen) and an oxidizing agent (often oxygen) into electricity through a pair of redox reactions. Fuel cells are different from most batteries in requiring a continuous source of fuel and oxygen (usually from air) to sustain the chemical reaction, whereas in a battery the chemical energy usually comes from metals and their ions or oxides that are commonly already present in the battery, except in flow batteries. Fuel cells can produce electricity continuously for as long as fuel and oxygen are supplied.
The first fuel cells were invented by Sir William Grove in 1838. The first commercial use of fuel cells came more than a century later following the invention of the hydrogen–oxygen fuel cell by Francis Thomas Bacon in 1932. The alkaline fuel cell, also known as the Bacon fuel cell after its inventor, has been used in NASA space programs since the mid-1960s to generate power for satellites and space capsules. Since then, fuel cells have been used in many other applications. Fuel cells are used for primary and backup power for commercial, industrial and residential buildings and in remote or inaccessible areas. They are also used to power fuel cell vehicles, including forklifts, automobiles, buses, boats, motorcycles and submarines.
There are many types of fuel cells, but they all consist of an anode, a cathode, and an electrolyte that allows ions, often positively charged hydrogen ions (protons), to move between the two sides of the fuel cell. At the anode a catalyst causes the fuel to undergo oxidation reactions that generate ions (often positively charged hydrogen ions) and electrons. The ions move from the anode to the cathode through the electrolyte. At the same time, electrons flow from the anode to the cathode through an external circuit, producing direct current electricity. At the cathode, another catalyst causes ions, electrons, and oxygen to react, forming water and possibly other products. Fuel cells are classified by the type of electrolyte they use and by the difference in startup time ranging from 1 second for proton-exchange membrane fuel cells (PEM fuel cells, or PEMFC) to 10 minutes for solid oxide fuel cells (SOFC). A related technology is flow batteries, in which the fuel can be regenerated by recharging. Individual fuel cells produce relatively small electrical potentials, about 0.7 volts, so cells are "stacked", or placed in series, to create sufficient voltage to meet an application's requirements. In addition to electricity, fuel cells produce water, heat and, depending on the fuel source, very small amounts of nitrogen dioxide and other emissions. The energy efficiency of a fuel cell is generally between 40 and 60%; however, if waste heat is captured in a cogeneration scheme, efficiencies of up to 85% can be obtained.
OBJECTIVES :
For the 6 kW 45 Vdc Fuel Cell Stack built-in model in Matlab : -
-
Explain the working principle of the model in detail.
-
Simulate the model and explain the results.
-
Explain the voltage and current characteristics in your resultant graph.
STUDY - 1 :
Explanation of the working principle of the model in detail :
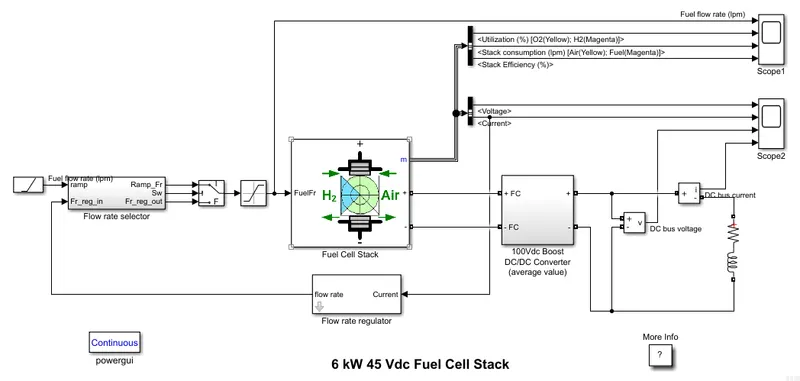
Simulink Prebuild Model of 6 kW 45 Vdc Fuel Cell Stack -
Explanation of Model -
- This example shows the Proton Exchange Membrane (PEM) Fuel Cell Stack model feeding an average value 100Vdc DC/DC converter.
- The nominal Fuel Cell Stack voltage is 45Vdc and the nominal power is 6kW. The converter is loaded by an RL element of 6kW with a time constant of 1 sec. During the first 10 secs, the utilization of the hydrogen is constant to the nominal value (Uf_H2 = 99.56%) using a fuel flow rate regulator.
- After 10 secs, the flow rate regulator is bypassed and the rate of fuel is increased to the maximum value of 85 lpm in order to observe the variation in the stack voltage. That will affect the stack efficiency, the fuel consumption and the air consumption.
- Fuel cell voltage, current, DC/DC converter voltage and DC/DC converter current signals are available on the Scope2. Fuel flow rate, Hydrogen and oxygen utilization, fuel and air consumption, and efficiency are available on the Scope1.
PROCEDURE :
Ramp -
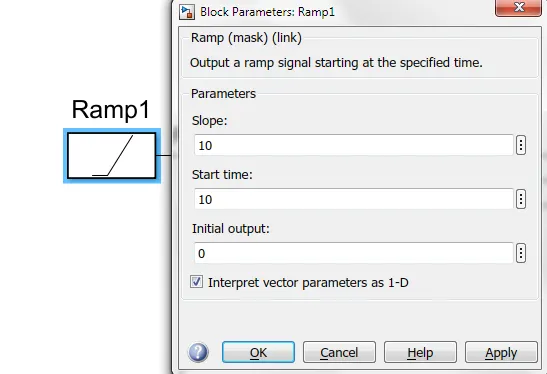
- The Ramp block generates a signal that starts at a specified time and value and changes by a specified rate. The block's Slope, Start Time, and Initial output parameters determine the characteristics of the output signal. All must have the same dimensions after scalar expansion.
Flow Rate Selector & Flow Rate Regulator -
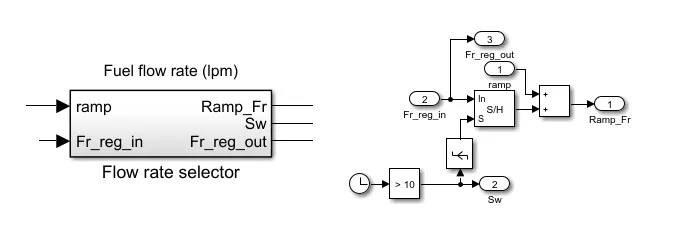
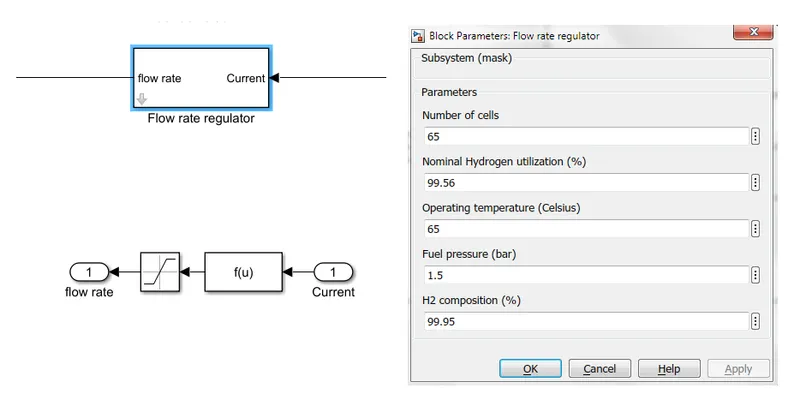
- It selects and provides the required output, for any input to understand this block more clearly.
- This is used to control the flow rate of fuel into the fuel cell. It takes the feedback of how much current the fuel cell is producing and decides the flow rate accordingly. This is then fed into the flow rate selector.
- A reference input of the UDDS drive cycle (current vs time) has been given as a modification to the model for better analysis, as the original model only had a ramp block that was ramping up the flow rate by 10. The drive cycle is originally for 1369 seconds, but running it for 200 seconds will be sufficient for the analysis needed for this project.
Switch :
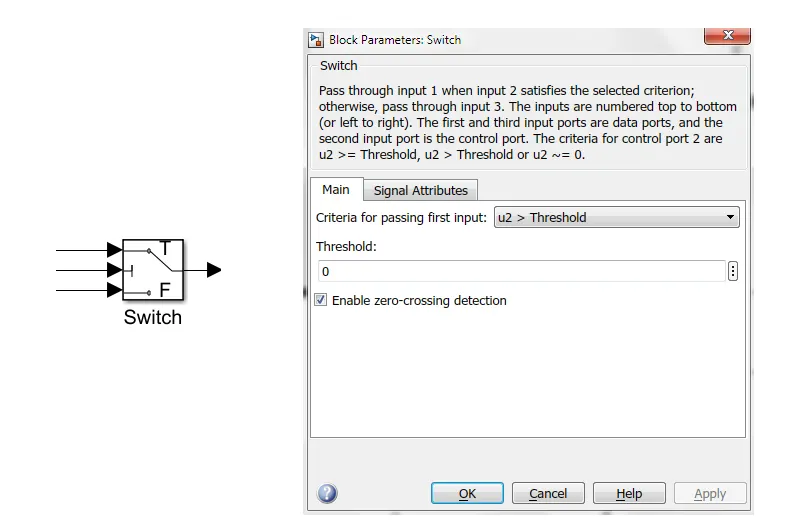
- The Switch block models a switch controlled by an external physical signal. If the external physical signal PS is greater than the value specified in the Threshold parameter, then the switch is closed otherwise, the switch is open.
Saturation :
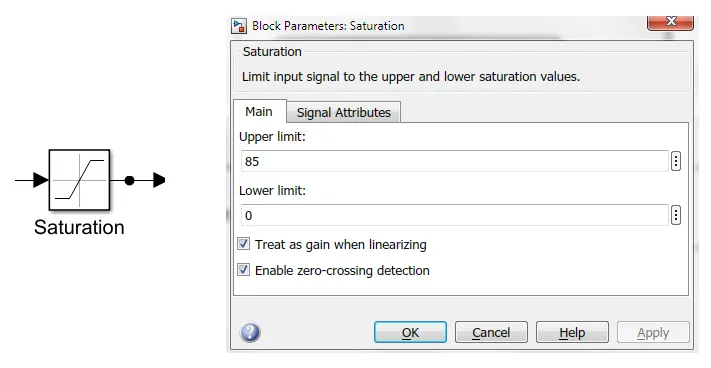
- Saturation creates a default saturation nonlinearity estimator object for estimating Hammerstein-Wiener models. The linear interval is set to [NaN NaN]. The initial value of the linear interval is determined from the estimation data range during estimation using now.
Fuel Cell Stack :
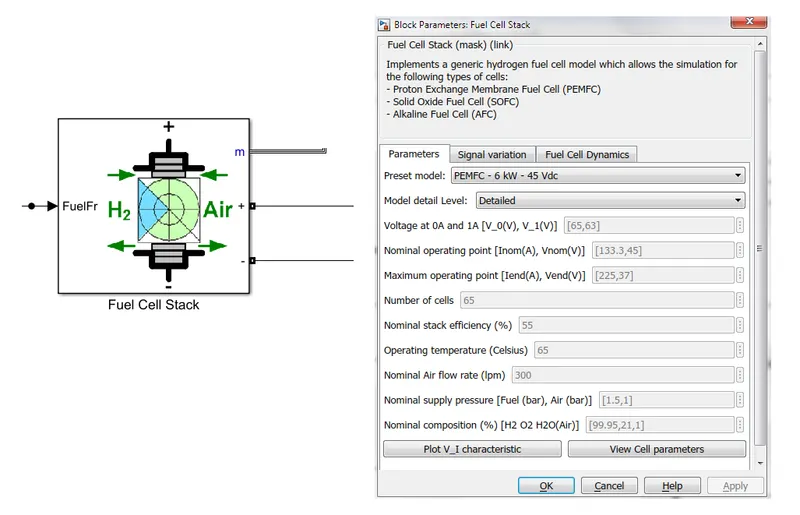
- The Fuel Cell Stack block implements a generic model parameterized to represent the most popular types of fuel cell stacks fed with hydrogen and air.
Boost DC/DC Converter :
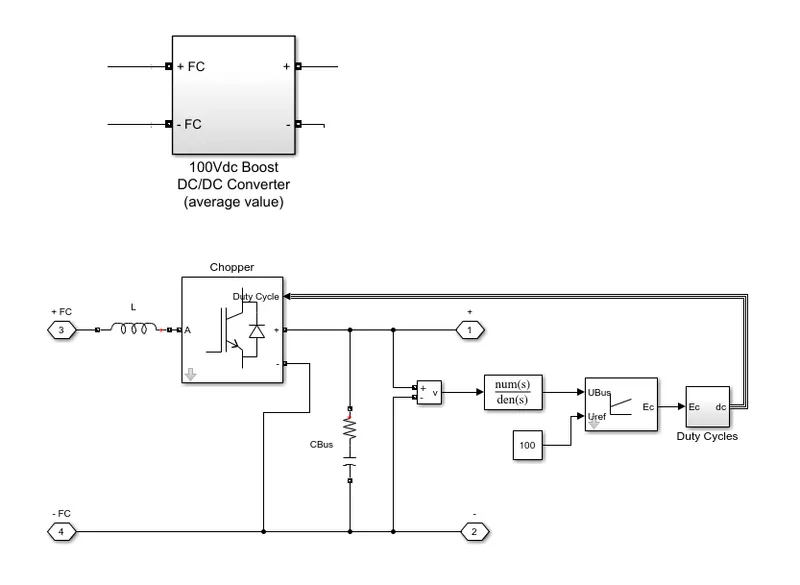
- The Average-Value DC-DC Converter block represents a controlled average-value DC-DC converter. We can program the block as a buck converter, boost converter, or buck-boost converter by providing the duty cycle. The above diagram shows the equivalent circuit for the block with a duty cycle as input.
- The converter contains a controlled current source and a controlled voltage source. Use the duty cycle, the current reference, or the voltage reference ports as a control input to convert the electrical energy between the connected components on either side of the converter.
Scopes :
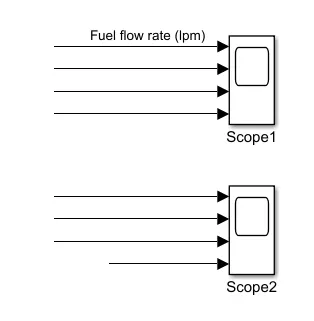
- It is the block used to observe or implement output results in form of a signal or graph.
Powergui :
The powergui block allows you to choose one of these methods to solve your circuit-
- Continuous, which uses a variable-step solver from Simulink
- Discretization of the electrical system for a solution at fixed time steps
- Continuous or discrete phasor solution
STUDY - 2 :
Simulating the Model and Explaining the Results :
Output Results :
Fuel Cell Stack Internal Parameters Measurement Plot -
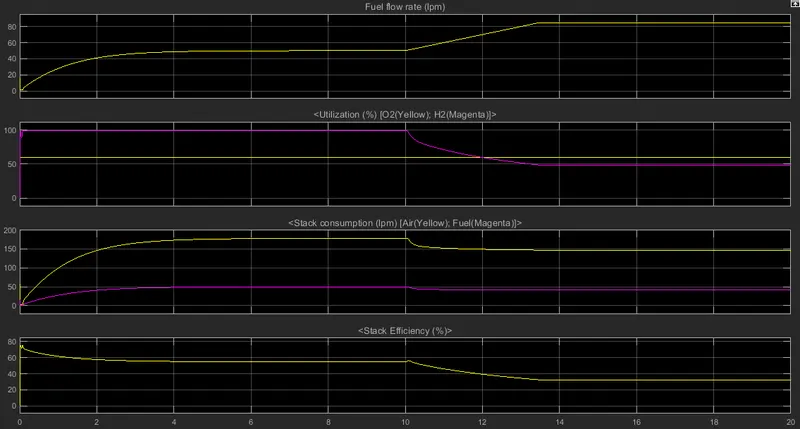
Fuel Flow Rate (lpm) -
- From 0 to 10 sec of the time, the flow rate starts increasing and remains constant, until it reaches 50 lpm. After 10sec of the time, the flow rate increases up to 95 lpm which is attained in 3.5 sec of the time.
- We are controlling the voltage and current required for the system by changing the flow rate of hydrogen and oxygen.
Fuel Utilization (%) -
- The most noticeable observation is that oxygen has minimal fluctuations and is constantly at about 60%. This could possibly be because the fuel cell demands a standby supply of oxygen so that the byproduct can be formed harmlessly.
- As the flow rate is increased to 95lpm, there can be seen a reduction in the utilization of hydrogen 100% to 42% whereas oxygen remains constant with the value of 60%
Stack Consumption (lpm) -
- We can see in the plot that up to 10 sec, the oxygen and hydrogen consumption gradually increases and remains constant up to 10 sec again after 10 sec the hydrogen and oxygen consumption decreases and remains constant.
Stack Efficiency (%) -
- At time t=0 due to transient state, the efficiency first increases and then decreases and remains constant, with the constant stack consumption, efficiency again, decreases and remains constant after 10 sec.
Output Voltage & Current Plot Of Fuel Cell Stack and Boost Converter -
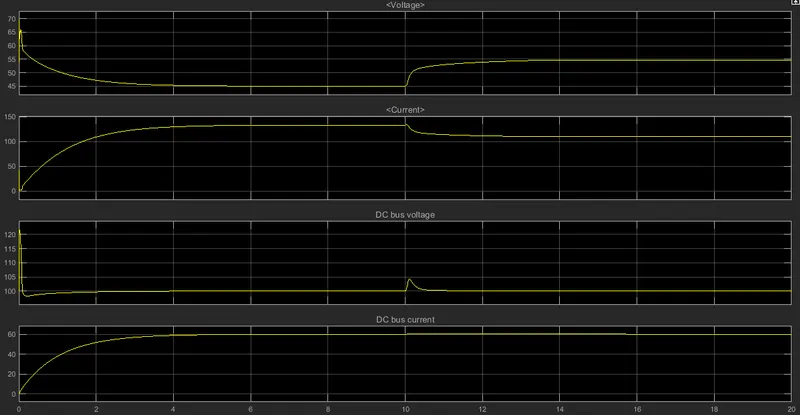
Voltage and Current -
- Both voltage and current change their value due to a transient state. We can see the voltage gets down and remains constant, whereas the current goes up gradually and remains constant up to 10 sec of simulation.
- After 10 sec with the increase in flow rate voltage of the system increases and to compensate for that current value got decreased.
DC bus Voltage and DC bus Current -
- The only change in voltage and current can be seen at the transient state of the system. Otherwise, there is no change in the DC bus voltage as a DC/DC converter of 100 Vdc is taken into consideration.
STUDY - 3 :
Explanation of the voltage and current characteristics in the resultant graph :
V_I Characteristic Plot Of Fuel Cell Stack -
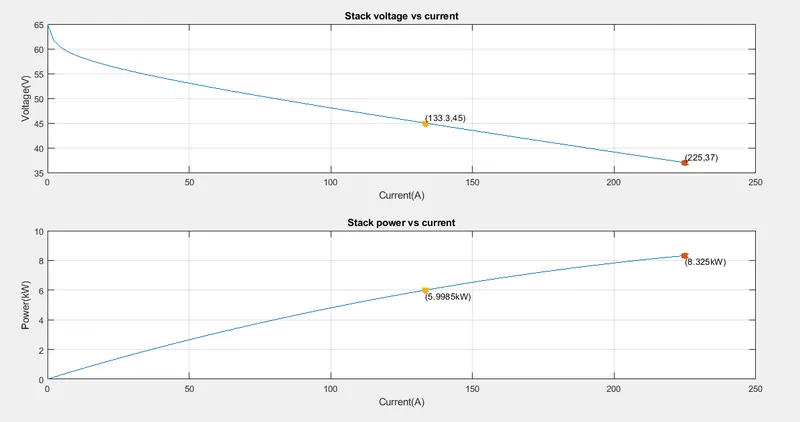
- As evident from the graph and the FC parameters, the nominal stack power is about 6kW with 45Vdc and 133A.
- Because that 6kW is to be maintained, voltage and current share an inversely proportional relationship i.e. when current is increasing, the voltage must decrease, in order to maintain the same power output.
- As stack current increases, the rate of electrical energy generation is increased, and thus more power from the fuel cell.
CONCLUSION :
- Successfully explained the working principle of the model in detail Also, Simulated the model and explained the results.
- Discussed the voltage and current characteristics in the resultant graph.
REFERENCES :