To plot the given function using "SIMULINK" and run the pre build matlab simulation block of "SUSPENSION SYSTEM COMPARISION".
AIM : To plot the given function using "SIMULINK" and run the pre build matlab simulation block of "SUSPENSION SYSTEM COMPARISION".
MATLAB SIMULINK :
Simulink is a MATLAB-based graphical programming environment for modeling, simulating and analyzing multidomain dynamical systems. Its primary interface is a graphical block diagramming tool and a customizable set of block libraries. It offers tight integration with the rest of the MATLAB environment and can either drive MATLAB or be scripted from it. Simulink is widely used in automatic control and digital signal processing for multidomain simulation and model-based design.

SUSPENSION SYSTEM :
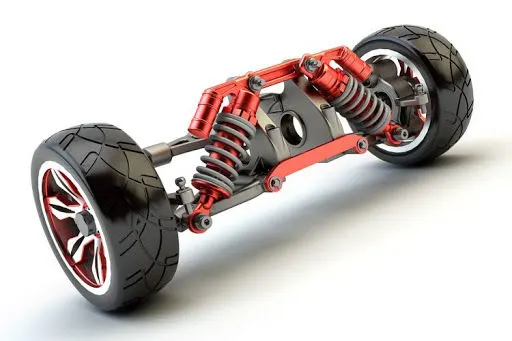
Suspension is the term given to the system of springs, shock absorbers and linkages that connects a vehicle to its wheels Serve a dual purpose contributing to the car's handling and braking. Suspension systems must support both road holding/handling and ride quality, which are at odds with each other. The suspension also protects the vehicle itself and any cargo or luggage from damage and wear.
OBJECTIVE :
- To Plot a function y(x) = (x-1) * (x-3)^2 * (x-9)^2 using basic Simulink blocks.
- To Run Simulink example “Suspension System Comparison” and find answer for the following questions :-
- What is the objective of the simulation? What are the similarities and differences between the three systems understudy ?
- What are your observations from the results ?
- How the oscillating velocity source is created ?
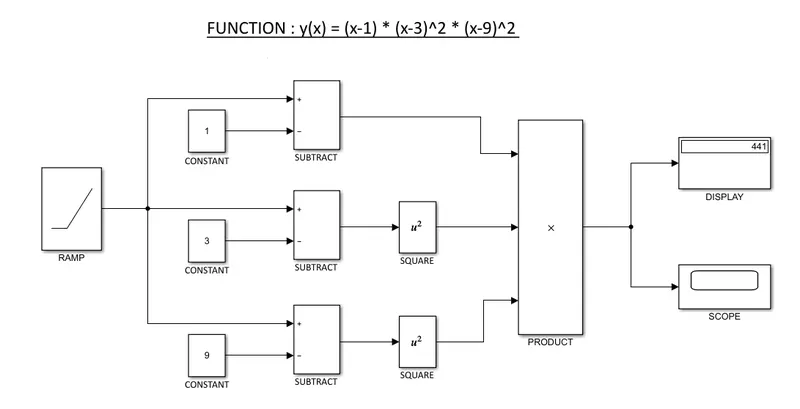
SIMULINK BLOCKS TO REPRESENT y(x) = (x-1) * (x-3)^2 * (x-9)^2 FUNCTION :
SIMULINK BLOCK EXPLANATION :
- In this we are using the RAMP block to run with specified time and value which changes at specified rate.
- The constant block has been used to give the constant values according to function which is further subtracted by using mathetical subtract block.
- Here the Subtraction is the function in which the Ramp and constant value can be subtracted and that output gives to the product Block.
- Then the square block has used to do square the value according to the function.
- The product block has been given 3 inputs in order to multiply the values.
- Display block has been used in order to display the value of function.
- The last block is scope which produces final output signal of the give function and represent the whole operation of blocks.
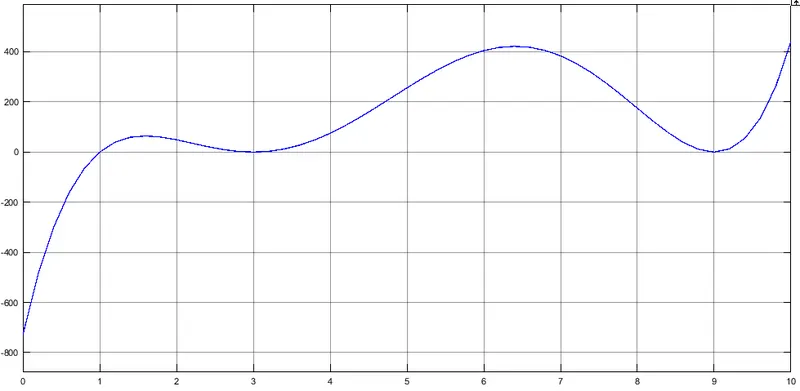
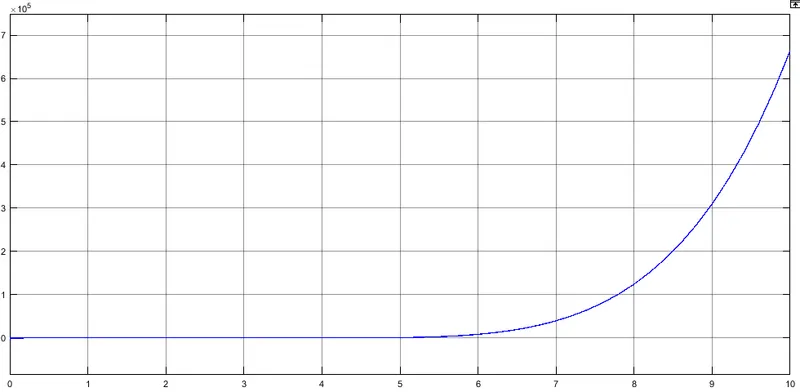
FOR THE ABOVE BLOCK REPRESENTATION OUTPUT PLOTS WOULD BE SHOWN BELOW :
HERE WE TOOK TWO OUTPUTS :
FOR FIRST OUTPUT :
SLOPE VALUE - 1 AND STOP TIME - 10 SEC :
FOR SECOND OUTPUT :
SLOPE VALUE - 2 AND STOP TIME - 10 SEC :
OUTPUT PLOTS EXPLANATION :
- Thus from the above block we get 10 diffenrent values for given time interval (set stop time as 10sec).
- Here we can see the graph,In which the value of 'x' changes for the time the value of product changes respectively.
CONCLUSION : As a conclusion, we can say that Simulink offers strong possibilities. The utilisation is pretty easy for simple problem and makes it easier to build a mathematical model in its environment.
SUSPENSION SYSTEM COMPARISION :
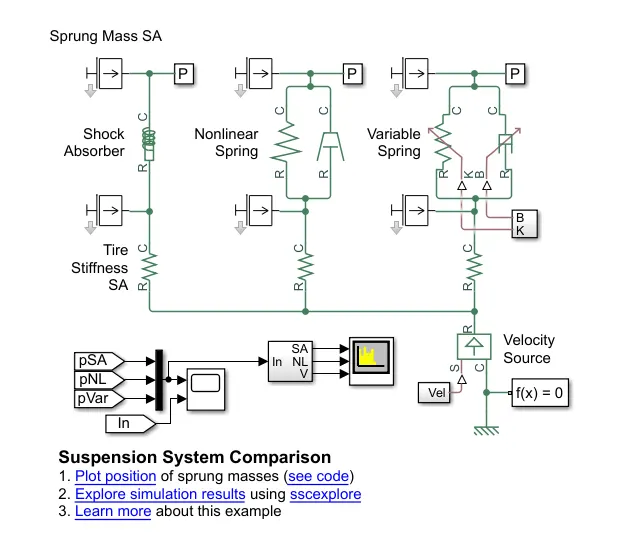
THIS BELOW BLOCK IS A PRE BUILD MATLAB SIMULATION BLOCK :
OBJECTIVE OF THE SIMULATION :
The term simulation refers to the use and development of a model. A model is a theoretical representation of a reality. Simulation is a technique oriented toward active participation by instructor and participants. It also represents an approach or point of entry for providing training in a given situation.
- Present a simplified abstraction of the essential elements of a situation.
-
Make explicit the essential relations and fundamental interactions in a situation.
-
Move the time variable ahead at an accelerated speed so that the implications arising from action taken in a dynamic situation may be clearly experienced.
-
Place the participant in a pressure situation, so that he feels the direct impact of decision-making.
-
Simulink is a graphical modelling & simulation environment of dynamic system. One can create block diagrams, where blocks represents part of the system.
SIMILARITIES AND DIFFERENCE BETWEEN THE THREE SUSPENSION SYSTEM :
HERE WE HAVE 3 TYPES OF SUSPENSION COMBINATION THEY ARE :-
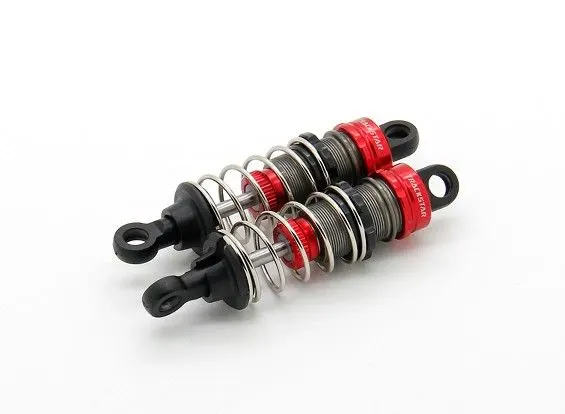
1. SHOCK ABSORBER :
A shock absorber or damper is a mechanical or hydraulic device designed to absorb and damp shock impulses. It does this by converting the kinetic energy of the shock into another form of energy which is then dissipated.
Most shock absorbers are a form of dashpot. An automobile shock absorber contains spring-loaded check valves and orifices to control the flow of oil through an internal piston.
Here spring stiffness co-efficient is constant for the spring and Damping co-efficient for the damper is also constant.
2. NONLINEAR SUSPENTION :
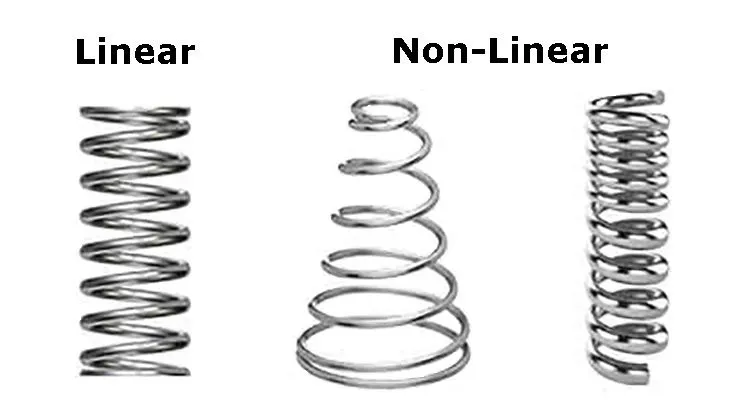
Non-linear springs are helical coil springs that exert an inconsistent amount of force as it is under a working load or torque. This means that the force needed to travel one inch, millimeter, or degree might not double when it travels two inches, millimeters, or degrees like a linear spring would.
Due to the change in outer diameter of each coil, the force each coil will exert will be different, smaller coils will produce more force. This is what makes conical and tapered springs non-linear. The narrowing of each coil makes the spring index of this non-linear spring tighter.
3. VARIABLE SUSPENSION :
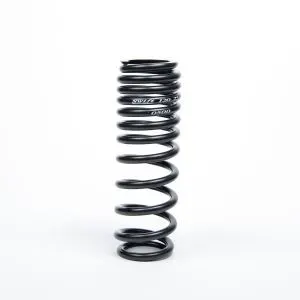
In order to understand variable pitch springs, it’s important to know two key spring parameters : pitch and rate.
Spring pitch is the distance between two adjacent coils, measured from the midpoint of the spring material.
Spring rate is the ratio of force required to deform a spring to the extent of deformity. In compression springs, spring rate measures how difficult it is to compress the spring in extension springs, spring rate measures how difficult it is to extend the spring.
OBSERVATION FROM THE RESULT :
OUTPUT PLOTS OF THE ABOVE PRE-BUILD BLOCK OF SUSPENSION SYSTEM :
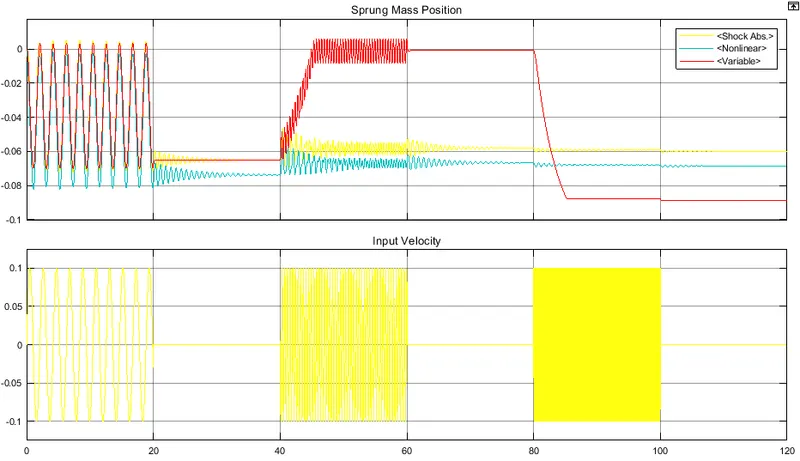
Here the above OUTPUT is divided into two graphs, i.e. uper side represents "INPUT VELOCITY" with respect to "TIME" and the downward side represents "SPRUNG MASS POSITION" with respect to "TIME".
From this results we can observe that, for low velocity the shock absorber and variable spring act similarly but the nonlinear spring has slightly more negative sprung mass position.
SPECTRUM ANALYZER :
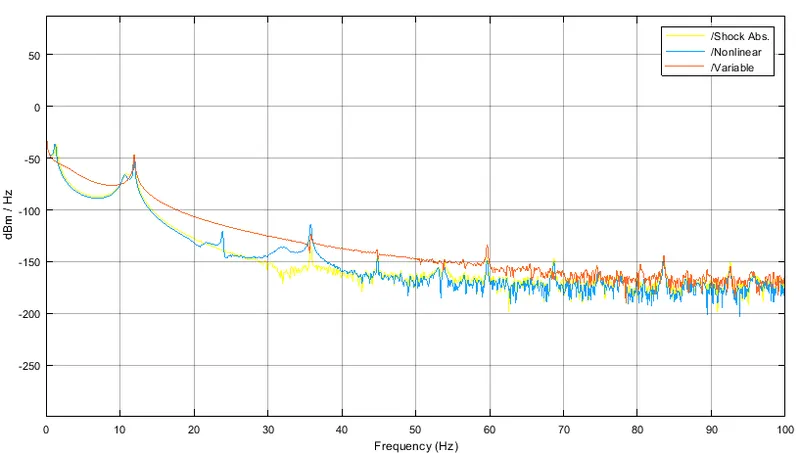
This above graph is a plot of "Frequency (Hz)" v/s "dbm/Hz", Where it shows noise level variation in terms of power (dbm/Hz) for different suspension systems.
Varaiable spring are conical spring that varies with the coil pitch due to this suspension process takes more duration of time and stiffness also not stable it may changes from low to high displacement. Data of output are colllected in pVar to plot the graph and compare with the other system.
OSCILLATING VELOCITY SOURCE :
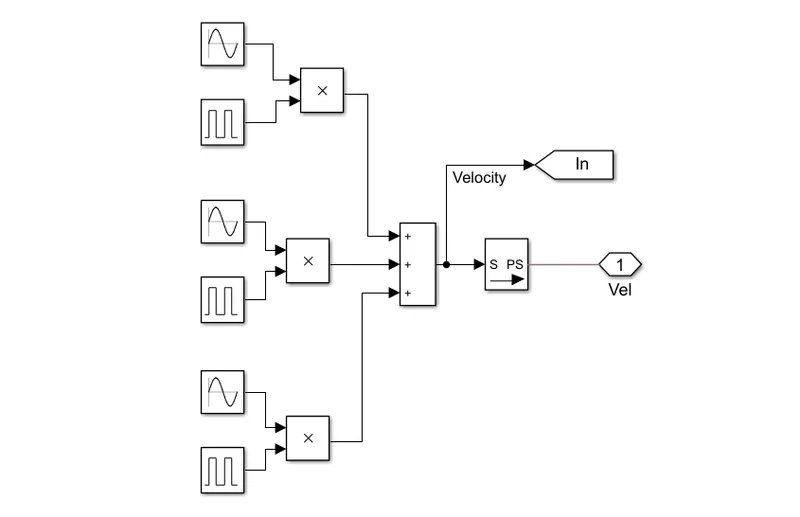
The input for the above 3 suspensions is the "Velocity".Here velocity modeling is done for input of suspension system which is common for all the suspension system and it is provided by using sine wave block and pulse generators, these will be varied for each case and behaviour of the suspension system is observed.
First set represents slow velocity, second set represents medium velocity and third set represents high velocity. These different types of velocities are achieved by changing the sine type parameter and frequency parameter in sine wave block and by changing phase delay parameter in the pulse generator block. By changing these parameters we can achieve different velocities and all these velocities together are given as input to all three suspension systems.
CONCLUSION :
Similar kind of approach can be used to plot ant type of function using Simulink. The nonlinear spring are similar to the shock absorber but the stiffness is low. Various other examples can be studied and understood in the similar manner in Simulink.